International Journal of Business and Social Science Vol. 3 No. 18 [Special Issue – September 2012]
Corporate Governance Perception Index (CGPI) and Cost of Debt
Juniarti
Department of Accountancy
Petra Christian University
Indonesia
The Lia Natalia
Talent Recruitment Program at Bank of Tokyo Mitsubishi UFJ
Abstract
Corporate Governance Perception Index (CGPI) is the ranking of good corporate governance by Indonesian Institute for Corporate Governance (IICG) with SWA magazine. Companies that follow the CGPI survey showed a willingness to become a trusted and open. This effort should be perceived positively by stakeholders. Some previous researches showed that a corporate governance has a significant impact on the lowering the cost of debt (Piot & Piera 2007; Sengupta & Bhojraj 2003; Ashbaugh & Skaife et al 2006). Therefore, this paper is aimed to search the benefit of GCG implementation to the cost of debt. All companies listed on the Indonesia Stock Exchange (IDX) which have a GCG score for survey period 2004-2009 are selected as a research sample. Other variables such as Debt to Asset (DA), Return on Asset (ROA), Sales Growth (Sgrowth), Firm Size (Fsize and Market to Book (MTB) are considered as control variables. The results do not support the hypothesis. Several explanations, including the low level of creditor’s confidence to the good corporate governance practices have been discussed to support the research findings.
Keywords:
Corporate Governance Perception Index (CGPI), CG Score, Cost of Debt, Firm Size1.
Introduction
The implementation of Good Corporate Governance (GCG) can be indicated by applying of GCG’s principles, such as transparency, accountability, responsibility, fairness and independency. GCG emphasizes on stakeholder right to get precise, transparent and timely information about company’s performance and ownership (Sulistyanto & Meniek, 2003).
The role of GCG’s principles to the cost of debt (CoD) have been searched by Chen & Jian (2007), the conclusion is transparency in providing information will diminish default risk and finally reduce the CoD. Piot & Piera (2007) searched the affect of GCG and audit quality toward CoD, the result showed that there is a significant affect of GCG to the CoD. Rinaningsih (2009) also proved that GCG and Bond rating have significant association. Prior them, Sengupta & Bhojraj (2003) have iniated to research affect of GCG to the Bond Rating using 1005 Bonds issued between 1991-1996. The results showed that companies which implement GCG enjoyed higher bond rating.
To promote implementation of GCG, Government of Indonesia (GoI) through Indonesia Institute of Corporate Governance (IICG) has iniated to rank the level of GCG implementation (Suprayitno et al. 2005). Regularly, since 2001, IICG conducted research to evaluate GCG practices by companies. The ranking was namely Corporate Governance Perception Index (CGPI). There are ten aspects of GCG which assessed i.e (1) the company’s commitment on GCG, (2) transparency, (3) accountability, (4) responsibilities, (5) independency, (6) fairness, (7) competence, (8) mission statement, (9) leadership and (10) staff colaboration.
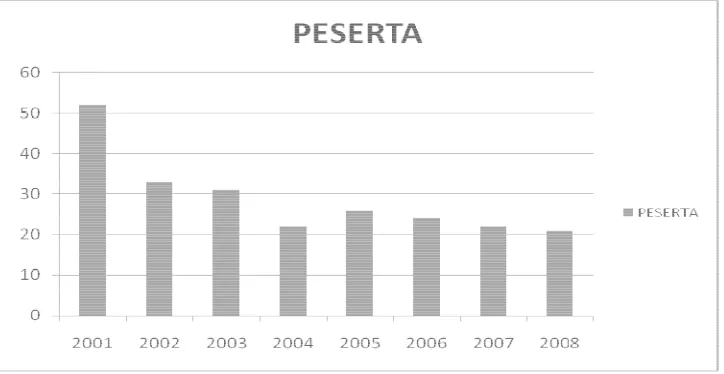
According to Miharjo (2008), GCG imp commisioner, audit committee, tran participation in the CGPI research wi participation in the CGPI research wil lower cost of capital, efficient and effe value.
However, figure 1 shows that the part Binhaldi highlights three main factors marketing of CGPI events, (2) a number some companies have realized the poten benefits derived through achieving the le
It is interesting to investigate whether research support that some benefits exis that the benefit still questionable.
2.
Hypothesis Development
CoD is the return that must be receive (2003) calculate CoD using the bond y interest expense to average interest bea then the study will measure CoD using
Interest expense can be obtained from obtained by analyzing financial statem Bearing Debt is obtained from the avera
Default risk is considered in the credit a score due to it represents the performan seen as a trusted company and assesse return from the company.
Blom & Schauten (2006) investigated
Figure 1. CGPI Participant
mplementation is costly since companies are required anparent accounting information system etc. Bes will add management’s tasks. Therefore manageme
ill offer some gains such as increasing investor an ffective resources allocation which finally lead to
articipation of the companies in the CGPI research rs explain the drop of CGPI participation: (1) the l ber of companies do not feel confidence with their GC
tential benefits of GCG implementation but it is not w e level of CGPI. (SWA Magazine No 26/XXII/11)
the benefit of implementing GCG really exist. Al ist, but the decreasing of participant in GCG survey o
ved by the creditors on their loan (Fabozzi, 2007). ments liabilities that contributed to the interest expe rage Interest Bearing Debt periods t and t-1.
International Journal of Business and Social Science Vol. 3 No. 18 [Special Issue – September 2012] Anderson et.al (2003) also supported that CoD has a negative correlation with GCG practice. In their research, GCG practice was showed by the existence of independent board of commissioner, number of board commissioner and audit committee structure. GCG practices which assessed by authoritative party provide the creditor the assurance that the companies do not hide material information that potentially mislead in decision making. Then, companies which have good rating of their GCG practice will enjoy lower CoD. Therefore the hypothesis 1 proposed is :
H1: GCG score has a negative influence to the CoD.
According to previous researches, there are many other variables that affect CoD rate. Chen & Jian (2006) showed that debt to assets ratio (D/A) affect the CoD. The composition of debt to asset shows company assets protection to its creditor. The higher the debt to asset ratio, the higher the creditor claim to company’s asset. Therefore, it will trigger potential conflict of interest between company and creditor (Ahmed, Billings, Morton, and Stanford & Harris, 2002). From the creditors’view, the higher D/A the higher the risk of the company, thus creditor will charge the higher CoD to compensate the risk. Anderson et.al (2003), using D/A as a control variable also found that there was a positive relationship between D/A and CoD. Using D/A as a control variable, the hypothesis 2, is proposed below :
H2 : D/A has a positive influence to the CoD
Low CoD rate will also be enjoyed by companies that have high return on assets (ROA) ratio. Since ROA indicate the capality of companies to create return from their assets, thus higher ROA means good performance of companies’operation. Creditor will appreciate company with higher ROA with lower CoD rate. Therefore ROA have a negative correlation to the CoD. This is supported by the research result of Chen & Jian (2006), Piot and Piera (2007) which prove that ROA have a negative affect to the CoD. Therefore hypothesis 3, is proposed as follow :
H3 : ROA has a negative affect to the CoD.
Firms with more growth opportunities will have lower leverage as the agency costs associated with the debtholder–stockholder conflict is likely to be a positive function for such firm (Kim & Lyn, 1986). According to (Myers, 1977), companies having better growth opportunities will have a tendency to finance their business with equity rather than debt. Using sales growth as a measurement of growth (Chen & Jian 2006), then the following hypothesis is proposed :
H4 : Sales growth has a negative affect to the CoD
Bhojraj & Sengupta (2003) suggest that big firms will obtain lower bond yield and higher bond rating due to their low market risk. Besides that, big firms have more resources to produce information disclosure that is more attractive to media and analyst (Chen & Jian 2006), since the company become more transparent than others. One of the firm size measurement is asset total. Company’s asset owned shows the company’ability to repay its loan, thus credit risk for such a company should be low (Pittman & Fortin 2003). Anderson et al. (2003) proved that firm size has a negative correlation to CoD. Chen & Jian (2006), Piot & Piera (2007) also proved the same result. Therefore hipotheses 5 is proposed as follow:
H5 : Firm size has a negative affect to CoD.
Binsbergen, Graham & Yang (2010) found that firms with growth opportunities that is low market-to-book (MTB) on average face a higher cost of debt. According to Myers (1977), growth firms have a higher cost of debt due to they use their assets to growth. On the other hand, debt forcing firms to comply covenant otherwise penalty will be imposed, this potentially resctricts the firms to exercise their assets to invest and growth. According to previous researches, hypothesis 6 is proposed as follow:
H6 : Market to book ratio a positive affect to CoD
3.
Research Methods
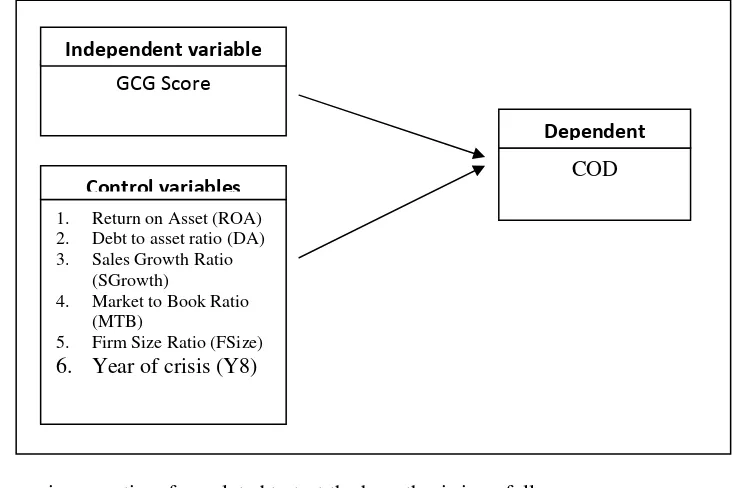
Figure 2. Model Analysis
Regression equation formulated to test the hypothesis is as follow: CoD = 0 + 1 GCG + 2 ROA + 3 DA + 4 SGrowth + 5 MTB +
6 FSize + 7 Y8 + µ (1)
whereas :
CoD : Cost of Debt
0 : constant
1,2,3,4,5,6,7 : regression coefficient of each variable
GCG : GCG Score
ROA : Return on Asset DA : Debt to asset ratio SGrowth : Sales Growth
MTB : Market to Book Ratio FSize : Firm Size
Y8 : Year of crisis (2007-2008)
µ : Error term
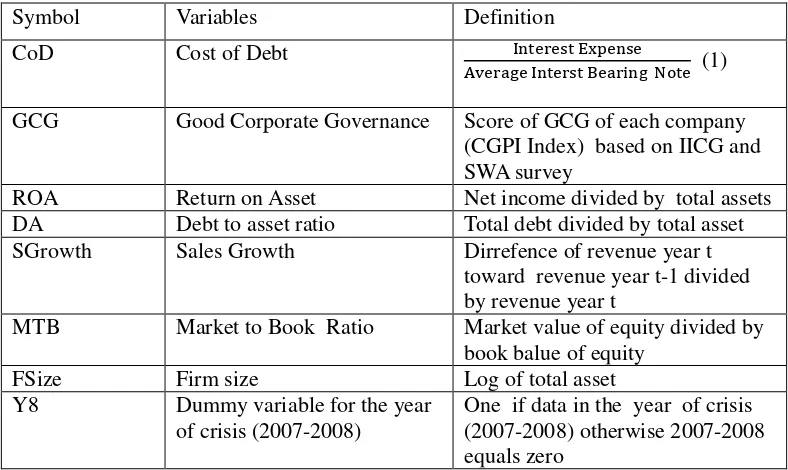
Operationalization of each of variables is summarized in table 1 below:
GCGScore
1. Return on Asset (ROA) 2. Debt to asset ratio (DA) 3. Sales Growth Ratio
(SGrowth)
4. Market to Book Ratio (MTB)
5. Firm Size Ratio (FSize)
6. Year of crisis (Y8)
COD
Independent variable
Control variables
International Journal of Business and Social Science Vol. 3 No. 18 [Special Issue – September 2012] Table 1 : Operationalisation of Variables
Symbol Variables Definition
CoD Cost of Debt !"!# $%&! #!
'(!")*! !"# +!)", * -. ! (1)
GCG Good Corporate Governance Score of GCG of each company (CGPI Index) based on IICG and SWA survey
ROA Return on Asset Net income divided by total assets
DA Debt to asset ratio Total debt divided by total asset
SGrowth Sales Growth Dirrefence of revenue year t
toward revenue year t-1 divided by revenue year t
MTB Market to Book Ratio Market value of equity divided by book balue of equity
FSize Firm size Log of total asset
Y8 Dummy variable for the year
of crisis (2007-2008)
One if data in the year of crisis (2007-2008) otherwise 2007-2008 equals zero
Accordance with the objective of this research, the sample used in this research limited to companies which participate in CGPI survey. Thus, these companies are as a unit analysis in this research. Purposive sampling technique is applied in this research. Sample is selected based on the following criteria : (1) participate in CGPI survey for the period 2004-2008, (2) has a thorough annual report for the priod 2005-2009, (3) not a banking or financial institution company, (4) publish GCG score.
4.
Results and Discussions
There are 118 companies which participate in CGPI survey for the period 2004-2008 but remaining 38 companies meet with the sample criteria. Thoroughly selection process is presented in table 2.
Table 2. Sample Selection Process
Selection Criteria Total
Number of companies participate in CGPI survey during 2004-2008
118
Less: bank and financial institution companies
(31)
Less: companies that do not have the complete annual report
(26)
Less: companies that do not publish GCG score
(23)
Total sample 38
Table 3. Descriptive Statistic
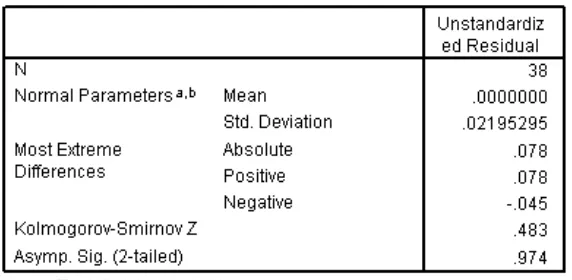
Before testing hypothesis, data need to be tested whether it meet with the classical assumption or not. With a confidence level of 5%, model meets the normality test, autocorrelation, heteroskedasticity and multicolinierity. Kolmogorov-Smirnov is used to test normality. The residual value is 0.974 greater than 0.05, it means that data are normally distributed. Heteroskedasticity test using the White test. Due to the probability of Obs*R-squared is 0.6203 (exceeding 0.05), it can be concluded that heteroskedasticity problem does not exist. Autocorrelation test is performed by the method of Breusch-Godfrey. Result the probability of Obs * R-squared is 0.2985 (exceeding 0.05), it can be concluded that there was no autocorrelation problem. Multicollinearity test can be seen from the VIF value. VIF value for all independent variables data below 10 and tolerance values above 0.1 means that all variables are free from multicollinearity. Tables containing the classical assumption test results are presented in annex 1.
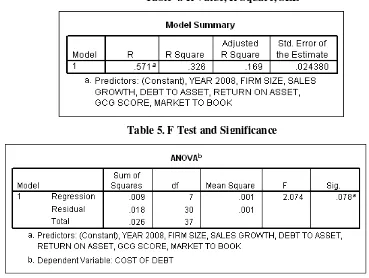
Model summary with R value of 0.571 shows a fairly strong relationship of CoD with all indepennt variables. While R square is 0.326 means that 32.6% of change in CoD can be explained by GCG Score, ROA, D/A, SGrowth, FSize, MTB, and Y8, as shown in table 4. But the significance of independent variables in explaining the change of independent variable is not good enough, because the value of F sig is 0.078 greater than 0.05 (see table 5), however this model is still quite fit on the significance of 10%.
Table 4. R Value, R Square, SEE
International Journal of Business and So Results of regression test a
Table 6
The significance value of GCG score is score to the CoD. The result do not su Blom & Schauten (2006) also Anderso
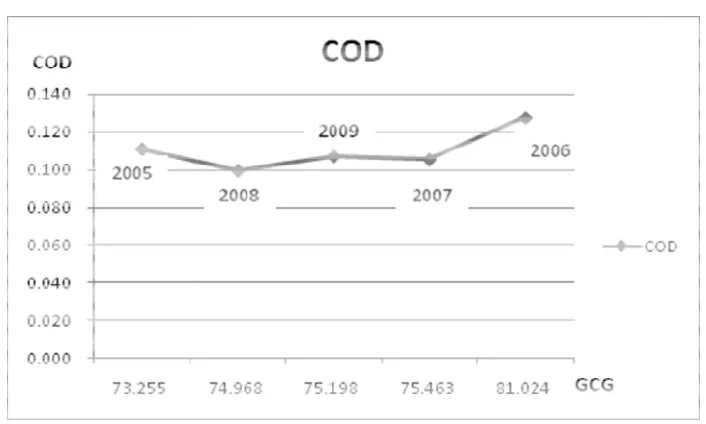
Fi
The research sample data, as presented pattern with the raising and falling of determining cost of debt. GCG score is company which actively involved in G example, as one of the active participan decreased the credibility of the GCG sco
As a new practice to evaluate GCG im indicator to be considered in assessing yet, thefore the number of participant te use GCG score as one of the indicators that although the company has good cor are other factors outside of corporate go company's position in the economy, incl
Social Science Vol. 3 No. 18 [Special Iss st as presented in table 6 below is used to test each hyp
6. Constant, Coefficients, T Test and Sig
is 0.335 greater than 0.05 means that there is no sig support hypothesis 1 and contrarary with some previo
son et.al (2003).
Figure 3. Profile of GCG and COD
d in figure 3 show that the increasing or decreasing f GCG score. It seem that creditors ignore the com is not credible enough to creditor to justify the compan GCG survey do not guarantee to be free from defa pant in GCG survey, surprisingly had defaulted on th score as a representative tool to evaluate company risk
implementation, the GCG survey is still need times g company risk. The participation in GCG survey ha tend to be decline from year to year. This raises furth ors in assessing the required return. Moreover, Setya corporate governance, it does not guarantee high deb
governance should be considered, such as political fac cluding the market sentiment and rumors.
Further, the result of testing hypothes significantly affect to the COD. It is con and Piera (2007). Mahadwartha & Ism share of claim with investors, therefore which stated that ROA, SGrowth have that lending to the old lender usually re produce a more favorable loan agreem lender’s credit history rather than just fi return.
Contrary with the results of hypothesi negative significant affect to the CoD. T et al. (2003), Chen & Jian (2006), and influence market value of book assets. T assets.
To prove the impact year of crisis to hypothesis testing do not confirm the creditor is not affected by the crisis sit sample data also shows that interest exp The short-term period of crisis may be d cost of debt has already been contained
5.
Conclusion and Limitation
This research cannot prove the existing
esis 2 is also do not supported. The result shows t ontrary with the previous results as evidenced by Ch smiyanti (2007) insist that creditor perceives fixed as re D/A is not a significant variable. The results of testi
e a significant affect to the CoD are also not proven. require lower security (collateral) than collateral to th ements for the company. It imply that creditor pay t financial ratio such as D / A, ROA, and SGrowth in
esis testing toward the financial ratio, Fsize on the . Therefore hypothesis 5 is accepted. This result is con
d Piot & Piera (2007). Creditor tend to trust a comp his company is perceived more open in providing in n assymetri and reduce risk. Creditor will expect
t to the CoD as hypothesized in hypothesis 6, how sistent with the previous research (Chen & Jian 200 content to the creditor in assessing company’s r ion of firm performance. There are many factors outs s. That is why creditors do not rely on their decision
to CoD, this research use year of crisis (Y8) as a e significance relationship of year of crisis to the C situation in requiring return. Therefore hypothesis 7 xpense is relatively stable during the period of crisis a e deemed quite safe by creditor not to raise their requir
d in debt covenant and valid for certain period.
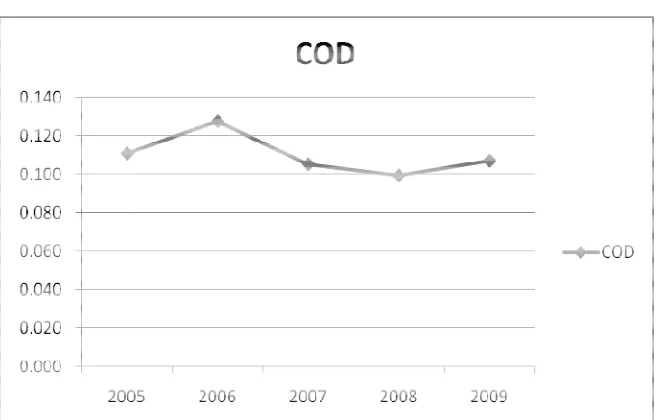
Figure 4. Cost of Debt Profile
ng relationship of GCG implementation proxied by G
s that D/A Ratio do not uired return. Beside that
International Journal of Business and Social Science Vol. 3 No. 18 [Special Issue – September 2012] Some explanations are as follows, firstly, GCG survey is new practice therefore need more time to make users convince with the result. Secondly, the GCG survey is not mandatory, only a few companies participate in this survey. Thirdly, Some companies still can not see the benefit to participate in the GCG survey even costly. While the fourth and the fith explanations are there is no guarantee that firm with high GCG score is free from default risk, and aspects used to measure GCG implementation are still vary, it make companies and users (creditors) confuse with its results.
Further, the results of variable control testing show that only Fsize has a strong affect to the CoD, while other five variables such as D/A, ROA, SGrowth MTB, Y8 have no affect to the CoD. However all the variables have the explanation value in changes of CoD, using 10% confidence level.
Since GCG score is one of the proxies of GCG implementation, it give an opportunity for future research to use another measurement of GCG implementation, so the robustness problem in this current research could be fixed. Extended the sample period is also another opportunity for future research to improve the current result and to closeness the results with the real fact.
6.
References
Ahmed, A., Billings, B., Morton, R., and Stanford-Harris, M. (2002). The role of accounting conservatism in mitigating
bondholder-shareholder conflicts over dividend policy and in reducing debt costs. Accounting Review, 77 (4) 867–890.
Almilia, Luciana Spica dan Lailul L. Sifa. (2006, Agustus). Market Reaction to the corporate governance perception index in
the JSX’s companies (Reaksi pasar publikasi corporate governance perception index pada perusahaan yang
terdaftar di bursa efek Jakarta). Simposium Nasional Akuntansi IX. Padang.
Anderson, et.al. (2003). Board characteristics, accounting report integrity, and the cost of debt. August 31,2010 Online:
http://papers.ssrn.com/sol3/papers.cfm?abstract_id=491883
Bharath, Sreedhar, T., et al. (2004). Do sophisticated investors understand accounting quality? Evidence from bank loans.
August 31, 2010 Online: http://www.bis.org/bcbs/events/rtf04sunder.pdf
Bhojraj, S., Sengupta, Partha. (2003). Effect of corporate governance on bond ratings and yields. August 31, 2010 Online:
http://papers.ssrn.com/sol3/papers.cfm?abstract_id=291056
Binsbergen, J.H. Graham, J. and Yang J (2010, Mei). The Cost of Debt. Working Paper No 16023. National Bureau of
Economic Research, Massachusetts.
Blom, J., Schauten, B., Marc (2006). Corporate governance and the cost of debt. August 31, 2010 Online:
http://papers.ssrn.com/sol3/papers.cfm?abstract_id=933615
Brigham, Eugene F. (2004). Fundamentals of financial management (10th Edition). Canada: Brigham Houston.
Chen, Y.M & Jian J.Y. (2007). The impact of information disclosure and transparency ranking system (IDTRS) and corporate
governance structure on interest cost of debt. Working Paper, National Yunlin University of Science and Technology,
Taiwan.
Denis, D., and V. Mihov. (2002). The choice among bank debt, non-bank private debt and public debt: Evidence from new
corporate borrowings. August 31, 2010, Online: http://papers.ssrn.com/sol3/papers.cfm?abstract_id=269129
Fabozzi, Frank.J. (2007). Bond markets, analysis, and strategies (7th Edition). New Jersey: Prentice Hall.
Gitman, Lawrence. (2006). Principles of managerial finance (11th Edition). San Diego: Addison Wesley.
Mahadwartha, Putu Anom., Ismiyanti, F. (2007, Juli). Does debt affect firm financial performance? The role of debt on
corporate governance in Indonesia. Simposium Nasional Akuntansi X. Makassar.
Miharjo, Setiyono. (2008). Corporate governance dan kinerja perusahaan. August 31, 2010. Online:
http://investor.co.id/home/
Myers, Stewart C., 1977, Determinants of Corporate Borrowing, Journal of Financial Economics, 5, 147-175.
Nasution, Anwar. (1997, Desember). Lessons from the recent financial crisis in Indonesia. Economics Conference. Jakarta.
Piot, C. & Pierra, F.M. (2007). Corporate governance, audit quality, and the cost of debt financing of French listed
companies. August 31, 2010. Online: http://papers.ssrn.com/sol3/papers.cfm?abstract_id=960681
Pittman, J.A. & Fortin, S. (2004), Auditor choice and the cost of debt capital for newly public firms, Journal of Accounting
and Economics, 37 (1), 113-136.
Prevost, Andrew K., Christopher J. Skousen, Ramesh P. Rao. (2008). Earnings management and the cost of debt. August 31,
2010 Online: http://papers.ssrn.com/sol3/papers.cfm?abstract_id=1083808
Rahayu, Eva Martha. (2006, Desember). Measuring GCG 2006 (Mengukur GCG 2006). SWA Sembada. 22 (26), 247.
Rinaningsih. (2009). The influence of corporate governance practice towards credit and bond yields. Journal of Indonesian
Economy and Business. 24 (2), 249-265.
Setyaningrum, Dyah. (2005, Juli-Desember). The impact of corporate governance mechanism to the debt rating in
Indonesia’s companies (Pengaruh mekanisme corporate governance terhadap peringkat surat hutang perusahaan di
Sijabat, Rosdiana. (2008). Good corporate governance Tinjauan teoritis dan praktis. Jurnal Bisnis, Ekonomi dan Sosial, 1 (1), 25 – 43.
Stock, James H., Mark W., Watson. (2007). Introduction to econometrics. Amsterdam: Addison Wesley.
Sulistyanto, H.Sri, dan Meniek, S. Prapti. (2003, Januari). Good corporate governance: Can it increase the public
confidence? (Bisakah meningkatkan kepercayaan masyarakat). EKOBIS, 4 (4), 22-42.
Suprayitno, G., Khomsiyah, Darmawati, D., Yasni. (2005). CGP Index Report 2005, actualize good corporate governance as a
system (Laporan corporate governance perception index 2005 mewujudkan good corporate governance sebagai
sebuah sistem). Jakarta: The Indonesian Institute for Corporate Governance.
Tjager, I. Nyoman, Alijoyo, F.A., Djemat, H.R., Soembodo, B. (2003). Corporate governance: Challanges and opportinities
for the Indonesia’s business community (T antangan dan kesempatan bagi komunitas bisnis Indonesia). Jakarta: Prenhallindo.
Appendix 1 : Classical Assumption Test
Table 1 . Normality Test
Table 2. Heteroskedasticity
Table 3. Autocorrelatin Test