-
Q
U
E
S
T
ION
N
A
I
RE-
Additional question:
Ketika belajar “preposition” kamu paling suka kalau:
a. Bu Guru menunjukkan gambar-gambar
b. Bu Guru menjelaskan arti preposition saja
c. Bu Guru menyuruh kamu bergerak sesuai preposition yang
disebutkan Bu Guru
No Pe rta nya a n Ya Tid a k
1. Apakah kamu suka membuat mainan dari dough? 2. Apakah kamu suka menggambar dan mewarnai? 3. Apakah kamu suka dibacakan cerita oleh papa/mama?
4. Apakah kamu lebih bisa mengerti pelajaran kalau ibu/bapak guru
menuliskannya di papan?
5. Apakah kamu lebih bisa mengerti pelajaran kalau ibu/bapak guru
memberikan games?
6. Apakah kamu lebih bisa mengerti pelajaran kalau ibu/bapak guru
menjelaskannya tanpa menuliskan di papan?
7. Apakah kamu suka berolahraga? 8. Apakah kamu suka mendengarkan lagu? 9. Apakah kamu suka menonton TV?
10. Apakah kamu tidak suka kalau di kelas teman-teman jalan-jalan atau
berlari-lari?
11. Apakah kamu tidak suka kalau teman-teman ramai waktu pelajaran? 12. Apakah kamu tidak suka kalau kursi dan meja di kelas tidak rapi. 13. Apakah kamu lebih suka membaca buku pelajaran ketika menghafal ? 14. Apakah kamu lebih suka membaca buku keras-keras ketika menghafal? 15. Apakah kamu mengerjakan soal-soal latihan agar cepat menghafal
pelajaran?
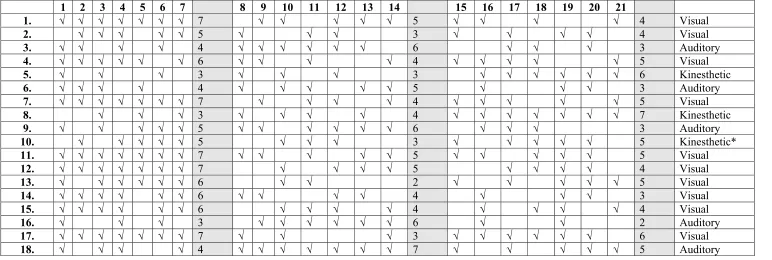
Question Number:(Visual) Question Number : (Auditory) Question Number : (Kinesthetic)
Students’
Numbers 1 2 3 4 5 6 7 Total 8 9 10 11 12 13 14 Total 15 16 17 18 19 20 21 Total Classification
1. √ √ √ 3 √ √ √ √ √ 5 √ √ √ 3 Auditory
2. √ √ √ √ √ √ √ 7 √ √ √ √ 4 √ √ √ √ √ 5 Visual
3. √ √ √ √ √ 5 √ √ √ √ √ 5 √ √ 2 Visual*
4. √ √ √ √ √ √ 6 √ √ √ √ 5 √ √ √ 3 Visual
5. √ √ √ √ 4 √ √ √ √ 4 √ √ √ 3 Visual*
6. √ √ √ √ 4 √ √ 2 √ √ √ √ √ √ 6 Kinesthetic
7. √ √ √ √ √ √ √ 7 √ √ √ √ 4 √ √ √ √ 4 Visual
8. √ √ √ √ √ √ 6 √ √ √ √ 4 √ √ √ 3 Visual
9. √ √ √ √ √ √ √ 7 √ √ √ √ 4 √ √ √ √ √ √ √ 7 Kinesthetic*
10. √ √ √ √ √ √ 6 √ √ √ √ √ 5 √ √ √ √ √ 5 Visual
11. √ √ √ √ √ 5 √ √ 2 √ √ √ √ 4 Visual
12. √ √ √ √ √ √ 6 √ √ √ √ √ 5 √ √ √ 3 Visual
13. √ √ √ √ √ 5 √ √ √ √ √ √ √ 7 √ √ 2 Auditory
14. √ √ √ √ 4 √ √ √ 3 √ √ √ √ √ √ 6 Kinesthetic
15. √ √ √ √ √ √ √ 7 √ √ √ √ √ 5 √ √ √ √ 4 Visual
16. √ √ √ √ √ √ √ 7 √ √ √ √ √ 5 √ √ √ √ √ √ 6 Visual
17. √ √ √ √ √ 6 √ √ √ 3 √ √ √ 3 Visual
18. √ √ √ √ 4 √ √ 2 √ √ √ √ √ √ 6 Kinesthetic
19. √ √ √ √ √ 5 √ √ √ √ √ √ 6 √ √ √ 3 Auditory
Table 2.1
*) Those students had 2 dominant learning styles. Therefore, their one most dominant learning style was determined by the additional question.
Students’ Question Number:(Visual)
Total Question Number : (Auditory) Total Question Number : (Kinesthetic) Total Classification
*) Those students had 2 dominant learning styles. Therefore, their one most dominant learning style was determined by the additional question.
1 2 3 4 5 6 7 8 9 10 11 12 13 14 15 16 17 18 19 20 21
1. √ √ √ √ √ √ √ 7 √ √ √ √ √ 5 √ √ √ √ 4 Visual
2. √ √ √ √ √ 5 √ √ √ 3 √ √ √ √ 4 Visual
3. √ √ √ √ 4 √ √ √ √ √ √ 6 √ √ √ 3 Auditory
4. √ √ √ √ √ √ 6 √ √ √ √ 4 √ √ √ √ √ 5 Visual
5. √ √ √ 3 √ √ √ 3 √ √ √ √ √ √ 6 Kinesthetic
6. √ √ √ √ 4 √ √ √ √ √ 5 √ √ √ 3 Auditory
7. √ √ √ √ √ √ √ 7 √ √ √ √ 4 √ √ √ √ √ 5 Visual
8. √ √ √ 3 √ √ √ √ 4 √ √ √ √ √ √ √ 7 Kinesthetic
9. √ √ √ √ √ 5 √ √ √ √ √ √ 6 √ √ √ 3 Auditory
10. √ √ √ √ √ 5 √ √ √ 3 √ √ √ √ √ 5 Kinesthetic*
11. √ √ √ √ √ √ √ 7 √ √ √ √ √ 5 √ √ √ √ √ 5 Visual
12. √ √ √ √ √ √ √ 7 √ √ √ √ 5 √ √ √ √ 4 Visual
13. √ √ √ √ √ √ 6 √ √ 2 √ √ √ √ √ 5 Visual
14. √ √ √ √ √ √ 6 √ √ √ √ 4 √ √ √ 3 Visual
15. √ √ √ √ √ √ 6 √ √ √ √ 4 √ √ √ √ 4 Visual
16. √ √ √ 3 √ √ √ √ √ √ 6 √ √ 2 Auditory
17. √ √ √ √ √ √ √ 7 √ √ √ 3 √ √ √ √ √ √ 6 Visual
18. √ √ √ √ 4 √ √ √ √ √ √ √ 7 √ √ √ √ √ 5 Auditory
Table 2.2
The Result of Questionnaire of Experimental Group
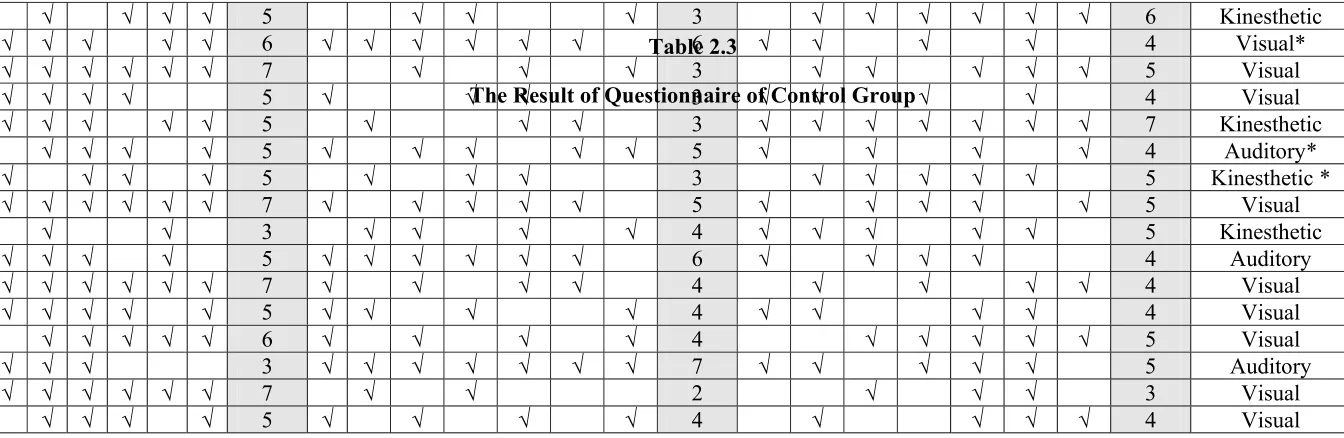
Question Number:(Visual) Question Number : (Auditory) Question Number : (Kinesthetic)
Students’
Numbers 1 2 3 4 5 6 7 Total 8 9 10 11 12 13 14 Total 15 16 17 18 19 20 21 Total Classification
1. √ √ √ √ √ √ √ 7 √ √ √ √ 4 √ √ 2 Visual
*) Those students had 2 dominant learning styles. Therefore, their one most dominant learning style was determined by the additional question.
3. √ √ √ √ √ 5 √ √ √ 3 √ √ √ √ √ √ 6 Kinesthetic
4. √ √ √ √ √ √ 6 √ √ √ √ √ √ 6 √ √ √ √ 4 Visual*
5. √ √ √ √ √ √ √ 7 √ √ √ 3 √ √ √ √ √ 5 Visual
6. √ √ √ √ √ 5 √ √ √ 3 √ √ √ √ 4 Visual
7. √ √ √ √ √ 5 √ √ √ 3 √ √ √ √ √ √ √ 7 Kinesthetic
8. √ √ √ √ √ 5 √ √ √ √ √ 5 √ √ √ √ 4 Auditory*
9. √ √ √ √ √ 5 √ √ √ 3 √ √ √ √ √ 5 Kinesthetic *
10. √ √ √ √ √ √ √ 7 √ √ √ √ √ 5 √ √ √ √ √ 5 Visual
11. √ √ √ 3 √ √ √ √ 4 √ √ √ √ √ 5 Kinesthetic
12. √ √ √ √ √ 5 √ √ √ √ √ √ 6 √ √ √ √ 4 Auditory
13. √ √ √ √ √ √ √ 7 √ √ √ √ 4 √ √ √ √ 4 Visual
14. √ √ √ √ √ 5 √ √ √ √ 4 √ √ √ √ 4 Visual
15. √ √ √ √ √ √ 6 √ √ √ √ 4 √ √ √ √ √ 5 Visual
16. √ √ √ 3 √ √ √ √ √ √ √ 7 √ √ √ √ √ 5 Auditory
17. √ √ √ √ √ √ √ 7 √ √ 2 √ √ √ 3 Visual
18. √ √ √ √ √ 5 √ √ √ √ 4 √ √ √ √ 4 Visual
Table 2.3
Name: ………..
Class: I - …… no……..
I.
Look at the pictures and fill in the blanks the color of
Peter’s clothes!
Peter is my friend. He studies at Sunshine
Elementary School. He wears uniform when he goes to
school. On Mondays and Tuesdays, he wears a
(1)…….………. shirt, (2)……….. pants,
and ……….…… shoes.
On Wednesdays and Thursdays, he wears a
(4)………. shirt, (5) ……… pants, and
(6) ……… shoes.
Monday and Tuesday Wednesday and Thursday Friday and Saturday
He has a sport time on Fridays and Saturdays. He
likes playing football very much. When he plays a football,
he wears a (7)………..shirt, (8)……….shorts, and
(9) ……….socks, and (10) ……….shoes.
All of Peter’s uniforms are so great!
II.
Choose the size of these things!
True or false? Tick the correct box!
red
yellow
green
blue
brown
purple
pink
black
gray orange
11. The girl is fat
12. The caterpillar is small.
13. The boy is tall.
14. The giraffe is short.
15. The cat is thin.
16. The cow is fat.
17. The elephant is small.
18. The bird is big.
19. The policeman is short.
20.The bee is small.
III.
What shape it is?
21.
It is a __________
22.
23.
24. It is a ___________
25.
It is an ___________
IV.
Match the sentence with the picture!
26.
I have a triangle and a star.
27.
These are a circle and an oval.
28.
Victor draws an oval and a square.
29.
There are two squares.
It is a __________
It is a __________
It is a __________
It is an __________
triangle
oval
rectangle
square
30.
Jack has a rectangle and a triangle.
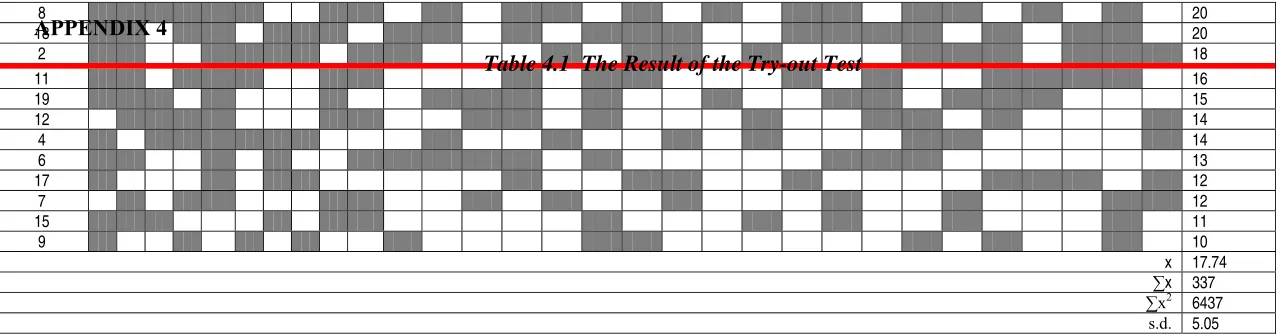
Number of Item Students’
Number 1 2 3 4 5 6 7 8 9 10 11 12 13 14 15 16 17 18 19 20 21 22 23 24 25 26 27 28 29 30 Total of Correct Answer (x)
13 25
5 25
10 23
16 23
1 23
14 22
Test of reliability R =
=
= 0.74
The reliability coefficient of the try-out test is 0.74.
8 20
18 20
2 18
11 16
19 15
12 14
4 14
6 13
17 12
7 12
15 11
9 10
x 17.74
∑x 337
∑x2 6437 s.d. 5.05
1 --
Table 4.1 The Result of the Try-out Test
APPENDIX 4
THE TABLE OF STUDENTS’ REGULAR TEST SCORE
Table 5.1 The Regular Test Score of Visual Learners
Pilot Group Experimental Group Control Group ID Mark
(x)
x2 ID Mark (x)
x2 ID Mark (x)
x2
2 7.8 60.84 1 7.8 60.84 1 6.5 42.25
3 9.7 94.09 2 10 100 4 7 49
4 7.2 51.84 4 10 100 5 8.5 72.25
5 10 100 7 6.5 42.25 6 10 100
7 8.0 64 11 6.5 42.25 10 6.5 42.25
8 8.7 75.69 12 7.4 54.76 13 6.5 42.25 10 10 100 13 8.6 73.96 14 10 10
11 8.1 65.61 14 9.8 96.04 15 9 81
12 7.8 60.84 15 7 49 17 10 100
15 6.5 42.25 17 10 100 18 7.8 60.84
16 9.5 90.25
17 7.6 57.76
∑x 100.9 863.17 ∑x 83.6 719.1 ∑x 81.8 689.84
x 8.41 x 8.36 x 8.18
Table 5.2 The The Regular Test Score of Auditory Learners
Pilot Group Experimental Group Control Group ID Mark
(x)
x2 ID Mark (x)
x2 ID Mark (x)
x2
1 10 100 3 10 100 2 9.2 84.64
13 10 100 6 8 64 8 7.2 51.84
19 8.1 65.61 9 7 49 12 9.5 90.25
16 9.3 86.49 16 7.8 60.84
18 7 49
∑x 28.1 265.61 ∑x 41.3 384.49 ∑x 33.7 287.57
x 9.37 x 8.26 x 8.425
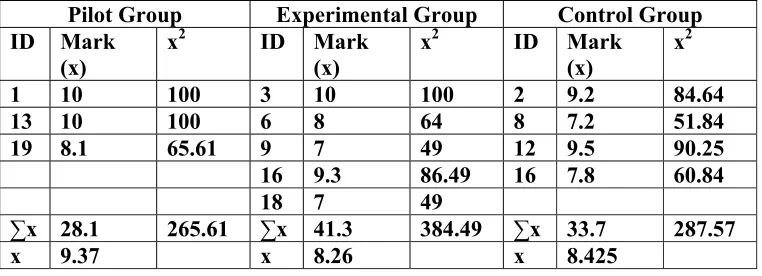
Table 5.3 The The Regular Test Score of Kinesthetic Learners
Pilot Group Experimental Group Control Group ID Mark
(x)
x2 ID Mark (x)
x2 ID Mark (x)
x2
6 7.8 60.84 5 9 81 3 8 64
9 6.5 42.25 7 7.8 60.84 7 7 49
14 8.6 73.96 10 6.8 46.24 9 10 100
18 8.8 77.44 11 8.2 67.24
∑x 31.7 254.49 ∑x 23.6 188.08 ∑x 33.2 280.24
x 7.925 x 7.87 x 8.3
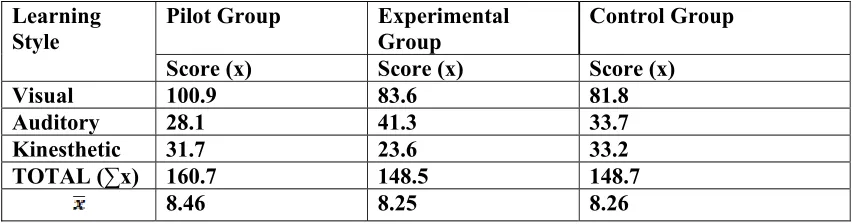
Table 5.4 The The Regular Test Score of the Students in general
Pilot Group Experimental Group
Control Group Learning
Style
Score (x) Score (x) Score (x)
Visual 100.9 83.6 81.8
Auditory 28.1 41.3 33.7
Kinesthetic 31.7 23.6 33.2
TOTAL (∑x) 160.7 148.5 148.7
TEST OF HYPOTHESIS OF THE REGULAR TEST SCORE OF THE STUDENTS IN GENERAL
I. PILOT GROUP – EXPERIMENTAL GROUP
1. Formulating the hypothesis of analyzing the data:
Ho : μA=μB, there is no significant difference between the students in pilot group and experimental group in general.
Ha : μA>μB, there is a significant difference between the students in pilot group and experimental group in general.
T-test where df= nA+nB – 2 = 19+18 -2 =35 t(5%) = 1.684
2. Calculation for t-observation (to): Pilot Group
= = 8.46
s.d. =
=1.157
Experimental Group =
=
8.253. Calculating the standard scores (to) using the formula as follows:
to =
= 0.51
4. Conclusion
Because | t-observation | is 0.51 < t(5%), Ho is accepted and Ha is rejected. It means that there is no significant difference between the students in pilot group and experimental group in general.
II.PILOT GROUP – CONTROL GROUP
1. Formulating the hypothesis of analyzing the data:
Ho : μA=μB, there is no significant difference between the visual learners in pilot group and experimental group.
Ha : μA>μB, there is a significant difference between the visual learners in pilot group and experimental group.
2. T-test where df= nA+nB – 2 = 19+18 -2 =35 t(5%) = 1.684
3. Calculation for t-observation (to): Pilot Group
= = 8.46
s.d. =
Control Group
=
=
8.26s.d. = = 1.311
4. Calculating the standard scores (to) using the formula as follows:
to =
= 0.488
5. Conclusion
Because | t-observation | is 0.488 < t(5%) , Ho is accepted and Ha is rejected. It means that there is no significant difference between the visual learners in pilot group and experimental group.
III. EXPERIMENTAL – CONTROL GROUP
1. Formulating the hypothesis of analyzing the data:
Ho : μA=μB, there is no significant difference between the visual learners in pilot group and experimental group.
Ha : μA>μB, there is a significant difference between the visual learners in pilot group and experimental group.
2. T-test where df= nA+nB – 2 = 18+18-2 =34 t(5%) = 1.684
= = 8.25
s.d. =
=1.34 Control Group
=
=
8.26s.d. = = 1.311
4. Calculating the standard scores (to) using the formula as follows:
to =
= 0.023
5. Conclusion
TEST OF HYPOTHESIS OF THE REGULAR TEST SCORE OF VISUAL LEARNERS
PILOT GROUP – EXPERIMENTAL GROUP
9. Formulating the hypothesis of analyzing the data:
Ho : μA=μB, there is no significant difference between the visual learners in pilot group and experimental group.
Ha : μA>μB, there is a significant difference between the visual learners in pilot group and experimental group.
10. T-test where df= nA+nB – 2 = 12+10 -2 =20 t(5%) = 1.725
11. Calculation for t-observation (to): Pilot Group
= = 8.41
s.d. =
=1.159
Experimental Group
=
=
8.36s.d. = = 1.498
to =
= 0.088
13. Conclusion
Because | t-observation | is 0.088 < t(5%), Ho is accepted and Ha is rejected. It means that there is no significant difference between the visual learners in pilot group and experimental group.
I. PILOT GROUP – CONTROL GROUP
1. Formulating the hypothesis of analyzing the data:
Ho : μA=μB, there is no significant difference between the visual learners in pilot group and control group.
Ha : μA>μB, there is a significant difference between the visual learners in pilot group and control group.
2. T-test where df= nA+nB – 2 = 12+10 -2 =20 t(5%/2) = 1.725
3. Calculation for t-observation (to): Pilot Group
= = 8.41
s.d. =
Experimental Group
=
=
8.18s.d. =
= 1.517
4. Calculating the standard scores (to) using the formula as follows:
to =
= 0.404
5. Conclusion
Because | t-observation | is 0.404 < t(5%) , Ho is accepted and Ha is rejected. It means that there is no significant difference between the visual learners in pilot group and control group.
II. EXPERIMENTAL GROUP – CONTROL GROUP
1. Formulating the hypothesis of analyzing the data:
Ho : μA=μB, there is no significant difference between the visual learners in experimental group and control group.
Ha : μA>μB, there is a significant difference between the visual learners in experimental group and control group.
2. T-test where df= nA+nB – 2 = 10+10 -2 =18 t(5%) = 1.734
= = 8.36
s.d. =
=1.498
Control Group
=
=
8.18s.d. =
= 1.517
4. Calculating the standard scores (to) using the formula as follows:
to =
= 0.267
5. Conclusion
TEST OF HYPOTHESIS OF THE REGULAR TEST SCORE OF AUDITORY LEARNERS
I. PILOT GROUP – EXPERIMENTAL GROUP
1. Formulating the hypothesis of analyzing the data:
Ho : μA=μB, there is no significant difference between the auditory learners in pilot group and experimental group.
Ha : μA>μB, there is a significant difference between the auditory learners in pilot group and experimental group.
2. T-test where df= nA+nB – 2 = 3+5 -2 =6 t(5%) = 1.943
3. Calculation for t-observation (to): Pilot Group
=
= 9.37
s.d. =
=1.097
Experimental Group =
=
8.26s.d. =
= 1.356
to =
= 1.191
5. Conclusion
Because | t-observation | is 1.191 < t(5%), Ho is accepted and Ha is rejected. It means that there is no significant difference between the auditory learners in pilot group and experimental group.
II.PILOT GROUP – CONTROL GROUP
1. Formulating the hypothesis of analyzing the data:
Ho : μA=μB, there is no significant difference between the auditory learners in pilot group and control group.
Ha : μA>μB, there is a significant difference between the auditory learners in pilot group and control group.
2. T-test where df= nA+nB – 2 = 3+4 -2 =5 t(5%) = 2.015
3. Calculation for t-observation (to): Pilot Group
=
= 9.37
s.d. =
Control Group
=
=
8.425s.d. = = 1.105
4. Calculating the standard scores (to) using the formula as follows:
to =
= 1.123
5. Conclusion
Because | t-observation | is 1.123 < t(5%), Ho is accepted and Ha is rejected. It means that there is no significant difference between the auditory learners in pilot group and control group.
III. EXPERIMENTAL GROUP – CONTROL GROUP
1. Formulating the hypothesis of analyzing the data:
Ho : μA=μB, there is no significant difference between the auditory learners in pilot group and control group.
Ha : μA>μB, there is significant difference between the auditory learners in pilot group and control group.
2. t-test where df= nA+nB – 2 = 5+4 -2 =7 t(5%) = 1.895
=
= 8.26
s.d. =
=1.356 Control Group
=
=
8.425s.d. = = 1.105
4. Calculating the standard scores (to) using the formula as follows:
to =
= 0.196
5. Conclusion
TEST OF HYPOTHESIS OF THE REGULAR TEST SCORE OF KINESTHETIC LEARNERS
I. PILOT GROUP – EXPERIMENTAL GROUP
1. Formulating the hypothesis of analyzing the data:
Ho : μA=μB, there is no significant difference between the kinesthetic learners in pilot group and experimental group.
Ha : μA>μB, there is a significant difference between the kinesthetic learners in pilot group and experimental group.
2. T-test where df= nA+nB – 2 = 4+3 -2 =5 t(5%) = 2.015
3. Calculation for t-observation (to): Pilot Group
=
= 7.925
s.d. =
=1.044
Experimental Group =
=
7.87s.d. =
= 1.101
to =
= 0.068
5. Conclusion
Because | t-observation | is 0.068 < t(5%), Ho is accepted and Ha is rejected. It means that there is no significant difference between the kinesthetic learners in pilot group and experimental group.
II.PILOT GROUP – CONTROL GROUP
1. Formulating the hypothesis of analyzing the data:
Ho : μA=μB, there is no significant difference between the kinesthetic learners in pilot group and control group.
Ha : μA>μB, there is a significant difference between the kinesthetic learners in pilot group and control group.
2. T-test where df= nA+nB – 2 = 4+4 -2 =6 t(5%) = 1.943
3. Calculation for t-observation (to): Pilot Group
=
= 7.925
s.d. =
Control Group
=
=
8.3s.d. = = 1.248
4. Calculating the standard scores (to) using the formula as follows:
to =
= 0.461
5. Conclusion
Because | t-observation | is 0.461 < t(5%), Ho is accepted and Ha is rejected. It means that there is no significant difference between the kinesthetic learners in pilot group and control group.
III. EXPERIMENTAL GROUP – CONTROL GROUP
1. Formulating the hypothesis of analyzing the data:
Ho : μA=μB, there is no significant difference between the kinesthetic learners in experimental group and control group.
Ha : μA>μB, there is a significant difference between the kinesthetic learners in experimental group and control group.
2. T-test where df= nA+nB – 2 = 4+4 -2 =6 t(5%) = 1.943
=
= 7.87
s.d. =
=1.101 Control Group
=
=
8.3s.d. = = 1.248
4. Calculating the standard scores (to) using the formula as follows:
to =
= 0.473
5. Conclusion
THE RESULT OF THE PRE-TEST
Table 6.1 The Result of the Pre-test of Visual Learners
Experimental Group Control Group Students’
ID Correct Answers (x)
x2
Students’
ID Correct Answers (x)
x2
1 18 324 1 8 64
2 23 529 4 13 169
4 21 441 5 19 361
7 7 49 6 22 484
11 10 100 10 8 64
12 11 121 13 10 100
13 18 324 14 26 676
14 19 361 15 20 400
15 14 196 17 21 441
17 20 400 18 15 225
∑x 161 2845 ∑x 162 2984
16.1 16.2
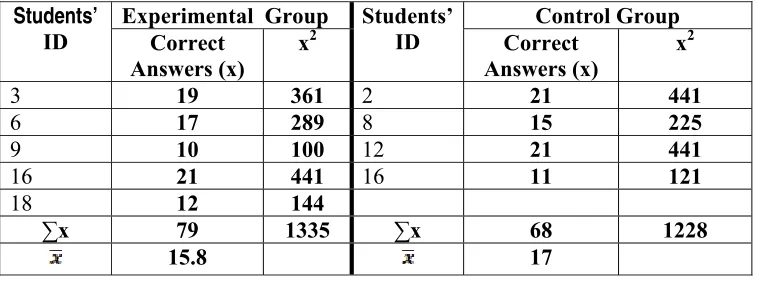
Table 6.2 The Result of the Pre-test of Auditory Learners
Experimental Group Control Group
Students’
ID Correct Answers (x)
x2
Students’
ID Correct Answers (x)
x2
3 19 361 2 21 441
6 17 289 8 15 225
9 10 100 12 21 441
16 21 441 16 11 121
18 12 144
∑x 79 1335 ∑x 68 1228
15.8 17
Table 6.3 The Result of the Pre-test of Kinesthetic Learners
Experimental Group Control Group Students’
ID Correct Answers (x)
x2
Students’
ID Correct Answers (x)
x2
5 19 361 3 16 256
8 12 144 7 14 196
10 10 100 9 24 576
11 19 361
∑x 41 ∑x 73 1389
13.67 18.25
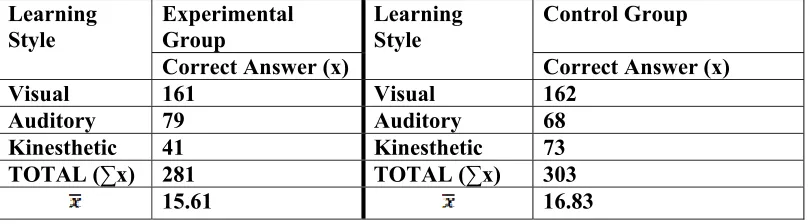
Table 6.4 The Result of the Pre-test of in general
Experimental Group
Control Group Learning
Style
Correct Answer (x)
Learning Style
Correct Answer (x)
Visual 161 Visual 162
Auditory 79 Auditory 68
Kinesthetic 41 Kinesthetic 73
TOTAL (∑x) 281 TOTAL (∑x) 303
TEST OF HYPOTHESIS OF PRE-TEST OF THE STUDENTS IN GENERAL
1. Formulating the hypothesis of analyzing the data:
Ho : μA=μB, there is no significant difference between the students’ pre-test score in experimental group and the control group in general.
Ha : μA>μB, there is a significant difference between the students’ pre-test score in experimental group and the control group in general.
2. T-test where df= nA+nB – 2 = 18+18 -2 =34 t(5%) = 1.684
3. Calculation for t-observation (to): Experimental Group
=
= 15.61
s.d. =
= 4.84
Control Group
=
=
16.83s.d. =
= 5.43
to =
= 0.72
5. Conclusion
TEST OF HYPOTHESIS OF PRE-TEST OF VISUAL LEARNERS
1. Formulating the hypothesis of analyzing the data:
Ho : μA=μB, there is no significant difference between the visual learners’ pre-test score in experimental group and the control group.
Ha : μA>μB, there is a significant difference between the visual learners’ pre-test score in experimental group and the control group.
T-test where df= nA+nB – 2 = 10+10 -2 =18 t(5%) = 1.734
2. Calculation for t-observation (to): Experimental Group
=
= 16.1
s.d. =
=5.3 Control Group
=
=
16.2s.d. =
= 6.32
3. Calculating the standard scores (to) using the formula as follows:
= 0.038 4. Conclusion
THE TEST OF HYPOTHESIS OF PRE-TEST OF AUDITORY LEARNERS
1. Formulating the hypothesis of analyzing the data:
Ho : μA=μB, there is no significant difference between the auditory learners’ pre-test score in experimental group and the control group.
Ha : μA>μB, there is a significant difference between the auditory learners’ pre-test score in experimental group and the control group.
2. T-test where df= nA+nB – 2 = 5+4 -2 =7 t(5%) = 1.895
3. Calculation for t-observation (to): Experimental Group
=
= 15.8
s.d. =
= 4.658 Control Group
=
=
17s.d. =
= 4.90
to =
= 0.375
5. Conclusion
THE TEST OF HYPOTHESIS OF PRE-TEST OF KINESTHETIC LEARNERS
1. Formulating the hypothesis of analyzing the data:
Ho : μA=μB, there is no significant difference between the kinesthetic learners’ pre-test score in experimental group and the control group.
Ha : μA>μB, there is a significant difference between the kinesthetic learners’ pre-test score in experimental group and the control group.
2. T-test where df= nA+nB – 2 = 3+4 -2 =5 t(5%) = 2.015
3. Calculation for t-observation (to): Experimental Group
=
= 13.67
s.d. =
= 4.726 Control Group
=
=
18.25s.d. = = 4.349
to =
= 1.331
5. Conclusion
THE RESULT OF THE POST TEST AND THE GAIN SCORE
Table 7.1 The Result of the Post-test of Visual Learners
Table 7.2 The Result of the Post-test of Auditory Learners
Experimental Group Control Group Students’
ID Pre-test Post -test Gain Score (x)
x2 Students’
ID
Pre-test Post -test Gain Score (x) x2
3 19 26 7 49 2 21 28 7 49
6 17 26 9 81 8 15 22 7 49
9 10 21 11 121 12 21 26 5 25
16 21 28 7 49 16 11 16 5 25
18 12 20 8 64
∑x 42 364 ∑x 24 14
8
8.4 6
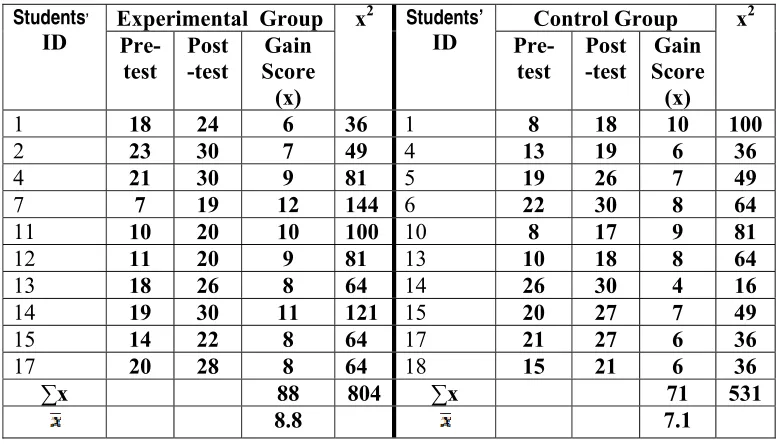
Experimental Group Control Group Students’
ID Pre-test Post -test Gain Score (x)
x2 Students’ ID
Pre-test Post -test Gain Score (x) x2
1 18 24 6 36 1 8 18 10 100
2 23 30 7 49 4 13 19 6 36
4 21 30 9 81 5 19 26 7 49
7 7 19 12 144 6 22 30 8 64
11 10 20 10 100 10 8 17 9 81
12 11 20 9 81 13 10 18 8 64
13 18 26 8 64 14 26 30 4 16
14 19 30 11 121 15 20 27 7 49
15 14 22 8 64 17 21 27 6 36
17 20 28 8 64 18 15 21 6 36
∑x 88 804 ∑x 71 531
8.8 7.1
Table 7.3 The Result of the Post-test of Kinesthetic Learners
Experimental Group Control Group Students’
ID Pre-test Post -test Gain Score (x)
x2 Students’
ID
Pre-test Post -test Gain Score (x) x2
5 19 27 8 64 3 16 22 6 36
8 12 22 10 100 7 14 23 9 81
10 10 17 7 49 9 24 30 6 36
11 19 26 7 49
∑x 25 213 ∑x 28 202
8.3 7
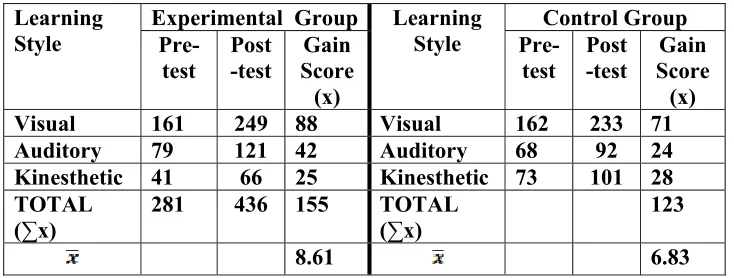
Table 7.4 The Result of the Post-test of the Students in general
Experimental Group Control Group Learning
Style Pre-test Post -test Gain Score (x) Learning Style Pre-test Post -test Gain Score (x) Visual 161 249 88 Visual 162 233 71 Auditory 79 121 42 Auditory 68 92 24 Kinesthetic 41 66 25 Kinesthetic 73 101 28 TOTAL
(∑x)
281 436 155 TOTAL (∑x)
123
TEST OF HYPOTHESIS OF THE POST TEST OF THE STUDENTS IN GENERAL
1. Formulating the hypothesis of analyzing the data:
Ho : μA=μB, there is no significant difference between the auditory learners who are taught vocabulary by using “Dora the Explorer” video series and the visual learners who are taught vocabulary by using pictures.
Ha : μA>μB, there is a significant difference between the auditory learners who are taught vocabulary by using “Dora the Explorer” video series and the visual learners who are taught vocabulary by using pictures.
2. T-test where df= nA+nB – 2 = 18+18 -2 = 34 t(5%) = 1.684
3. Calculation for t-observation (to): Experimental Group
=
= 8.61
s.d. =
= 1.649 Control Group
=
=
6.834. Calculating the standard scores (to) using the formula as follows:
to =
= 2.428
5. Conclusion
TEST OF HYPOTHESIS OF THE POST TEST OF VISUAL LEARNERS
1. Formulating the hypothesis of analyzing the data:
Ho : μA=μB, there is no significant difference between the visual learners who are taught vocabulary by using “Dora the Explorer” video series and the visual learners who are taught vocabulary by using pictures.
Ha : μA>μB, there is a significant difference between the visual learners who are taught vocabulary by using “Dora the Explorer” video series and the visual learners who are taught vocabulary by using pictures.
2. T-test where df= nA+nB – 2 = 10+10 =18 t(5%) = 1.734
3. Calculation for t-observation (to): Experimental Group
=
= 8.8
s.d. =
= 1.814
Control Group
=
=
7.1s.d. =
= 1.729
to =
= 2.145
5. Conclusion
Because | t-observation | is 2.145 > t(5%) , Ha is accepted and Ho is rejected. Therefore, there is a significant difference between the visual learners who are taught vocabulary by using “Dora the Explorer” video series and the visual learners who are taught vocabulary by using pictures.
1. Formulating the hypothesis of analyzing the data:
Ho : μA=μB, there is no significant difference between the auditory learners who are taught vocabulary by using “Dora the Explorer” video series and the visual learners who are taught vocabulary by using pictures.
Ha : μA>μB, there is a significant difference between the auditory learners who are taught vocabulary by using “Dora the Explorer” video series and the visual learners who are taught vocabulary by using pictures.
2. T-test where df= nA+nB – 2 = 5+4 -2 = 7 t(5%) = 1.895
3. Calculation for t-observation (to): Experimental Group
=
= 8.4
s.d. =
= 1.673
Control Group
=
=
6s.d. =
= 1.155
to =
= 2.428
5. Conclusion
Because | t-observation | is 2.428 > t(5%) , Ha is accepted and Ho is rejected. Therefore, there is a significant difference between the auditory learners who are taught vocabulary by using “Dora the Explorer” video series and the visual learners who are taught vocabulary by using pictures.
1. Formulating the hypothesis of analyzing the data:
Ho : μA=μB, there is no significant difference between the kinesthetic learners who are taught vocabulary by using “Dora the Explorer” video series and the visual learners who are taught vocabulary by using pictures.
Ha : μA>μB, there is a significant difference between the kinesthetic learners who are taught vocabulary by using “Dora the Explorer” video series and the visual learners who are taught vocabulary by using pictures.
2. T-test where df= nA+nB – 2 = 3+4 -2 = 5 t(5%) = 2.015
3. Calculation for t-observation (to): Experimental Group
=
= 8.3
s.d. =
= 1.528
Control Group
=
=
7s.d. =
= 1.41
to =
= 1.167
5. Conclusion
LESSON PLAN EXPERIMENTAL GROUP TREATMENT I
Subject : English
Skills : Listening, Speaking, Reading, Writing Language Components : Vocabulary, Pronunciation
Topic : Color
Education level : Elementary School Class/Semester : I/ 1
Time Allocation : 1x 30 minutes
A. BASIC COMPETENCE
Students are able to know the vocabulary of the colors.
B. ACHIEVEMENT INDICATORS
Listening : Students are able to understand the color uttered in the video.
Speaking : Students are able to answer the teacher’s question orally. Reading : Students are able to read the instruction.
Writing : Students are able to write the vocabularies in the correct spelling.
Pronunciation : Students are able to pronounce the vocabularies correctly. Vocabulary : Students are able to identify the color.
C. LEARNING MATERIAL
- video
- student’s worksheet
D. TECHNIQUE
- repetition drill - question and answer
E. CLASS ACTIVITY No. Procedures Skill / Sub
Skill Activities Time 1. Pre-Instructional Activities Listening , Speaking
The students are asked to answer the triggering questions orally. 1’ 2. Whilst Instructional Activities Listening, Vocabulary
3. Listening,
Speaking, Vocabulary
4. Pronunciation
The students are asked to watch “Dora the Explorer” video series twice.
(The students are asked to guess the meaning of the vocabulary in the video and discuss it with the teacher)
(The students are asked to repeat the pronunciation after the teacher.)
17’
5. Vocabulary,
Writing
The students are asked to spell and pronounce the vocabulary in the handout loudly.
2’
6. Vocabulary and
Pronunciation
The teacher asks the students to read aloud the handout given by the teacher and give the meaning in Indonesian.
2’
7. Reading,
writing, vocabulary.
The students are asked to do the worksheet.
8
Post-Instructional Activities
Speaking, pronunciation, vocabulary, listening.
Post Instructional Activities
The students are asked to pronounce, spell and give the meaning of the vocabulary given
TEACHER’S NOTE I. PRE-INSTRUCTIONAL ACTIVITIES
• The teacher asks the students to answer the triggering questions: a. Have you ever seen the rainbow?
b. What colors of the rainbow that you know?
II. WHILST-INSTRUCTIONAL ACTIVITIES
The teacher:
a. plays the video while pausing it when the vocabularies taught appear.
(The teacher asks the students to guess the meaning of the vocabulary in the video and discuss it with the teacher).
b. The students are asked to repeat the pronunciation after the teacher. c. The students are asked to spell and pronounce the vocabulary in
the handout loudly.
d. The teacher asks the students to read aloud the handout given by the teacher and give the meaning in Indonesian.
e. The students are asked to do the worksheet.
III. POST INSTRUCTIONAL ACTIVITIES
The teacher asks the students to pronounce and give the meaning of the vocabularies given.
TREATMENT II
Subject : English
Skills : Listening, Speaking, Reading, Writing Language Components : Vocabulary, Pronunciation
Topic : Shape
Education level : Elementary School Class/Semester : I/ 1
Time Allocation : 1x 30 minutes
A. BASIC COMPETENCE
Students are able to know the vocabulary of the shapes.
B. ACHIEVEMENT INDICATORS
Listening : Students are able to understand the shapes uttered in the video.
Speaking : Students are able to answer the teacher’s question orally. Reading : Students are able to read the instruction.
Writing : Students are able to write the vocabularies in the correct spelling.
Pronunciation : Students are able to pronounce the vocabularies correctly. Vocabulary : Students are able to identify the shape.
C. LEARNING MATERIAL
a. video
b. student’s worksheet
D. TECHNIQUE
a. repetition drill b. question and answer
No. Procedures Skill / Sub Skill Activities Time 1. Pre-Instructional Activities Listening , Speaking
The students are asked to answer the triggering questions orally. 1’ 2. Whilst Instructional Activities Listening, Vocabulary
3. Listening,
Speaking, Vocabulary
4. Pronunciation
The students are asked to watch “Dora the Explorer” video series twice.
(The students are asked to guess the meaning of the vocabulary in the video and discuss it with the teacher)
(The students are asked to repeat the pronunciation after the teacher.)
17’
5. Vocabulary,
Writing
The students are asked to spell and pronounce the vocabulary in the handout loudly.
2’
6. Vocabulary and
Pronunciation
The teacher asks the students to read aloud the handout given by the teacher and give the meaning in Indonesian.
2’
7. Reading,
writing, vocabulary.
The students are asked to do the worksheet. 5’ 8 Post-Instructional Speaking, pronunciation,
Post Instructional Activities
Activities vocabulary, listening.
pronounce, spell and give the meaning of the vocabulary given
• The teacher asks the students to answer the triggering questions:
o Do you know the meaning of the shape?
o Look at this shape! (the teacher draws the picture of circle). Can anyone mention things in the classroom that have the same shape like this?
o How about this? (the teacher draws the picture of rectangle).
Can you find things that have the same shape like it?
II. WHILST-INSTRUCTIONAL ACTIVITIES
The teacher:
a. plays the video while pausing it when the vocabularies taught appear.
(The teacher asks the students to guess the meaning of the vocabulary in the video and discuss it with the teacher).
b. The students are asked to repeat the pronunciation after the teacher. c. The students are asked to spell and pronounce the vocabulary in
the handout loudly.
d. The teacher asks the students to read aloud the handout given by the teacher and give the meaning in Indonesian.
e. The students are asked to do the worksheet.
III. POST INSTRUCTIONAL ACTIVITIES
The teacher asks the students to pronounce and give the meaning of the vocabularies given.
Subject : English
Skills : Listening, Speaking, Reading, Writing Language Components : Vocabulary, Pronunciation
Topic : Size
Education level : Elementary School Class/Semester : I/ 1
Time Allocation : 1x 30 minutes
A. BASIC COMPETENCE
Students are able to know the vocabulary of the size.
B. ACHIEVEMENT INDICATORS
Listening : Students are able to understand the size uttered in the video.
Speaking : Students are able to answer the teacher’s question orally. Reading : Students are able to read the instruction.
Writing : Students are able to write the vocabularies in the correct spelling.
Pronunciation : Students are able to pronounce the vocabularies correctly. Vocabulary : Students are able to identify the size.
C. LEARNING MATERIAL
a. video
b. student’s worksheet
D. TECHNIQUE
a. repetition drill b. question and answer
E. CLASS ACTIVITY
Skill 1. Pre-Instructional Activities Listening , Speaking
The students are asked to answer the triggering questions orally. 1’ 2. Whilst Instructional Activities Listening, Vocabulary
3. Listening,
Speaking, Vocabulary
4. Pronunciation
The students are asked to watch “Dora the Explorer” video series twice.
(The students are asked to guess the meaning of the vocabulary in the video and discuss it with the teacher)
(The students are asked to repeat the pronunciation after the teacher.)
17’
5. Vocabulary,
Writing
The students are asked to spell and pronounce the vocabulary in the handout loudly.
2’
6. Vocabulary and
Pronunciation
The teacher asks the students to read aloud the handout given by the teacher and give the meaning in Indonesian.
2’
7. Reading,
writing, vocabulary.
The students are asked to do the worksheet. 5’ 8 Post-Instructional Speaking, pronunciation, vocabulary,
Post Instructional Activities
The students are asked to pronounce, spell and give the
Activities listening. meaning of the vocabulary given
• The teacher asks the students to answer the triggering questions:
o Do you know the meaning of the size? o Can anyone mention the size of an elephant?
o Can anyone mention the size of an ant?
II. WHILST-INSTRUCTIONAL ACTIVITIES
The teacher:
a. plays the video while pausing it when the vocabularies taught appear.
(The teacher asks the students to guess the meaning of the vocabulary in the video and discuss it with the teacher).
b. The students are asked to repeat the pronunciation after the teacher. c. The students are asked to spell and pronounce the vocabulary in
the handout loudly.
d. The teacher asks the students to read aloud the handout given by the teacher and give the meaning in Indonesian.
e. The students are asked to do the worksheet.
III. POST INSTRUCTIONAL ACTIVITIES
LESSON PLAN CONTROL GROUP TREATMENT I
Subject : English
Skills : Listening, Speaking, Reading, Writing Language Components : Vocabulary, Pronunciation
Topic : Color
Education level : Elementary School Class/Semester : I/ 1
Time Allocation : 1x 30 minutes
F. BASIC COMPETENCE
Students are able to know the vocabulary of the colors.
G. ACHIEVEMENT INDICATORS
Listening : Students are able to get the teacher’s explanation.
Speaking : Students are able to answer the teacher’s question orally. Reading : Students are able to read the instruction.
Writing : Students are able to write the vocabularies in the correct spelling.
Pronunciation : Students are able to pronounce the vocabularies correctly. Vocabulary : Students are able to identify the color.
H. LEARNING MATERIAL
- Picture
- student’s worksheet
I. TECHNIQUE
- repetition drill - question and answer
J. CLASS ACTIVITY No. Procedures Skill / Sub
Skill Activities Time 1. Pre-Instructional Activities Listening , Speaking
Pre Instructional Activities
The students are asked to answer the triggering questions orally. 1’ 2. Whilst Instructional Activities Listening, Vocabulary
3. Listening,
Speaking, Vocabulary
4. Pronunciation
Whilst Instructional Activities
The students are asked to listen to the teacher’s explanation about the lesson. The teacher uses picture.
The students are asked to read the hand-out silently.
The students are asked to repeat the pronunciation after the teacher.
17’
5. Vocabulary,
Writing
The students are asked to spell and pronounce the vocabulary in the handout loudly.
2’
6. Vocabulary and
Pronunciation
The teacher asks the students to read aloud the handout given by the teacher and give the meaning in Indonesian.
2’
7. Reading,
writing,
The students are asked to do the worksheet.
vocabulary. 8
Post-Instructional Activities
Speaking, pronunciation, vocabulary, listening.
The students are asked to pronounce, spell and give the meaning of the vocabulary given
TEACHER’S NOTE IV.PRE-INSTRUCTIONAL ACTIVITIES
• The teacher asks the students to answer the triggering questions: c. Do you like baloons?
d. What colors of baloons that you like?
V. WHILST-INSTRUCTIONAL ACTIVITIES
The teacher:
a. The students are asked to listen to the teacher’s explanation about the lesson. The teacher uses picture.
b. The students are asked to read the hand out silently.
e. The students are asked to repeat the pronunciation after the teacher. f. The students are asked to spell and pronounce the vocabulary in
the handout loudly.
g. The teacher asks the students to read aloud the handout given by the teacher and give the meaning in Indonesian.
h. The students are asked to do the worksheet.
VI. POST INSTRUCTIONAL ACTIVITIES
LEARNING MATERIAL
red
green
yellow
purple
black
grey
LESSON PLAN CONTROL GROUP TREATMENT II
Subject : English
Skills : Listening, Speaking, Reading, Writing Language Components : Vocabulary, Pronunciation
Topic : Shape
Education level : Elementary School Class/Semester : I/ 1
Time Allocation : 1x 30 minutes
K. BASIC COMPETENCE
Students are able to know the vocabulary of the colors.
L. ACHIEVEMENT INDICATORS
Listening : Students are able to get the teacher’s explanation.
Speaking : Students are able to answer the teacher’s question orally. Reading : Students are able to read the instruction.
Writing : Students are able to write the vocabularies in the correct spelling.
Pronunciation : Students are able to pronounce the vocabularies correctly. Vocabulary : Students are able to identify the shape.
M.LEARNING MATERIAL
- Picture
- student’s worksheet
N. TECHNIQUE
O. CLASS ACTIVITY No. Procedures Skill / Sub
Skill Activities Time 1. Pre-Instructional Activities Listening , Speaking
Pre Instructional Activities
The students are asked to answer the triggering questions orally. 1’ 2. Whilst Instructional Activities Listening, Vocabulary
3. Listening,
Speaking, Vocabulary
4. Pronunciation
Whilst Instructional Activities
The students are asked to listen to the teacher’s explanation about the lesson. The teacher uses picture.
The students are asked to read the hand-out silently.
The students are asked to repeat the pronunciation after the teacher.
17’
5. Vocabulary,
Writing
The students are asked to spell and pronounce the vocabulary in the handout loudly.
2’
6. Vocabulary and
Pronunciation
The teacher asks the students to read aloud the handout given by the teacher and give the meaning in Indonesian.
2’
7. Reading,
writing,
The students are asked to do the worksheet.
vocabulary. 8
Post-Instructional Activities
Speaking, pronunciation, vocabulary, listening.
The students are asked to pronounce, spell and give the meaning of the vocabulary given
TEACHER’S NOTE I. PRE-INSTRUCTIONAL ACTIVITIES
• The teacher asks the students to answer the triggering questions:
o Do you know the meaning of the shape?
o Look at this shape! (the teacher draws the picture of circle).
Can anyone mention things in the classroom that have the same shape like this?
o How about this? (the teacher draws the picture of rectangle). Can you find things that have the same shape like it?
II.WHILST-INSTRUCTIONAL ACTIVITIES
The teacher:
a. The students are asked to listen to the teacher’s explanation about the lesson. The teacher uses picture.
b. The students are asked to read the hand out silently.
c. The students are asked to repeat the pronunciation after the teacher. d. The students are asked to spell and pronounce the vocabulary in
the handout loudly.
e. The teacher asks the students to read aloud the handout given by the teacher and give the meaning in Indonesian.
f. The students are asked to do the worksheet.
VII. POST INSTRUCTIONAL ACTIVITIES
LEARNING MATERIAL
LESSON PLAN CONTROL GROUP
rectangle
square
star
circle
oval
TREATMENT III
Subject : English
Skills : Listening, Speaking, Reading, Writing Language Components : Vocabulary, Pronunciation
Topic : Size
Education level : Elementary School Class/Semester : I/ 1
Time Allocation : 1x 30 minutes
A. BASIC COMPETENCE
Students are able to know the vocabulary of the size.
B. ACHIEVEMENT INDICATORS
Listening : Students are able to get the teacher’s explanation.
Speaking : Students are able to answer the teacher’s question orally. Reading : Students are able to read the instruction.
Writing : Students are able to write the vocabularies in the correct spelling.
Pronunciation : Students are able to pronounce the vocabularies correctly. Vocabulary : Students are able to identify the size.
C. LEARNING MATERIAL
a. Picture
b. student’s worksheet
D. TECHNIQUE
E. CLASS ACTIVITY No. Procedures Skill / Sub
Skill Activities Time 1. Pre-Instructional Activities Listening , Speaking
Pre Instructional Activities
The students are asked to answer the triggering questions orally. 1’ 2. Whilst Instructional Activities Listening, Vocabulary
3. Listening,
Speaking, Vocabulary
4. Pronunciation
Whilst Instructional Activities
The students are asked to listen to the teacher’s explanation about the lesson. The teacher uses picture.
The students are asked to read the hand-out silently.
The students are asked to repeat the pronunciation after the teacher.
17’
5. Vocabulary,
Writing
The students are asked to spell and pronounce the vocabulary in the handout loudly.
2’
6. Vocabulary and
Pronunciation
The teacher asks the students to read aloud the handout given by the teacher and give the meaning in Indonesian.
2’
7. Reading,
writing,
The students are asked to do the worksheet.
vocabulary. 8
Post-Instructional Activities
Speaking, pronunciation, vocabulary, listening.
The students are asked to pronounce, spell and give the meaning of the vocabulary given
3’
I. PRE-INSTRUCTIONAL ACTIVITIES
• The teacher asks the students to answer the triggering questions:
o Do you know the meaning of the size? o Can anyone mention the size of an elephant? o Can anyone mention the size of an ant?
II.WHILST-INSTRUCTIONAL ACTIVITIES
The teacher:
a. The students are asked to listen to the teacher’s explanation about the lesson. The teacher uses picture.
b. The students are asked to read the hand out silently.
c. The students are asked to repeat the pronunciation after the teacher. d. The students are asked to spell and pronounce the vocabulary in
the handout loudly.
e. The teacher asks the students to read aloud the handout given by the teacher and give the meaning in Indonesian.
f. The students are asked to do the worksheet.
III. POST INSTRUCTIONAL ACTIVITIES
fat t
short small big
WORKSHEET
What are the colors of the clown’s balls?
b
c
d
e
f
g
h
i
j
a
a. ………..
b. ………..
c. ………..
d. ………..
e. ………..
f. ………..
g. ………..
h. ………..
i. ………..
j. ………..
black yellow
purple green red
brown orange grey
blue pink
WORKSHEET
What shape are these?
1.
2.
3.
4.
5.
6.
__ __ __ __ __ __ __ __
__
__ __ __ __ __
__ __ __ __
__ __ __ __ __ __
__ __ __ __ __ __ __
__
__ __ __ __
Unscramble the letters!
1.
f-t-a
= ………
2.
b-g-i
= ………
3
.
t-n-i-h
= ………
4
. s-o-h-t-r
= ………
5.
t-l-a-l
= ………
6.
a.
big
b. small
c. tall
d. short e. thin f. fat
WORKSHEET