DETERMINING HYDROCARBON PROSPECTIVE ZONE USING THE
COMBINATION OF QUALITATIVE ANALYSIS AND
FUZZY LOGIC METHOD
Hidayah Nurul Hasanah Zen1 Laila Wahyu Trimartanti1 Zaenal Abidin2
Agus Maman Abadi1
1
Department of Mathematics, Yogyakarta State University, Indonesia [email protected] (), [email protected], [email protected]
2
STTN-BATAN, Yogyakarta, Indonesia [email protected]
Abstract
Hydrocarbon prospective zone is a certain layer in a reservoir which is estimated producing oil. The geologists use the qualitative analysis method to find the prospect layers. The research used five variables modeled by three fuzzy membership functions and eight rules of fuzzy logic. The rules cause insensitiveness in the working system. This study therefore was conducted by modeling each of input variables into different models using 36 rules. It aims to determine the existence of hydrocarbon prospective zone through a qualitative analysis in a reservoir using fuzzy inference system with Mamdani method. The data were taken from well log data in reservoir “X”. There were some steps in doing this study, including fuzzification, inference system, and defuzzification. The result showed 99 prospect layers from 3000 layers in reservoir “X” with 97.7% of accuracy.
Keywords: Well log, fuzzy logic, prospective zone, hydrocarbon, qualitative analysis
1. Introduction
Hydrocarbon is a source of mineralogy that cannot be recycled and immediately grows in the way of exploration. Hydrocarbon prospective zone is a zone or a layer in a reservoir that is estimated to contain hydrocarbon becoming the source of oil and gasoline. Determining hydrocarbon prospective zone in a layer in a reservoir is deemed necessary prior to conduct the production’s step. Muchlison and Melfi (2013) argued that nowadays log data is needed in oil world for
determining prospective zone in a formation. Then, log data is evaluated and interpreted for finding the accumulation of hydrocarbon or the net pay of a formation.
In the past decade, a series of papers about prospective zone have been published in some journals. Zhou and Wicaksono (2005) had analyzed the sources of the problems and explored the ways of identifying and minimizing the anomalies unrelated to the formation. The method is log normalizing to determine shale lithology accurately. There are three main
classes of anomalies in some of the logs. The resulting data that have been evaluated by May and Jacobsen (2006) can be used with the same evidence as obtained in reservoirs cemented with the more traditional cement recipes. Akhter (2012) conducted a study by transforming surface resistivity sounding data into seismic curves. Islam and Habib (2013) could prove that these hydrocarbon-bearing zones are potential for gas production and good reservoir bearing formation. Acoustic Impedance Inversion method (Kartika and Mulyanto 2013, Kurniawan and Mulyanto 2013, Simanjuntak and Mulyanto 2014) is a suitable method used to indicate the reservoir target but it is incapable of analyzing the contents of reservoir. The method used by Budiman (2013) in determining the form of faces geometry and the way of precipitation along with how to make contour map and net sand map could analyze the data well. Purnamasari and Khairy (2014) had studied about determining lithology. Interpretation and
calibration which had been done by
Omoboriowo and Chiadikobi (2012) were nearly accurately conceptualized; thus being necessary to make guide further oil exploration in the Amma field and other related oil fields nearby. The study by Ghazi and Ahmad (2012) was focused on the response of log signatures against the sediments within the Warchha Sandstone. Amigun and Olisa (2012) declared that further calibration of the log analysis parameters with core and production data is necessary to verify the calculated values, as the permeability since some of the reservoir sand units are extremely high. Inversion method used by Pratama and Suharno (2013) in Geoframe 4.4 software provide an almost similar result with well
production data. The study of CBR applied in the oil well drilling domain had been done by Shokouhi and Aamodt (2010) indicating that the integration of different reasoning methods has improved the reasoning and the retrieval process substantially. Multistage fuzzy evaluation with the combination of quantitative and qualitative analysis as well as the degree of success method are used for the post-evaluation of oilfield ground engineering project, which may lead to the reference of the decision-making of investment and management for oilfield ground engineering project (Yanling and Lin 2012). Petrophysics analysis (Omoboriowo and Chiadikobi 2012, Ghazi and Ahmad 2012, Amigun and Olisa 2012, Pratama and Suharno
2013, Omolaiye and Sanuade 2013),
hydrocarbon determining (Pratama and Suharno 2013, Shokouhi and Aamodt 2010, Yanling and Lin 2012, Omosanya and Akinmosin 2011, Erviantari and Sarkowi 2014), and permeability production (Onuh and Arinkoola 2015) are closely related in determining the hydrocarbon prospective zone.
A study by Akinyokun and Enikanselu (2009) obtained data from the Niger Delta region of Nigeria. They input five variables modeled by three fuzzy membership functions, which corresponded to the linguistic values High (H), Moderate (M), or Low (L). Therefore, this study was conducted by modeling each of input variables into a number of different models corresponding to respond log concern lithology to determining hydrocarbon prospective zone based on qualitative analysis in fuzzy inference system.
importance of hydrocarbon prospective zone, studies related to this paper have been done in the past decade, and making of each section in this paper. The theories explain the definition of Fuzzy Inference System (FIS), Mamdani method, qualitative analysis, and definition and working system of each log. The method showed that the data was taken from the variables and flow chart to evaluate the data. The results and discussion explain the processing data and obtain the output either prospective zone or non-prospective zone. The last part of the paper showed the conclusion with a brief summary.
2. Qualitative Analysis and
Combination of Log
Qualitative analysis is an analysis to detect a permeable layer, determine the thickness of the prospective layer, and find out fluid contents. Determining the permeable layer is applied for deflection curve from logging combination such as Gamma Ray log (GR), Resistivity log, Neutron log, and Density log.
Determining the permeable layer based on qualitative analysis is very important in finding out a layer prospectively. From determining permeable layer qualitatively it is possible to continue quantitative analysis using Indonesia equation method to obtain the parameter of porosity and saturation. Porosity and saturation are important core parameters in the rock physic of reservoir (Kristanto and Aji 2012).
Each logging tool has a different measurement formation characteristic in measuring the characteristic of rock and fluid for interpreting. However, it needs to be considered that there are not logging tool that can measure porosity, saturation, permeability, or kind of
fluid directly. In fact, it can be done by using logging tool in common or by making combination of the log (Kristanto and Aji 2012). There are four logs in combination.
2.1 Gamma Ray Log
It is a curve that shows the radioactive intensity bulk in a formation. Radioactive-ray is caused by radioactive elements disintegration, such uranium (U238), thorium (Th232), and
potassium (K40). The functions of gamma ray log
are different shale and non-shale layer in open hole and closed hole reservoir, do duty off Spontaneous Potential (SP) log for permeable layer detection because it is in not too recessive formation (Rw/Rmf) output of SP log inaccurate, for correlation reservoir, find out percentage of shale content in permeable layer, and detect minerals radioactive. Measurement principle was done by putting detector tool into a borehole. Formation that contents radioactive elements will spring radioactive radiation where its intensity is caught by the detector and recorded on surface. In general, mineral in core formation has weak natural radioactive except mineral potassium with many shale contents.
2.2 Resistivity Log
2.3 Neutron Log
Neutron is a neutral particle that has similar mass with hydrogen atomic mass. The functions of neutron log are to determining the total of porosity (Ø), gas detector after combined with porosity tool, and correlation. Working system of neutron log is when a neutron is emitted to a formation and then collides with an atom from material formation, so the neutron may lose some of its energy. The biggest loss of energy occurs if the neutron collides with hydrogen atom. Because a formation of hydrogen is in pores containing fluid, the loss of energy is related to porosity formation.
2.4 Density Log
It is a curve that shows the bulk of core density penetrated by borehole. The functions of density log are to measure core porosity (Ø), to evaluate shaly sand and to compact lithology, and to identify mineral core. The working system of density log is the source and the detector set on a pad and patched on borehole wall. Then, the strong gamma ray springs into the formation. Gamma ray will collide with electron, and bounce back and record on the log. The bulk of lost energy in consequence of crash with the electron in formation showed electron density in core.
The process of qualitative analysis is still conducted manually and subjectively.
3. Construction of Fuzzy Inference
System Using Mamdani Method
Munir (2011) stated that inference
conclusion on Fuzzy Inference System (FIS) is a conclusion drawn from a collection of fuzzy norms. FIS must contain two fuzzy norms of the
input and output values. Logic is the study of methods and principles of reasoning where reasoning means to obtain several new propositions from the existing propositions. In classical logic, the propositions are required to be either true or false, that is, the truth value of a proposition is either 0 or 1. Fuzzy logic generalizes two classical logic values by allowing the truth values of a proposition to be any number in the interval [0,1].
A fuzzy rule base consists of a set of fuzzy IF-THEN rules. All of other components are used to implement these rules reasonably and efficiently. Specifically, the fuzzy rule base comprises the following fuzzy IF-THEN rules:
( )
andy∈Vare the input and output (linguistic) variables of the fuzzy system, respectively. Let
M be the number of rules in the fuzzy rule base; that is,l=1, 2,,M (Wang 1997).
Each fuzzy set, A , is defined in terms of a relevant universal set, X , by a function analogous to the characteristic function. This function, called as a membership function, is assigned to each elementxofXa number, ( )A x , in the closed unit interval [0,1] that characterizes the degree of membership of 𝑥 in A . Membership functions are thus functions of the form
: [0,1].
A X → (2)
called a fuzzy number, is often represented by an analytic form, describing the shape of this fuzzy number.
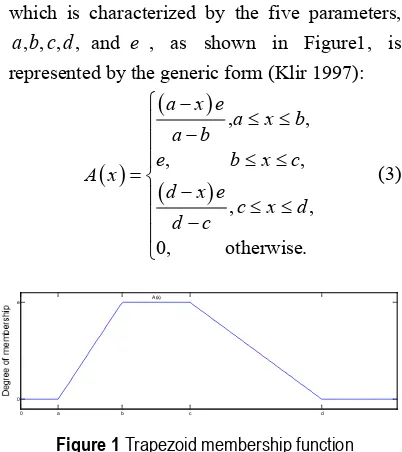
In fact, trapezoid membership function which is characterized by the five parameters,
, , , ,
a b c d and e , as shown in Figure1, is represented by the generic form (Klir 1997):
( )
Figure 1 Trapezoid membership function
The input and output in Mamdani method are fuzzy set (Kusumadewi 2002). Mamdani method uses a minimum operator in implication function and maximum operator in aggregation function. Thus, it is called MIN-MAX method (min-max inferencing). The output from n-rules of Mamdanimethod is defined as
( )
( )
( )
A are antecedent pairs tokof fuzzy set, and Bk is a consequent tokof fuzzy set (Kusumadewi and Purnomo 2013).
There are five steps in FIS that are operated using Mamdani method (Naba 2009).
3.1 Fuzzification
It is a process of mapping crisp value into a fuzzy set and determining the degree of its
elements into all of fuzzy set using each fuzzy set of membership function.
3.2 Fuzzy Logic Operation
It needs to be done if the antecedent is more than one preposition. The final result of this operation is a truth degree of the antecedent that is a single value of membership function in a fuzzy set. This numeral will be continued to consequent. The inputs are two or more membership functions of input variables meanwhile its output is single truth value. The fuzzy logic operations are AND, OR, and NOT.
3.3 Implication
Implication is a process to obtain IF-THEN rules in consequent that is based on the truth degree of antecedent to operate implication process, every rule must be given weight. The interval of weight value starts from 0 until 1. Generally, the weight sets one; thus, it has no effect in this process. The input is the truth degree of antecedent and fuzzy set in the consequent.
3.4 Aggregation
It is a process that combines all IF-THEN rules in outputs be a single fuzzy set. If the consequent is more than one preposition, then the aggregation is operated for every IF-THEN rule in output variable separately.
3.5 Defuzzification
Defuzzification is the opposite of
fuzzification that is a process of altering fuzzy value from the result of inference system into crisp value in output membership function. The input is an area (the result of aggregation) in a
fuzzy set; meanwhile, its output is a crisp value. Defuzzification in Mamdani method is operated by taking the center of area in the result of aggregation.
For continue variable:
( )
* . .
( )
c
c z z dz Z
z m
m ∫ =
∫ (5)
For discrete variable:
( )
( )
. 1 *
1
.
n
j c j j
n c j j
z z
Z
z
m m =
=
=
∑
∑
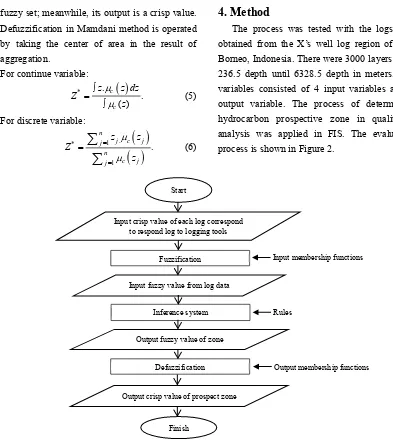
(6)4. Method
The process was tested with the logs data obtained from the X’s well log region of East Borneo, Indonesia. There were 3000 layers from 236.5 depth until 6328.5 depth in meters. The variables consisted of 4 input variables and 1 output variable. The process of determining hydrocarbon prospective zone in qualitative analysis was applied in FIS. The evaluation process is shown in Figure 2.
Figure 2 Flow chart of data evaluation
5. Results and Discussion
This study is a case of fuzzy application that is combined with qualitative analysis to determine hydrocarbon prospective zone. The data from a reservoir named “X” was evaluated
in fuzzy inference system using Mamdani method. There were four input variables such as gamma ray log, resistivity log, neutron log, and density log. The output variable indicated the prospective or not prospective of layer. Crisp log
Input fuzzy value from log data
Input membership functions
Rules
Output membership functions
Output crisp value of prospect zone Defuzzification
Start
Fuzzification
Input crisp value of each log correspond to respond log to logging tools
Inference system
Output fuzzy value of zone
value was modeled into fuzzy value by fuzzification in each log. Gamma ray log could differentiate lithology in kinds of rock, so it was modeled by three fuzzy membership functions. The three fuzzy membership functions corresponded to respond log concern lithology; those are Sand, Shaly Sand (SS), or Shale. Resistivity log was modeled by two fuzzy membership functions; those are Hydrocarbon (HC) or Water. Neutron log was modeled by three fuzzy membership functions; those are Low (L), Moderate (M), or High (H). Whereas, the density log was modeled by two fuzzy membership functions, those are Low (L) or High (H).
Presence positive separation (ΦD > ΦN) as the
width between density log and neutron log shows gas content. Detecting membership intervals was applied through exploiting expert knowledge to calculate the intervals of every membership (Akinyokun and Enikanselu 2009).
Figure 3 Gamma ray log membership function
Figure 3 shows the membership function of gamma ray log as the input variable. Fuzzy membership functions for Sand value in the interval of [0, 60], Shaly Sand in [61, 80], and Shale in [81, 160]. Figure 4 shows the membership function of resistivity log as an input
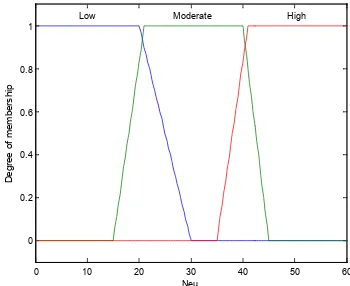
variable. Fuzzy membership functions for Water value in the interval of [0, 10] whereas Hydrocarbon in [11, 35]. Figure 5 shows the membership function of neutron log as the input variable. Fuzzy membership functions for Low value in the interval of [0, 20], Moderate in [21, 40], and High in [41, 60]. Figure 6 shows the membership function of density log as the input variable. Fuzzy membership functions for Low value in the interval of [0, 2.09] whereas High in [2.1, 3]. The type of all fuzzy membership functions in input variable use trapezoid in that way input four values for each term..
Figure 4 Resistivity log membership function
Figure 5 Neutron log membership functionthe
0 20 40 60 80 100 120 140 160
Sand Shaly.Sand Shale
Figure 6 Density log membership function Figure 7 Output membership function
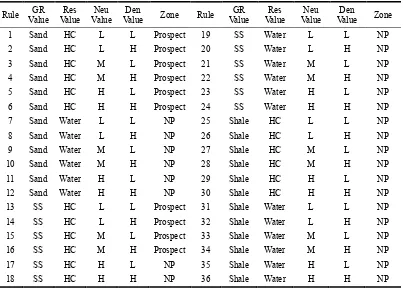
Table 1 Fuzzy rules matrix
Rule GR
On the output variable, it is defined two membership functions in [0, 1] representing the prospect and non-prospect (NP). Figure 7 shows
the membership function of output variable. Fuzzy membership function for Prospect value is 0 and Non-prospect value is 1. The fuzzy
0 0.1 0.2 0.3 0.4 0.5 0.6 0.7 0.8 0.9 1
Prospect Non.Prospect
membership functions are trapezoid.
Afterwards, fuzzy logic rule bases on qualitative analysis were interpreted by geologist. Well log data were evaluated with fuzzy logic rules, and then the inference system is applied. Table 1 shows 36 rules in fuzzy logic bases on qualitative analysis that have been interpreted by geologist. There were a number of different dependent rules (Akinyokun and Enikanselu 2009). Each of which is a collection of variants that have been “AND” together and shows an especial situation zone. Table 1 displays some of the related rules within IF-THEN as a fundamental rule. Fuzzy rules process depends on building strong relations between memberships, according to experts review, and
complex relations. The relations as an example are built as follows:
IF (GR=Sand) & (Res=HC) & (Neu=L) & (Den=L) THEN (Zone=Prospect).
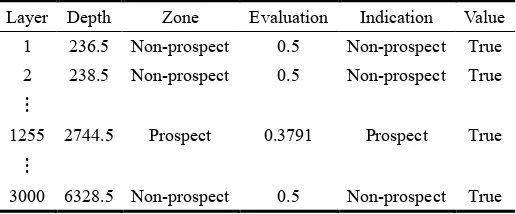
The last step was defuzzification. In this study, it was used centroid defuzzification. The crisp solution was obtained by calculating the center of gravity from aggregation area. Table 2 shows the resulted analysis of testing data.
As shown in Table 2, the results from this study obtained 71 prospect zones and 2929 non-prospect zones from 3000 layers input data in reservoir “X”. The accuracy of this method was 97.7%.
Table 2 Prospect zone analysis for testing data
Layer Depth Zone Evaluation Indication Value
1 236.5 Non-prospect 0.5 Non-prospect True
2 238.5 Non-prospect 0.5 Non-prospect True
⋮
1255 2744.5 Prospect 0.3791 Prospect True
⋮
3000 6328.5 Non-prospect 0.5 Non-prospect True
6. Conclusion
This study was concerned with applying fuzzy inference system in the qualitative analysis. This study was applied to 3000 layers from reservoir “X”. Fuzzy inference system evaluated well log data using Mamdani method based on qualitative analysis. The defuzzification process in Mamdani method used centroid defuzzification. The fuzzy model provided the high accuracy of 97.7%.
There are two kinds of zone in the reservoir
References
[1] Akhter, G.A.F. (2012). Determining the depositional pattern by resistivity-seismic inversion for the aquifer system of maria area, Pakistan. Environ Monit Assess, 184: 161-170.
[2] Akinyokun, O.C. & Enikanselu, P.A. (2009). Well log interpretation model for the determination of lithology and fluid contents. Spring-Pacific Journal of Science and Technology, 10 (1): 507-517.
[3] Amigun, J. O. & Olisa, B. (2012). Petrophysical analysis of well logs for reservoir evaluation: a case study of ‘Laja’ oil field, Niger Delta. Journal of Petroleum and Gas Exploration Research, 2 (10): 181-187.
[4] Budiman. (2013). Geometri facies sand layer ‘BI-24’ berdasarkan analisa well log pada lapangan ‘X’ PT. Pertamina EP. Geosains, 9 (2): 99-105.
[5] Erviantari, D. & Sarkowi, M. (2014). Studi identifikasi struktur bawah permukaan dan keberadaan hidrokarbon berdasarkan data anomali gaya berat pada daerah cekungan
Kalimantan Tengah. Jurnal Geofisika
Eksplorasi, 2 (1): 13-20.
[6] Ghallab, S.A. & Badr, N. (2013). A fuzzy expert system for petroleum prediction. WSEAS, 2: 77-82.
[7] Ghazi, S. & Ahmad, S.R. (2012). Well log study and petrophysical properties of the Early Permian Warchha sandstone, Potwar Basin, Pakistan. Pakistan Journal of Science, 64 (3): 173-179.
[8] Islam, A.R.M.T. & Habib, M.A. (2013). Interpretation of wireline log data for reservoir characterization of the Rashipdur
gas field, Bengal Basin, Bangladesh. IOSR Journal of Applied Geology and Geophysics, 1 (4): 47-54.
[9] Kartika, F. & Mulyanto, B.S. (2013). Karakterisasi reservoar ‘Febri-Unila field’ menggunakan metode acoustic impedance (AI) inversion. Jurnal Geofisika Eksplorasi, 1 (1): 48-56.
[10]Klir, G.J., Clair, U.St. & Yuan, B. (1997).
Fuzzy Set Theory: Foundations and
Applications. Prentice-Hall, Inc., United State of America.
[11]Kristanto, D. & Aji, V.D.C. (eds.) (2012). Buku Panduan Praktikum Penilaian Formasi. Laboratorium Penilaian Formasi, Yogyakarta.
[12]Kurniawan, A. & Mulyanto, B.S. (2013). Karakterisasi reservoar formasi Belumai dengan menggunakan metode inversi impendansi akustik dan neural network pada lapangan ‘YPS’. Jurnal Geofisika Eksplorasi, 1 (1): 15-24.
[13]Kusumadewi, S. (2002). Analisis dan Desain Sistem Fuzzy Menggunakan Toolbox Matlab. Graha Ilmu, Yogyakarta.
[14]Kusumadewi, S. & Purnomo, H. (2013). Aplikasi Logika Fuzzy Untuk Pendukung Keputusan. Graha Ilmu, Yogyakarta.
[15]May, D.H. & Jacobsen, S. (2006). Identifying and correcting for high-resistivity cement effects for cased-hole resistivity-log analysis. SPE, 100340: 1-11. [16]Muchlison, M. & Melfi. (2013).
Prospektivitas Suatu Lapisan Formasi
dengan Menggunakan Kombinasi Log dan Tes Sumur pada Sumur “X” Lapangan “Y”. UPN "Veteran", Yogyakarta.
Informatika STEI ITB, Bandung.
[18]Naba, A. (2009). Belajar Cepat Fuzzy Logic Menggunkan Matlab. ANDI, Yogyakarta. [19]Omoboriowo, A.O. & Chiadikobi, K.C.
(2012). Depositional environment and petrophysical characteristics of ‘LEPA’ reservoir, Amma field, Eastern Niger Delta, Nigeria. International Journal of Pure and Applied Sciences and Technology, 10 (2): 38-61.
[20]Omolaiye, G.E. & Sanuade, O.A. (2013). Petrophysics of the B-reservoir in Eyram field, Onshore Niger Delta. British Journal of Applied Science & Technology, 3 (4): 1481-1504.
[21]Omosanya, K.O. & Akinmosin, A.A. (2011). The hydrocarbon potential of the Nigerian Chad basin from wireline logs. Indian Journal of Science and Technology, 4 (12): 1668-1675.
[22]Onuh, H.M. & Arinkoola, O.A. (2015). Genetic unit averages of pseudo-normalized pore throat radius for improved permeability predictions (Niger Delta as case study). Springer-J Petrol Explor Prod Technol, 5: 147-155.
[23]Pratama, A. & Suharno. (2013). Analisis petrofisika untuk menentukan potensi hidrokarbon pada sumur ELP-23 lapangan Prabumulih menggunakan metode inversi. Jurnal Geofisika Eksplorasi, 1 (1): 2-14. [24]Purnamasari, I.A. & Khairy, H. (2014). Rock
physics modeling and fluid substitution studies in sandstone reservoir. Journal of Applied Sciences, 14 (11): 1180-1185. [25]Shokouhi, S.V. & Aamodt, A. (2010).
Applications of CBR in oil well drilling: a general overview. IFIP AICT 340, IIP:
102-111.
[26]Simanjuntak, A.S. & Mulyanto, B.S. (2014). Karakterisasi reservoar hidrokarbon pada lapangan ‘TAB’ dengan menggunakan pemodelan inversi impedansi akustik. Jurnal Geofisika Eksplorasi, 2 (1): 2-13.
[27]Wang, L. (1997). A Course in Fuzzy Systems and Control. Prentice-Hall, Inc., United State of America.
[28]Yanling, X. & Lin, L. (2012). Research on post-evaluation of oilfield ground engineering project. Management Science and Engineering, 6 (3): 30-33.
[29]Zhou, Q. & Wicaksono, A. (2005). Proper interpretation of cased-hole resistivity logs. Petrophysics, 46 (2): 96-103.
Hidayah Nurul Hasanah Zen is a student in Department of Mathematics at Yogyakarta State University, Indonesia. Her research tends to the area of applied mathematics especially in fuzzy systems and statistics.
Laila Wahyu Trimartanti is a student in Department of Mathematics at Yogyakarta State University, Indonesia. Her study area is application case of mathematics using fuzzy logic. Her current research is about Dirichlet equation.
Evaluation of on Line Data Acquisition to Obtain Kartini Reactor Daily Operation Data, Operation of X-ray Mobile Unit in Regional State Hospital in Yogyakarta, The Radiation Work Safety Analysis of X-ray Instrument in Radiology Unit of Yogyakarta Hospital City, Bromine Determination Well Water of Klampok Village, Brebes Using Neutron Activation Analysis Method, Physical Work Environment Office, Yogyakarta Air Borne Quality Based on the Lead Particulate Concentration, and Development of Welding Defects Identifier Application on
Radiographic Film Using G-ray Level Co-Occurrence Matrix and back-Propagation. His current research is about non-destructive testing technic.