Professional SQL Server
®
Reporting Services
Paul Turley
Todd Bryant
James Counihan
George McKee
Dave DuVarney
Professional SQL Server
®
Reporting Services
Paul Turley
Todd Bryant
James Counihan
George McKee
Dave DuVarney
Professional SQL Server
®
Reporting Services
Copyright © 2004 by Wiley Publishing, Inc., Indianapolis, Indiana Published simultaneously in Canada
ISBN: 0-7645-6878-7
Manufactured in the United States of America 10 9 8 7 6 5 4 3 2 1
No part of this publication may be reproduced, stored in a retrieval system or transmitted in any form or by any means, electronic, mechanical, photocopying, recording, scanning or otherwise, except as permitted under Sections 107 or 108 of the 1976 United States Copyright Act, without either the prior written permis-sion of the Publisher, or authorization through payment of the appropriate per-copy fee to the Copyright Clearance Center, 222 Rosewood Drive, Danvers, MA 01923, (978) 750-8400, fax (978) 646-8700. Address requests to the Publisher for permission to the Legal Department, Wiley Publishing, Inc., 10475 Crosspoint Blvd., Indianapolis, IN 46256, (317) 572-3447, fax (317) 572-4447, Email: [email protected].
For general information on our other products and services or for technical support, contact our Customer Care Department within the U.S. at (800) 762-2974, outside the U.S. at (317) 572-3993 or fax (317) 572-4002. Wiley also publishes its books in a variety of electronic formats. Some content that appears in print may not be available in electronic books.
Trademarks:Wiley, the Wiley logo, Wrox, the Wrox logo, Programmer to Programmer, and related trade dress are trademarks or registered trademarks of John Wiley & Sons, Inc. and/or its affiliates in the United States and other countries, and may not be used without written permission. Microsoft SQL Server is a trademark of Microsoft Corporation in the United States and/or other countries. All other trademarks are the property of their respective owners. Wiley Publishing, Inc. is not associated with any product or vendor
About the Authors
Paul Turley
Paul is an instructor for Netdesk Corporation in Seattle. As a consultant, he has worked with Microsoft Consulting Services on enterprise-scale development projects and has created reporting solutions using Crystal Reports, Active Reports, and Access. Since 1988, he has managed IT projects, designed and programmed applications using Visual Basic 3, 4, 5, 6, ASP.NET, ADO.NET, and SQL Server. He obtained his MCSD certification in 1996. Other certifications include MCDBA, IT Project+ and Microsoft Solutions Framework (MSF) Practitioner.
He designed and maintains www.Scout-Master.com, a web-based service that enables Boy Scout units to manage their membership and advancement records online using ASP.NET, SQL Server 2000, and Reporting Services. Paul has been a contributing author on books and articles including Professional Access 2000 Programming, Beginning Access 2002 VBA, and SQL Server Data Warehousing with Analysis Servicesfrom WROX Press.
My deepest appreciation goes to my wife, Sherri, and our children: Josh, Rachael, Sara, and Krista for their support and understanding while barricading myself in my office for four months. Thanks to Todd Shelton, Lance Baldwin, and the rest of the Netdesk team for supporting our efforts and putting up with this madness.
For their contributions, special thanks to: Tommy Joseph, Disney Internet Group; Andrew Bryan, Dundas Software; Dennis Higgins, Strafford Technology; Mario Raia, Combined IQ.
Paul Turley contributed Chapters 1, 3, 4, 5, 10, 14, and Appendices D and E to this book.
Todd Bryant
Todd has been creating custom data-focused applications and reporting solutions since the early eighties. He began using Microsoft technologies in 1998 and the love affair began. Todd has been contract programming, teaching, and developing custom courseware every since. He is currently working as a trainer at Netdesk Corporation, where he concentrates on Enterprise Solutions, Com+ Services, and Object Oriented Programming using both VB.NET and C#. His certifications include the MCSD, MCSE, MCDBA, and MCT certifications from Microsoft, the CNA certification from Novell, and both CompTIA's A+ and CTT+.
I would like to thank my parents Janice, Gary, and Abby for believing in me. I was not always who I am today. Secondly, I would like to thank my daughter Ali for putting joy in my life, Christine for showing me love, and Tommy and Stephanie for teaching me the true meaning of the word compromise. Lastly, I would like to thank the Lord above who placed so many good people in my life and made all this possible.
James Counihan
James started working with databases and reporting applications when doing research for the government back in 1979. Since then his program management and development experience has been primarily in the retail and energy industries. He's been teaching development courses at Netdesk Corporation in Seattle for the past three years, focusing on integrating LOB applications using Microsoft application servers and web services.
Thanks to my wife and family. It was only with their understanding and support that I was able to participate in this project. With my deepest love and appreciation, thank you!
James Counihan contributed Chapters 6 and 8 and Appendix B to this book.
George McKee
George McKee is a Solution Developer for Avanade Inc., a Seattle-based integrator for Microsoft technology that's a joint venture between Accenture Ltd. and Microsoft. George specializes in the in-house financial systems of Avanade. He has a degree in Chemical Engineering from Brigham Young University and has been using computers and databases to resolve technical and business problems for 25 years. George has MCAD and MCSD certifications. When not sitting in front of a computer, George likes to be found in backcountry skiing in the Washington Cascade Mountains. He can be reached via email at [email protected].
I would like to thank my wife Becky for tolerating various forms of computing at meal times and my physical and mental absence from many family activities while writing this book. My children (George Jr., Ben, Rosie, and Emily) deserve an honorable mention for patience with my generally distracted interest in their activities during the production of this book.
George McKee contributed Chapter 13 and Appendix A to this book.
Dave DuVarney
Dave DuVarney is a Senior Consultant at Aspirity, LLC where he provides consulting and training services in the fields of business intelligence and software development. He brings over 5 years of finance, programming, and development methodologies experience to high technology business intelligence solutions. Prior to joining Aspirity, Dave was a development instructor teaching a wide range of Microsoft technologies. Dave also spent his early career working for a Seattle-based CPA firm.
When Dave is not working, he enjoys running. At the time of publishing, he is training for his first full marathon.
Authors
Paul Turley Todd Bryant James Counihan George McKee Dave DuVarney
Acquisitions Editors
Sharon Cox Katie Mohr
Vice President and Executive Group Publisher
Richard Swadley
Vice President and Executive Publisher
Robert Ipsen
Vice President and Publisher
Joseph B. Wikert
Executive Editorial Director
Mary Bednarek
Editorial Manager
Kathryn A. Malm
Production Editor
Pamela Hanley
Book Producer
Peer Technical Services Pvt. Ltd.
Foreword
Jason Carlson
Many people have asked me, "How can you be so passionate about reporting when it is so mundane?" To me the most exciting thing about reporting is that it is so very common. Like basic transportation, everybody uses it in some way or another. A report is a piece of art, meant to covey a message; but unlike traditional art, that message changes based on the data driving it. The potential to help, and be used by, millions of people and companies is one of the reasons I started writing software and eventually joined Microsoft. No other company can reach out to so many people by making great products accessible.
Reporting is a very broad topic covering areas ranging from packing lists and telephone bills to ad hoc analysis and Excel spreadsheets. When designing Microsoft SQL Server Reporting Services, I started with a simple definition for it: an information delivery platform. While this definition is also very broad, it did allow us to focus on our design while leaving us significant room to expand in later versions. This book will help you understand the power of Reporting Services and fully to utilize its capabilities.
Information is not just data; it is data that has been transformed into something meaningful. This transformation is important. Any tool can read and display data; what people really need for doing their jobs is well thought out, correct, and pertinent information. There are many tools that allow anyone with access to data to build "views" or "reports". However, many times these users are unfamiliar with all of the nuances of the data storage and can produce inaccurate results or inadvertently affect the
performance of the data engine. Reporting Services acts as the official source so that there is only one version of the truth that everyone uses.
In future, Microsoft plans to take this even further by integrating with Information Rights Management so that not only does the information come from a single source, but is also certified, can expire, and is access-controlled even after it is delivered to the end user. The data does not always exist in one database or even come from a database. For those of us who have spent careers working with corporate data, this is a painful truth. Very few reports (or sets of reports that give you sufficient insight) come from a single source. Building some type of data mart or data warehouse is the best solution, but not always possible due to timing, policy, or budgetary constraints. Reports must be able to retrieve data from any source and combine them in a single report.
Foreword
will need? Reporting Services insulates you from these choices. All reports may be distributed in any channel or rendered in any format. Report design is independent of how it will be consumed. It is the responsibility of the system to provide the report as accurately as possible, given the constraints of the specific format or channel requested.
Building a platform is very different from building a solution. In fact the goals are in many cases completely opposed. A platform is successful if the developers and administrators have complete access to all aspects of the product. They need to be able to optimize, extend, restrict, embed, and replace parts of the product to meet their needs. This means that all of the APIs are available and documented, all formats are open and described, and every component is configurable or replaceable. While there are always restrictions due to the many tradeoffs in software design, this was the goal when building Reporting Services. Very much like Windows, SQL Server, or Visual Studio, Reporting Services is designed to enable developers to build on a solid foundation and mold it to meet the business needs in significantly less time and with more functionality, but without losing the flexibility and power of building it themselves.
Looking to the future, there's an endless list of features and scenarios that Microsoft will add to make the platform more powerful with little or no additional in-house development required. I have mentioned some, and there are many that haven't even been considered yet.
We look forward to hearing from all of our customers about what is important to them and how we can make designing, building, and operating their information delivery systems easier, faster, and (I hope) more fun.
Jason Carlson
SQL Server Reporting Services Product, Unit Manager, Microsoft
Jason Carlson is the Product Unit Manager for SQL Server Reporting Services. He joined Microsoft in 1996 as a Program Manger for Visual Source Safe and Repository. In 1997, the Repository team joined SQL Server and Jason became the development manager for SQL Server Meta Data Services. In 2001, he built a team and started work on V1 of Reporting Services. Before joining Microsoft, Jason owned and operated an independent software development company. This company provided consulting and vertical software solutions for healthcare and telecommunications.
Foreword
David Cunningham
Agility. In business today, key decisions must be made daily or weekly rather than monthly or quarterly. Leading companies realize that to increase the speed of competitive response, their corporate agility, they need to delegate as much decision-making authority as possible to employees on the front lines. Real-time bidding systems, reverse auctions, accurate costing on spot production, build-to-order manufacturing, a world-wide labor force, and globalization. These are just a handful of the trends in today's business climate that demand better decisions faster.
To be successful in this new model, employees need the best quality information they can possibly get. Information must be accurate, timely, and reliable; and it must be the information they need. Whether your employees are trying to maximize revenues by intelligently attacking new markets, or minimizing expenses through astute purchasing, they absolutely must have the right information at their fingertips.
Microsoft's release of SQL Server 2000 Reporting Services marks an important milestone in the world of business intelligence: information truly accessible to the masses. By building reporting functionality directly into Microsoft's Enterprise Data Platform, SQL Server 2000, software developers and information architects can now count on the availability of a high quality, scalable, and robust architecture on which to build their reporting systems.
For the past 20 years Business Intelligence (BI) has been working its way deeper and deeper into the Enterprise. Previously, the domain of a handful of highly skilled analysts high in the corporate ivory tower, BI is now in the hands of line managers, department heads, and knowledge workers at the very edge of today's organizations.
In the past, dependable reporting systems could be horrendously expensive, with organizations forced to deploy robust reporting services only where the greatest gains could be realized. Microsoft's long-standing objective of reducing information technology cost to spur adoption is again evident in the SQL Server 2000 Reporting Services licensing model. This technology is licensed to anyone currently licensed for SQL Server 2000 and so essentially represents no additional cost. This is a fantastic development for software developers and users alike; it will dramatically increase the adoption and distribution of detailed, accurate, and timely reporting and will push quality BI even further down into the Enterprise.
In this excellent book, the authors walk us through SQL Server 2000 Reporting Services from the basics of practical reporting through deployment and management of reporting solutions written for BI Solution architects, designers and developers; it is certainly a most valuable resource.
David Cunningham
President & CEO, Dundas Software
Contents
Introduction
xxvii
Chapter 1: Getting Started with Reporting Services
1
Who Is This Book for?
2
Agility
2
The Way We Were
3
That Was Then, This Is Now
4
Business Intelligence and Decision Support
4
Automation to the Rescue – A Scenario
5
Challenges of Existing Reporting Solutions
6
How Does SQL Server Reporting Services Meet This Challenge?
7
Business Intelligence Solutions
8
Who Uses Reports and Why?
8
Executive Leadership 9
Managers 9
Information Workers 9
Customers 10
Vendors and Partners 10
Reporting with Relational Data
10
Reporting for Decision Support
10
Data Warehouses
10
The Reporting Lifecycle
11
Report Delivery Application Types
12
Web Browser 12
Office Applications 12
Programmability 13
Subscriptions 13
Report Formats 13
Importing Data/Exchanging Data 13
System Requirements
13
Installing Reporting Services
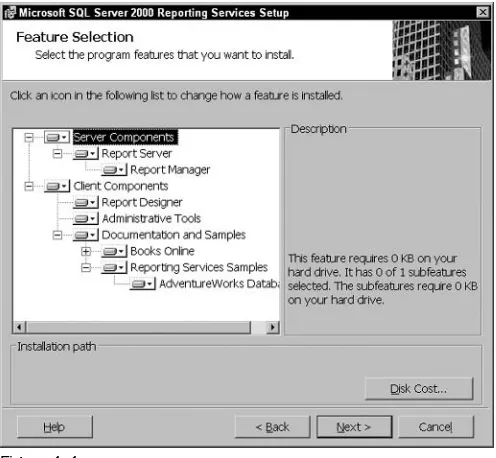
15
Setup Options 15
Adding and Removing Options 16
Server Components 16
Client Components 16
Books Online 17
Reporting Services Samples 17
Administrative Tools 17
Command Line and Unattended Installation 18
Log Files 18
Using Visual Studio .NET
20
Report Wizard 20
URL Access to Reports 26
Rendering Reports in Program Code 26
Report Definition Language
26
Deploying Reports 27
Designing and Architecting Report Solutions 27
Summary
27
Chapter 2: Reporting Services Architecture
29
The Reporting Lifecycle
30
Authoring 30
Management 30
Delivery 31
Reporting Services Features
31
Visual Studio .NET 2003 Integration 31
Chapter Title
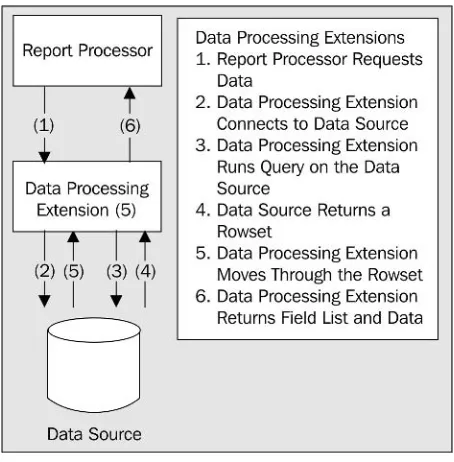
Data Processing Extensions and Data Providers 38
Supported Rendering Extensions 39
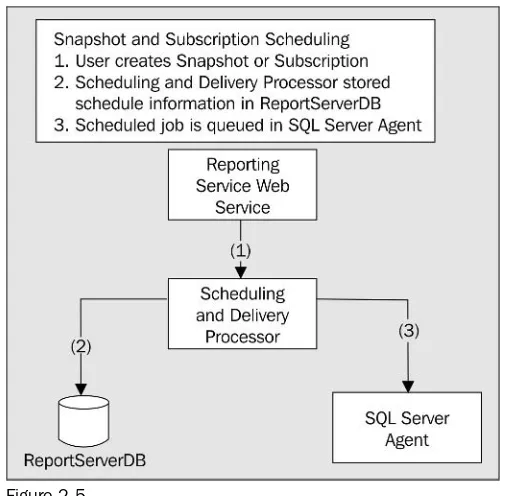
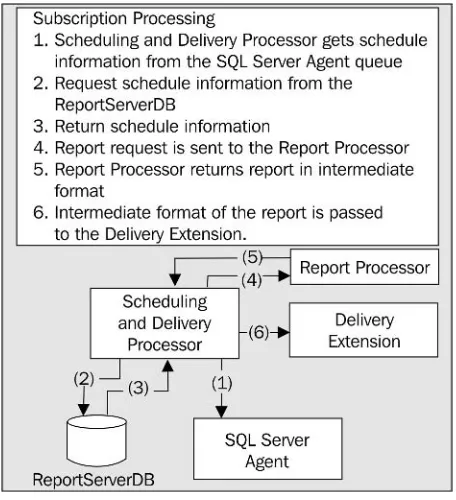
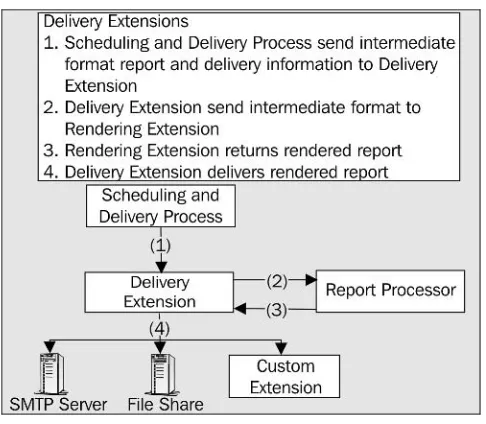
Scheduling and Delivery Processor 41
Scheduling 41
Delivery 42
Scheduling and Delivery Processor Illustrated 43
Email 45
The Reporting Services Web Service
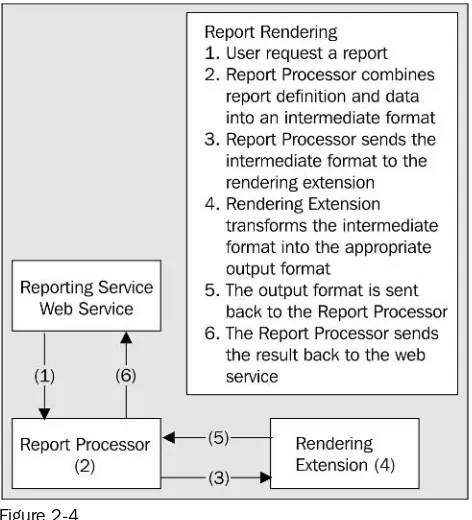
48
Web Services 48
Open Standards 48
Visual Studio .NET Integration 49
Available Features 49
Report Designer
50
Visual Studio .NET 50
Report Definition Language (RDL) 50
Reporting Services Tools
50
Report Manager 50
Report Server Command-Line Utility (RS.EXE) 51
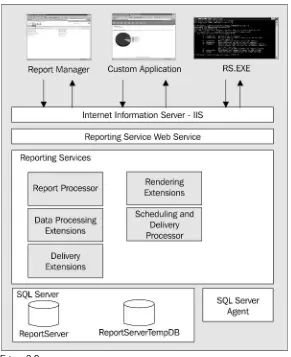
Reporting Services Illustrated
51
Summary
52
Chapter 3: Designing Reports
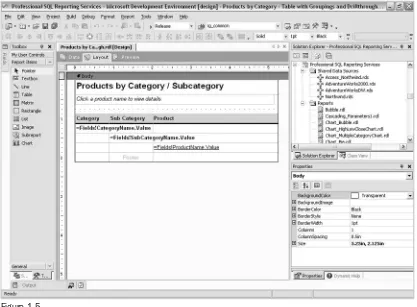
55
Using the Report Wizard
56
Establishing a Data Source 57
Building a Query 59
Define the Report Structure 62
Specify the Deployment Location 63
The Report Designer 65
Report Items and Data Regions
71
Textbox Report Item 72
Drill-Down and Drill-Through Reports 79
Tabular Reports 80
Grouping Data 80
Table Report Data Region 80
List Report Data Region 80
Matrix Report Data Region 81
Subtotals
82
Page Breaks for a Rectangle 91
Page Breaks for a List 91
Page Breaks for a Table 92
Page Breaks for a Group 92
Page Breaks for a Matrix 93
Page Breaks for a Chart 93
Printing Considerations
93
Chapter Title
Chapter 4: Designing Data Access
95
Reporting for Relational Data
97
A Dataset Is Not a Dataset 97
Query Basics
97
Data Sources 98
Creating a Data Source in the Report Wizard 98
Creating a Data Source from the Project Add Item Template 99
Creating a Data Source When Defining a Dataset 99
Data Sources and Query Languages 100
Filtering Techniques
101
Filtering Data with Query Parameters 102
Report Parameters 103
Basing a Parameter on a Query 105
Cascading Parameters 106
Using Stored Procedures 112
Filtering Data with Report Parameters 116
Summary
119
Chapter 5: Advanced Report Design
121
Creating a Tabular Report Using a Table
122
Column Placement and Indentation
125
Headers and Footers
126
Drill-Down Reports
128
Creating a Document Map
130
Links and Drill-Through Reports
132
Bookmarks and Links 132
Area and Line Charts 142
Pie Charts 143
Using Custom Code in a Report 152
Using a Custom Assembly 153
Designing for Mobility
156
Screen Size 156
Offline Solutions 158
Summary
159
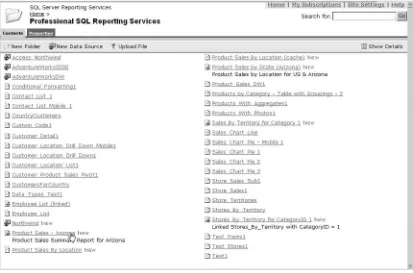
Chapter 6: Managing Reports Using the Report Manager
161
Introduction to the Report Manager
161
What Is Report Management? 162
Understanding the Report Manager 162
The Report Manager Interface 163
Navigating the Report Manager Interface 165
Navigation Tools 165
Breadcrumb Trail 166
Tabs and Options Toolbar 166
Local Menu 166
Global Toolbar and Details Button 167
Searching for Folders and Reports 168
The Report Manager Help 168
About System Site Settings 168
Report History Default Settings 169
Report Execution Timeout 169
Report Logging 169
About My Reports 170
Working with Folders and Reports
171
Creating New Folders 171
Moving Items into a Folder 172
Working with Data Sources
174
Configuring Shared Data Sources 175
Data Source Credentials 177
Credentials Supplied by the User 177
Credentials Stored Securely 178
Configuring Users and Permissions
178
About Report Manager Security 178
Understanding Role-Based Security 179
Using Report Manager Default Security 179
Understanding Roles 180
Understanding Tasks 180
System Tasks and Item Tasks 181
Understanding the Predefined Roles 181
System Administrator 182
Creating a New Role Definition 185
Understanding Role Assignments 186
Creating Role Assignments 187
System Security and Network Considerations
189
Revoking Access to My Reports 190
Intranet and Extranet Considerations 190
Viewing, Executing, and Scheduling Reports
191
Viewing Reports 191
Chapter Title
The Report Execution Process 192
Providing Report Parameters and Credentials 193
On-Demand Reports 194
Caching the Report for Other Users 194
Creating and Editing Schedules 196
Snapshot Reports 198
Creating a Report History 199
Report Subscriptions 200
Standard Subscriptions 202
Data-Driven Subscriptions 202
Summary
203
Chapter 7: Managing Reports Using Program Code
205
Professional SQL Reporting Services Manager
205
Building the Visual Interface
207
Adding a Reference to the Web Service
210
Consuming the Web Service
212
Filling the Treeview
215
Credentials
219
Displaying the Folder Contents
221
Adding/Updating Folders
223
Folder Form 225
Deleting an Item from a Folder
238
Importing Report Definition Files
240
Managing Security
244
Tasks 244
Roles 244
Policies 244
Building the Security Forms 244
Policy Form 244
Adding, Editing, and Deleting Security Policies 250
Adding, Editing, and Deleting Security Roles 261
RoleForm 261
Adding, Editing, and Deleting Roles 266
Role Task Form 266
Summary
275
Chapter 8: Report Scripting
277
Command Line Utilities
277
rsconfig 278
rskeymgmt 278
rsactivate 279
rs 279
Automating Server and Report Management
279
Reporting Services RS Utility
280
RS Utility Command Line Syntax 280
RS Utility Errors 282
Script Development
283
Reporting Services Web Service 284
Building a Script Development Harness
285
Creating the Console Project 285
Adding Imports Statements 287
Adding References 288
Using Conditional Compilation 290
Accessing Server Items
291
Creating the Proxy Instance 291
Passing Variable Values to the Script 293
Retrieving Items 293
Chapter 9: URL Access and Programmatic Rendering
307
URL Access
308
URL Syntax 308
Accessing Reporting Services Objects 308
Folders 309
Data Sources 309
Resources 311
Reports 312
Reporting Services URL Parameters 312
Parameter Prefixes 313
Parameters 314
Passing Report Information through the URL 318
Report Parameters 318
Rendering Snapshot History 319
URL Rendering Summary 319
Programmatic Rendering
320
Chapter Title
Server-Side Parameters 320
Rendering through Windows 321
Building the Application Interface 321
Setting Up the Reporting Service Web Service 321
Retrieving Report Information 325
Retrieving Report Parameters 328
Rendering a Report to a File System 330
Rendering a Report to the File System Summary 337
Rendering to the Web 337
Using Integrated Authentication 337
Modifying the web.config File 338
Setting Up the Reporting Service Web Service 339
Rendering to the Response Object 339
Rendering to the Web Summary 345
Summary
346
Chapter 10: Report Caching and Subscriptions
347
Report Delivery
347
Configuring Credentials for Data Sources
351
Storing Credentials 351
Individual and Shared Schedules 359
Configuring Email Delivery 361
File Share Subscriptions 361
Pocket PC Report File Updates 363
Data-Driven Subscriptions
363
Managing Subscriptions
365
Using the Reporting Service Web Service
366
Managing Subscriptions Using Script
375
Summary
376
Chapter 11: Report Definition Language
379
RDL – Underlying Technology
379
XML Schema 384
Chapter 12: Extending Reporting Services
411
Overview
411
The Missing Pieces
412
Security Extensions 412
Rendering Extensions 412
Extensible Report Designer Classes 413
Business Opportunities
413
Common Extension Interfaces
413
What Is an Interface? 414
IExtension 414
IDisposable 415
Interface Language Differences 415
Data Processing Extensions 416
Creating a Custom Data Processing Extension
418
Creating the Project 418
Creating the CSVConnection Object 419
Variable Declarations 419
Creating the CSVParameter Class 424
Declarations 424
Implementing IDataParameter 424
Chapter Title
Creating the CSVParameterCollection Class 426
Namespaces 426
Implementing IDataParameterCollection 427
Creating the CSVCommand Class 428
Constructors 428
Creating the DataReader Object 434
Declarations 434
Installing the CSVDataProcessing Extension 438
Testing the CSVDataExtension 439
Summary
441
Chapter 13: Deployment Strategies
443
Architecture Review
443
Reporting Services Web Service 446
Scale Up 446
Reporting Services Components Illustrated 447
Reporting Services Deployment Scenarios
448
Small Deployment 449
Medium/Large Deployment 450
Enterprise Deployment 451
System Requirements and Prerequisites
452
Server Requirements 452
Licenses 454
Report Server Database 454
.NET Framework Requirement 454
Configuring Windows Server 2003 Application Server 454
Client Requirements 456
Scaling Up Reporting Services 462
Report Server 462
Credentials 463
Server Configuration Files 463
Configuring Using the Command Line Utility 464
Administrative Issues
465
Database Space Requirements 465
Backup and Restore 466
Report Server Database Backup 466
Encryption Key Backup 466
Chapter 14: Designing Business Intelligence Reporting Solutions
473
Approaching Solution Design
474
Define the Business Problem 474
Performance Gaps 474
Missed Opportunity Costs 474
Current State/Future State 475
Business Goals and Objectives 475
Direction 475
Transactional and Decision-Support Data 480
Chapter Title
Why Be Normal? 481
Understanding Business Intelligence
482
BI Process Lifecycle
482
Information Gathering 483
Data Scrubbing and Consolidation 483
Data Staging and Transformation 484
Indexing Strategies 484
Decision-Support 485
Query Languages 487
Multidimensional Expressions (MDX) 487
OLAP and SQL Server Analysis Services 487
Architecting BI Solutions
490
Farms and Gardens 490
Federating and Partitioning Data 491
Reporting Solution Design
491
Linked Reports for Multiple Field Offices 494
Scout-Master.com 496
Reporting Solution Development Environment
498
Isolated Development 498
Reporting Services Books Online 501
Microsoft Knowledge Base 502
Changing Database Connection Information 504
Appendix B: Migrating Access Reports
509
Property Settings
510
Functions
513
Report Elements
513
Appendix C: Reporting Services Object Model
515
Appendix D: Transact SQL Query Functions and Expressions
547
Naming Conventions
547
Tables 547
Columns 548
Views 548
Stored Procedures 548
User-Defined Functions 549
Multi-Part Names 549
Functions
549
Numeric Manipulation 549
String Manipulation 550
Mathematical 552
Dates 553
Aggregate Functions 554
Grouping Variations 554
Type Conversion and Formatting 555
Logic 555
Query Criteria 555
Appendix E: Configuration Files
557
XML Basics
557
Configuration Files
558
The RSReportServer.config File 558
The RSWebApplication.config File 559
The ReportingServicesService.exex.config File 560
The RSReportDesigner.config File 560
Introduction
SQL Server Reporting Services is a serious reporting platform that delivers real business intelligence to knowledge workers and business decision makers. It has the ability to render reports in many different formats and also to execute those reports on demand, cache, archive, or automatically deliver them to users. Whether you need reports to extend a custom desktop application, web site or a simple out-of-the-box reporting solution, Reporting Services can make it happen. The fact that Microsoft makes this capability available as an extension to their flagship database product with no additional investment is exciting news.
Whether you're a novice or an advanced-level programmer, you'll learn to create reports with the right tools for the job. We start with the architecture of Reporting Services and learn about its foundation of .NET and XML web services. You will learn how easy it is to design reports practically for any data source. We cover the basics thoroughly and show you everything you need to get started, working through the processes of report authoring, management, and delivery. You'll create dynamic, interactive reports with drill-down and drill-through features. With the use of tables, groupings, subreports, matrices, images, and charts, reports can be attractive and to-the point. You'll use the Report Manager to configure and execute reports. Next, we'll extend the capabilities of advanced reports using .NET programming code and custom expressions.
After several comprehensive exercises in report design, we will build custom viewing and management tools for advanced reporting solutions. You'll learn to use objects in code and script to render reports, create custom data processing extensions, and manage security and subscriptions. You'll learn how to design and extend reports with the Report Definition Language (RDL).
Finally, we'll put all the pieces together and discuss designing complete solutions and deploying reports and Reporting Services in your business environment. Five experienced authors have worked very hard over several months to make this book a comprehensive tutorial and source of useful information. We sincerely hope it will be a valuable addition to your reference library.
Who Is This Book for?
What Does This Book Cover?
Introduction to Reporting ServicesIn Chapters 1and 2, you will learn what Reporting Services really is and what makes it a unique and powerful reporting solution. We will introduce the stages of the reporting lifecycle and frame the steps and tasks necessary to create a functional reporting solution.
Authoring Reports
This section spans Chapters 3, 4,and 5. These three chapters will teach you how to design reports using the report project template in Visual Studio .NET and the report designer tools. Using all of the available report items and data range items, you will create powerful reports with data groupings, conditional formatting, drill-down and drill-through features.
In Chapter 3,you will learn the basics and shows you how to use the Report Wizard and Report Designer environment in Visual Studio.NET.
In Chapter 4, you will learn how to plan and create data sources, design queries, and work with parameters and filtering techniques.
Chapter 5will introduce you to advanced programming techniques using in-line expressions, custom code, and reusable code assemblies.
Managing Reports
In Chapter 6, you will use the Report Manager to configure, secure and manage the execution of reports organized by business units or categories. You will also learn the basics of caching, creating snapshots and history, and creating subscriptions.
In Chapter 7,you will learn how to manage reports using the Reporting Services Web Service through custom program code.
In Chapter 8you will learn how to manage and administer all reports and your Report Server using command line and batch scripting.
Report Delivery
In Chapter 9,you will learn you how to render reports using program code with the Reporting Services Web Service. This powerful feature can be used to integrate reporting into custom business applications, creating a seamless user experience.
In Chapter 10,you will learn the details of subscriptions—giving users the ability to have reports delivered to them on a regular schedule. Using custom program code, subscriptions and snapshots may be used to deliver important business information to users when data changes and as conditions arise.
Chapter Title
Chapter 11explores the details of RDL and shows you how to define reports in file-based XML. Using custom tools and programming, reports may be designed and created outside of the Visual Studio.NET environment. You will walkthrough an end-to-end solution using a third-party tool.
Chapter 12will take you into the core of Reporting Services and show you how to replace and enhance its fundamental capabilities. You will create a custom data processing extension and see how the architecture supports the ability to build your own data access, security, and rendering extensions.
Chapter 13discusses the nuts and bolts of deployment and report server administration. You will learn to plan and design a scalable and secure Reporting Services solution.
Finally, Chapter 14offers a birds-eye view of Business Intelligence (BI) and discusses the concepts and issues involving database design, indexing, and delivering enterprise-wide decision-support systems.
What You Need To Use This Book
In order to use SQL Server Reporting Services and to run the samples in this book, you will need:
❑ SQL Server 2000, any edition. An evaluation version of SQL Server and Reporting Services may be downloaded from Microsoft at http://www.microsoft.com/sql.
❑ Windows 2000, Windows Server 2003, or Windows XP.
❑ Visual Studio .NET 2003, any edition.
❑ Pentium II class PC with a 500 MHz processor and 256 megabytes of RAM. The complete source code for the samples is available for download from our web site at
http://www.wrox.com/. There are versions available in both Visual Basic .NET and C#. (See the Source Code
section later in this introduction.)
Conventions
To help you get the most from the text and keep track of what's happening, we've used a number of conventions throughout the book.
Tips, hints, tricks, and asides to the current discussion are offset and placed in italics like this.
As for styles in the text:
❑ We highlightimportant words when we introduce them
❑ We show keyboard strokes like this: Ctrl+A
Boxes like this one hold important, not-to-be forgotten information that is directly relevant to the surrounding text.
Introduction
❑ We show file names and code within the text like so: persistence.properties
❑ We present code in two different ways:
The Code Foreground style shows new, important, pertinent code. We indent the 2nd line to show that you should enter both lines on one line.
The Code Background style shows code that's less important in the present context or has been shown before.
Occasionally, code that needs to be placed all on one line is split over two because of the layout of the book, as shown in the preceding highlighted code. However, make sure you type it all on one line.
Source Code
As you work through the examples in this book, you may choose either to type in all the code manually or to use the source code files that accompany the book. All of the source code used in this book is available for download at http://www.wrox.com. Once at the site, simply locate the book's title (either by using the Search box or by using one of the title lists) and click the Download Codelink on the book's detail page to obtain all the source code for the book.
Because many books have similar titles, you may find it easiest to search by ISBN; for this book the ISBN is 0-7645-6878-7.
Once you download the code, just decompress it with your favorite compression tool. Alternately, you can go to the main Wrox code download page at http://www.wrox.com/dynamic/books/download.aspxto see the code available for this book and all other Wrox books.
Errata
We make every effort to ensure that there are no errors in the text or in the code. However, no one is perfect, and mistakes do occur. If you find an error in one of our books, like a spelling mistake or faulty piece of code, we would be very grateful for your feedback. By sending in errata you may save another reader hours of frustration and at the same time you will be helping us provide even higher quality information.
To find the errata page for this book, go to http://www.wrox.comand locate the title using the search box or one of the title lists. Then, on the book details page, click the Book Erratalink. On this page you can view all errata that has been submitted for this book and posted by Wrox editors. A complete book list including links to each book's errata is also available at www.wrox.com/misc-pages/booklist.shtml.
Chapter Title
p2p.wrox.com
For author and peer discussion, join the P2P forums at p2p.wrox.com. The forums are a web-based system for you to post messages relating to Wrox books and related technologies and interact with other readers and technology users. The forums offer a subscription feature to email you topics of interest of your choosing when new posts are made to the forums. Wrox authors, editors, other industry experts, and your fellow readers are present on these forums.
At http://p2p.wrox.com,you will find a number of different forums that will help you not only as you read this book, but also as you develop your own applications. To join the forums, just follow these steps:
1.
Go to p2p.wrox.comand click the Registerlink.2.
Read the terms of use and click Agree.3.
Complete the required information to join as well as any optional information you wish toprovide and click Submit.
4.
You will receive an email with information describing how to verify your account and completethe joining process.
You can read messages in the forums without joining P2P, but in order to post your own messages, you must join.
Once you join, you can post new messages and respond to messages other users post. You can read messages at any time on the Web. If you would like to have new messages from a particular forum e-mailed to you, click the Subscribe to this Forumicon by the forum name in the forum listing.
For more information about how to use the Wrox P2P, be sure to read the P2P FAQs for answers to questions about how the forum software works as well as many common questions specific to P2P and Wrox books. To read the FAQs, click the FAQlink on any P2P page.
Acknowledgments
Our thanks to the members of the product team for making themselves accessible and responsive. We appreciate you allowing us to participate—in a small way—in the process of making this a great product. You've done a fantastic job! To Jason Carlson and the rest of his team, thanks taking the time to field questions and support our efforts with this book.
Kudos to Andrew Bryan and David Cunningham at Dundas Software for your help with the charting features. The integration in the product is awesome and your assistance has been invaluable. Thanks to Dennis Higgins from Strafford Technology and Mario Raia from Combined IQ for your business perspectives. To Tommy Joseph from Disney Internet Group: thanks for starting all of this madness. We owe you cheesecake with bacon. A big thank you goes to Eric Smith for contributing his code generation tool, CodeSmith, to the development community and the RDL templates to generate custom reports.
Special thanks goes to the Todd Shelton, Lance Baldwin, and the rest of the Netdesk team for your patience and support as we've tested the limits of time, energy, and human sanity.
Getting Started with
Reporting Ser vices
SQL Server Reporting Servicesis an amazing offering from Microsoft that will change the way you create and deploy reporting solutions. It's difficult to fully appreciate the revolutionary nature of this product until you understand its architecture. The look and feel of the Report Designer environment and the functionality of a particular report view window have little to do with its full capabilities. Like your favorite media player program, you can always bolt-on another skin or façade, but it's what's inside that really matters. The product group has done a stellar job by providing a design environment and a nice web-based report management and viewing
application. The impressive part is the underlying architecture that makes SQL Reporting Services a fully scalable and extensible solution that is also surprisingly easy to work with.
If you are impressed by the capabilities of the .NET Framework, web services, SQL Server, and ASP.NET, you should know that by using these technologies Reporting Services takes data accessibility to the next level. Microsoft is making good on their promise of making information available "any time, any place, and on any device." Reports may be designed using specific rendering formats and page sizes to support mobile devices. There are many other reporting tools with impressive capabilities but none of them are quite like this one.
This chapter will introduce several topics that will be covered in greater detail later in the book. This will be a high-level view of the need for, purpose, capabilities, and mechanics of SQL Server Reporting Services.
In short, this chapter includes a discussion on the following main topics:
❑ The history of reporting
❑ Business Intelligence (BI)and decision support in current and past reporting solutions
❑ Reporting solutions and application types used to deliver reports
1
Chapter 1
❑ Installing Reporting Services, setup options, resources, and tools
❑ Report Definition Language (RDL)
Who Is This Book for?
Since you've picked up this book, you may be in need of a reporting solution. You may be an application developer, solution architect, project manager, database administrator, or business owner. Maybe you're not a technical professional and you just need reports for your business. Perhaps you are the executive sponsor of a project and you need to know what kinds of capabilities are available for IT professionals to build a solution for you. We assume that you have made (or are considering making) an investment in Microsoft products to manage a business process of some kind. You may need SQL Server or Visual Studio .NET.
We have made it a point to address several aspects of reporting from the perspectives of executives and business managers who need to have solutions developed for them; project managers, business analysts, and software developers who will design and create solutions; and for database and system
administrators who will configure, deploy, and maintain databases and business reporting infrastructure.
After spending a couple of months with the early beta release versions of Reporting Services and building solutions with them, I had the opportunity to conduct some early adopter classes for BI and report solution professionals before the product was released. For most, this was their first look at SQL Reporting Services. Everyone was impressed and excited about putting it into practice. I was taken back by a handful of non-developers who complained that they wanted to use Visual Studio to create reports. "Why should we have to buy this product and learn to use it?"they asked.
In Chapter 11 you will see how designing reports isn't restricted to the Visual Studio .NET design environment. There will likely be other design tools for building reports in the market soon. The fact is that designing reports is easy. If you have used other report design tools, I'm sure you will agree. One nice thing about using the Visual Studio report designer is that it feels like the other Microsoft products you already know how to use. If you are a Microsoft developer, you'll love it. If you're not a developer, you'll love it when you realize how easy it is to design, deploy, and manage very powerful reporting solutions with it.
Agility
During your customer's opening presentation, they tell you that they have recently made a huge investment into full motion video imaging equipment. Now they need a backup system that can handle large file capacities. They are prepared to make an investment that is substantially larger than what you had anticipated for a capable backup solution. Your company began to offer a large-scale solution just a couple of weeks ago but you aren't very familiar with its capabilities. You've spent so much time preparing to sell the smaller system that you haven't had time to learn more about this new product. Your associate is doing introductions, and it will be your turn in about 15 minutes.
Discretely, you open your Pocket PC Phone and access the World Wide Web. You login to your
company's secure report server, select the product catalog report; choose the product category and then
drill-downto the new product. The report has a drill-throughoption that lets you quickly view a detailed specification report for the new, high-volume backup system. After noting the pertinent specifications, you save this report to a PDF file and then choose the customer sales inquiry history report. Looking up this customer, you learn that someone named Julie made an inquiry about two months ago regarding video media backups from this very company.
Looking around the room, you find a name card with her name on it. You explore the details of this call, and you find that she had asked if you offer a solution comparable to a very expensive product from a competitor. Checking the competition's web site, you discover that the competing product Julie had mentioned uses older technology, has a smaller capacity than the new system, and it costs considerably more. You save a report with all of the pertinent specifications to your memory card, hand the card to the administrative assistant sitting next to you, and ask that he make printed copies of the PDF file it contains.
Your colleague finishes her presentation and then introduces you. Taking another quick glance at the new product specs, you begin your introduction. You explain that one of your team's greatest strengths is your real experience and understanding of how business can change day-to-day. In order to be responsive and competitive, it's necessary to adapt to these changes. You show the brochure for the mid-scale product and explain that this product would be an excellent solution for a company that just scans documents. But for digital video, a more capable solution is required. You share the product
specification and qualify the product to your customer's needs. During your presentation, the
administrative assistant returns with the printed specification report. Not missing a beat, you distribute these to everyone and conclude. Making brief eye contact with your colleague, he raises an eyebrow just before your customer's chief decision maker, Julie, aggressively shakes your hand, and thanks you profusely for your time and effort.
The Way We Were
In many business applications, reports were an afterthought. This lack of planning often forced developers to build ad-hoc reports with little opportunity for significant planning and design. Queries became complicated and difficult to support. Reports ran slowly and were prone to errors. To avoid these difficulties, you really need a plan. In a perfect world, you would architect the database and application around your reporting needs, and would completely understand your users' requirements before designing the system. In the real world, you may understand some of the users' needs ahead of time but chances are that new reports will be requested long after the other features are in place.
According to Frederick P. Brooks' The Mythical Man-Month, it's usually a good idea to learn from and throw away your first few attempts at almost any design. I typically try to develop reports in stages
realizing that the first attempt will be a prototype. My experience has been that when you gather the initial requirements, users will ask for a handful of different reports based on some specific criteria. After the solution is deployed and people begin to use it, others will almost inevitably realize that they too would like reports to help make their jobs as easy as their associates. As users realize what kinds of information they can get, they will find new and exciting ways to sort, filter, group, pivot, and slice and dice their data – in ways they never thought possible. That is, until you show them the possibilities.
That Was Then, This Is Now
Static, printed reports may be an acceptable format for a list of products and prices or for a company, but not for the majority of the information people use to make important decisions today. Business decision makers need pertinent information, and they need to view it in a manner that applies to that person's role or responsibility. Since most users deal with information in a slightly different manner, you can create hundreds of reports, each designed for a specific need. Alternatively, you can create flexible reports that serve a broader range of user needs. For example, a sales summary report could be grouped or filtered by the sales person's region, by customer type, and include information for the week, month, quarter or year, or for a specific product category. To produce individual reports for each of these needs would be time-consuming and cost prohibitive. Besides, computer users are savvier than they were a few years ago and need to have tools that help them take informed decisions, not just look at the numbers.
I recall working at Hewlett-Packard several years ago in a manufacturing site IS group. Every Thursday a report cart would come around. There were several regularly scheduled reports that the mainframe system produced on a weekly and monthly basis. Users, typically department managers, would subscribe to these reports that were then printed in another building and delivered by hand to each subscriber. Many of these reports were little more than a huge list of numbers and text printed on continuous, fan-fed paper – some as large as 500 pages. I watched inquisitively as managers would meticulously scan through the pages, highlighting and circling figures of interest. Some would bind them into large books and give them to their administrative assistants to go through with a ten-key calculator and add up all of the figures they had highlighted.
At the end of the month dumpsters full of these reports were hauled off to landfills and recycling centers as their usefulness quickly came to an end. I spent nearly two years developing a reporting application for this group using Microsoft Access. We originally planned for eight to ten reports in this application. But as time went on, and users began to rely on the reports to perform their jobs, they would ask for the same reports with different sorting, grouping, and selection criteria. In the end, we deployed some 25-30 reports, most of which were variations on the few original reports.
Business Intelligence and Decision Support
Dennis Higgins is a BI Consultant with Strafford Technology, Inc. in Windham, NH. He says, "I think one of the greatest challenges to providing BI Solutions is to educate the customer as to the extent of the long-range problems (and the associated business costs) caused by disjointed attempts to derive information from corporate data. Closely related to that is to correct the normal tendency to apply band aids. Foresight and planning with a BI
process of developing the solution. Integration of existing systems, new tools, or BI Platform migration can then be tackled based on priority and available resources."
Business executives understand that it's important to have good data. They reason that good data should lead to good decisions, and good decisions mean good business. This makes sense, right? A very common scenario today is that businesses trying to get that edge will invest in expensive ERP systems that effectively gather and store mountains of customer, product, and sales information. Mission accomplished? Wrong! These days, the time between data entry and consumption is very short, almost instant. More effective data-gathering mechanisms result in data silos and data warehouses populated to the gills with all kinds of facts.
The new generation of business workers are informed and empowered to make decisions. They need tools to get useful information and respond to changes. Having data available is useless unless it has business value and can be used to effectively take informed decisions.
A fundamental fact in business is that the people who gather and collect data are often not the people who use that data or need access to the information that the data represents. Business executives, managers, and analysts make strategic decisions everyday that may affect many people, the direction of their organizations, and ultimately, the way people and organizations will go about conducting business in the industry. These decisions are largely driven by the relative height of a bar displayed in a chart or a few numbers printed on a piece of paper. Having capable reporting tools doesn't necessarily solve this problem. Most businesses don't know how to effectively use the products they own. A reporting tool is of little value if it's complicated and difficult to use.
This presents some fundamental challenges such as collecting comprehensive, accurate and meaningful information, storing it in a form so it continues to represent the facts, and presenting the information in a concise and unbiased form. On the surface, it seems like a simple task.
Automation to the Rescue – A Scenario
I'll share an example of this kind of challenge. Several years ago, I spent a few months developing a reporting system for the operations group at a paper mill in the Pacific Northwest. The old mill is located in a small, remote town and many of the people operating the mill have been working there all of their lives. As is common in the pulp and paper industry, the mill has changed ownership a few times and is currently operated by a very large paper and office supply company.
As time went by and technology changed, several different computer systems were incorporated into the operation of this mill; an IBM 360 and an AS400 system were used to manage customer orders and production history records. The original inventory management system is still in place. It's a very old, special-purpose computer that stores most of its data in a single, flat text file. All of its components are redundant and it hardly ever needs significant maintenance. Shortly before I arrived, a Windows server box was installed with a SQL Server database and an application that would replicate production and inventory data from the existing database systems. Management within the parent company believed that they didn't have a handle on the rates of material consumption and product quality. They wanted a reporting system that would give them the figures they needed to make adjustments to their ordering and pulp production processes.
Over a period of time, orders would be placed for certain grades of pulp. The system would calculate quantities of ingredients to produce a batch – typically to fulfill an order for a customer. The order would be sent to the production floor where workers had newly installed controls used to assure the accurate delivery of pulp ingredients. Different batches of product continued to be produced with varying degrees of quality and their ability to track the consumption of these materials didn't significantly improve. Management continued to invest in reporting solutions. They bought and developed software to look for trends and perform statistical analysis but to no avail.
After several months and hundreds of thousands of dollars invested, the product quality didn't really improve much. Finally, one of the IT managers put on a hard hat and walked down to the production floor to observe the process. What he learned was a simple lesson: when the orders arrived on their computer workstations, workers were printing the orders and then putting them aside. They had overridden the automated controls and were using the same manual techniques to make paper that earlier generations had been using for decades. It was a matter of tradition and pride, and they weren't about to let some computer do their job for them.
The initial reporting solution was elegant and technically capable. The calculations were accurate and the report presentation was appropriate. However, the solution didn't fully support the process. This cultural hurdle was eventually overcome (workers were instructed to use the automated systems if they wanted to keep their jobs) and the product and process improved. A report is only as good as the data it presents, and the data is only as good as the information used for collection. The information is only as good as the process that it represents.
Challenges of Existing Reporting Solutions
For over ten years, Microsoft has offered only one product with substantial reporting capabilities. Designed to run as a single-user or a small workgroup, desktop application, Microsoft Access is a capable database and reporting solution. In Access 2000, Access Data Projects were added. This extension of the product works well against a SQL Server back-end, in a LAN environment. In Visual Studio 6, an integrated reporting tool was offered for Visual Basic 6 but its capabilities were meager at best. Developers at that time thought this was a glimpse of things to come in subsequent versions of Visual Studio.
Due to the lack of a unified, consistent approach for reporting, many developers have had to revert to creating their own custom solutions. One case in point is the reports starter kit project available on the ASP.NET development support site (www.asp.com). The developers did a bang-up job creating a web-based reporting solution using ASP.NET datagrids and datalist controls. They even made their own pie charts using line drawing objects. This effectively proves that .NET is a powerful arsenal of
programming tools. However, it also makes the point that we have lacked a strong reporting solution to round out Microsoft's front-line development and database suite.
When Visual Studio .NET was released in 2002, I was a little disappointed because the only integrated reporting component was a limited-use version of Crystal Reports. Now, before I get myself into too much trouble with folks who may be loyal to this product, I'll say that Crystal Reports is a capable
Studio is limited to five concurrent users (and the term concurrentis subject to some serious
interpretation). Now that Crystal Reports has changed hands once again (recently acquired by Business Objects), it will be interesting to see how this affects the direction of this well-known product.
Notably, the most remarkable change in the industry over the past few years has been the opportunity and need to exchange information over the Internet. Previous technologies simply don't provide the means to access application components across the Internet. Component architectures such as COM, DCOM, and CORBA were designed to communicate across secure LAN and WAN systems, which required a substantial infrastructure investment. Connecting business trading partners and even regional sites was often cost prohibitive and logistically infeasible. Few options existed for reporting over the web. At best, a list or table filled with data could be viewed in custom-built, server-side web page solutions using ASP or CGI. Each page had to be carefully designed and scripted at the cost of dozens, or sometimes hundreds of programming hours.
With the recent maturity of the web, a new generation of mobile devices is evolving that can connect users to company resources, email, documents, and databases. These laptop, hand-held, palm-top, and wrist-worn devices open new doors of opportunity and present new challenges for data presentation. Perhaps, it will soon be common for people to stagger around the streets, talking to themselves and staring blindly into space in a zombie-like trance as they are connected to the world through web-enabled cerebral implants! We can only hope!
To gain access to useful and readable information, data must be accessible over available communication channels (such as corporate networks and the Internet), easy to access, secure, and available in a variety or formats so that it may be viewed using available document readers or browsers – all compatible with different devices. Did I mention the need to support different Operating Systems (OS), applications, and perhaps, without the installation of any custom software on the client device? This is the challenge.
How Does SQL Server Reporting Services Meet
This Challenge?
SQL Server Reporting Services is a server-side reporting solution that meets all of these requirements and more. It can obtain its data from a variety of data sources that you can access using modern programming tools. That data may be grouped, sorted, aggregated, and presented in dynamic and meaningful ways. The structure of the data and the presentation elements may be transmitted across practically any communication medium, using an industry standard format, to just about any type of client or server computer or device. The resulting content may then be displayed in many standard formats using browsers and document readers. Further, the data itself may be consumed by standard and custom applications to be further parsed, imported, manipulated, and consumed. It's a truly remarkable innovation with incredible possibilities.
Since Reporting Services is based on .NET, it offers the advantage of integrating tightly with the Windows platform and benefits from the performance, scalability, and security inherent to the .NET Framework. When used in concert with BackOffice products like Share Point Portal, it can provide a comprehensive enterprise solution with little programming effort. Reporting Services can be used with ASP.NET and other .NET programming tools to produce highly customized, special-purpose solutions.
In Chapter 2, we will discuss the specific Reporting Services architecture that is used to perform all of this magic. In brief, functionality is exposed through an XML web service that may be accessed across a LAN or across the web. Reports may be rendered in program code or they may be accessed through a simple web address – like any other web page. Reports may be rendered in several formats. These include different flavors of HTML to provide compatibility with different browsers and devices, the Adobe Acrobat Portable Document Format(PDF) for uniform presentation and printing, as a graphic file, and in Microsoft Excel so users can slice, dice, pivot, and re-analyze the data. Content may also be rendered in XML and CSV formats to import and exchange data with a variety of applications.
Business Intelligence Solutions
Traditionally, BI solutions have been very costly and only accessible to large businesses that could afford them. Customer Relations Management (CRM)systems, Online Analytical Processing (OLAP)systems (or data warehouses), and analysis solutions have been available for many years from specialized vendors. However, they require costly deployment, training, and maintenance. By contrast, (this is the part I like the best) Reporting Services is available at no additional cost if you install it on a computer with a licensed instance of SQL Server. Reporting Services is an add-on to SQL Server rather than a stand-alone product. In a single server installation, you don't need an additional license and you can use it royalty free – so long as your database, and server products are appropriately licensed. For additional information regarding licensing and deployment options, please refer to Chapter 13.
Comparatively speaking, collecting data is the easy part. Most companies have been doing this for decades, but how they utilize all of this data is often another story. There is no doubt that effectively collecting data may not be so easy but it's something businesses have been doing for quite some time. Most companies have untold mega-, giga-, or even peta-bytes of "important" archived data residing in documents, spreadsheets, and various databases on backup tapes, disks and folders throughout their enterprise – with no hope of fully utilizing and gaining significant value from it all.
According to Tommy Joseph of Disney Interactive Group, "BI is about more than just tracking product sales. It's about measuring performance, discovering patterns and trends; and measurable forecasting through statistical analysis."
An effective BI solution provides visibility to important facts at all levels of an organization, and gives people access to uniform data from different sources using familiar and easy to use applications. It ties together applications, documents, and data sources in a manner that lets people collaborate and communicate effectively.
BI systems are no longer a luxury but a necessity in many business environments. Today, having access to timely information can make the difference between having a competitive edge and being left in the dust behind competitors.
Who Uses Reports and Why?
In almost any organization, there is a universal condition that people in different roles and at different levels have different perspectives on information. This is typically most apparent in large corporations,