Abstract
Mammography is used to examine human breast and is used as a diagnostic tool. The advantage of mammography is early detection of masses. CAD helps to detect true positive masses and remove false positives. In order to reduce the increasing work-load and improve the accuracy of interpreting mammograms, a variety of CAD systems, that perform computerized mammographic analysis have been proposed. All of the CAD systems require, as a first stage, the segmentation of each mammogram into its representative anatomical regions, i.e., the breast border and pectoral muscle.
Keywords : CAD, Real Time Analysis, Dreadful Diseases
1 INTRODUCTION
Mammography is used to examine human breast and is used as a diagnostic tool. The advantage of mammography is early detection of masses. Mammography remains difficult in some places to detect suspicious region of interest. Region of interest is segmented to analyze abnormalities. The segmented region of interest is then classified to mass or non mass [1]. CAD helps to detect true positive masses and remove false positives. In order to reduce the increasing work-load and improve the accuracy of interpreting mammograms, a variety of CAD systems, that perform computerized mammographic analysis have been proposed. These systems are usually employed as a second reader, with the final decision regarding the presence of a cancer left to the radiologist. Thus, their role in modern medical practice is considered to be significant and important in the early detection of breast cancer. All of the CAD systems require, as a first stage, the segmentation of each mammogram into its representative anatomical regions, i.e., the breast border and pectoral muscle. The breast border extraction is a necessary and cumbersome step for typical CAD systems, as it must identify the breast region independently of the digitization system, the orientation of the breast in the image and the presence of noise, including imaging artifacts.
Figure 1: Block diagram of the proposed method
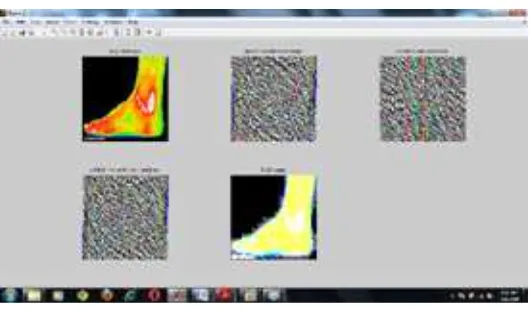
Figure 2: Arithmetic operations on thermal image
• Performance evaluation of disease diagnosed by Machine Intelligence.
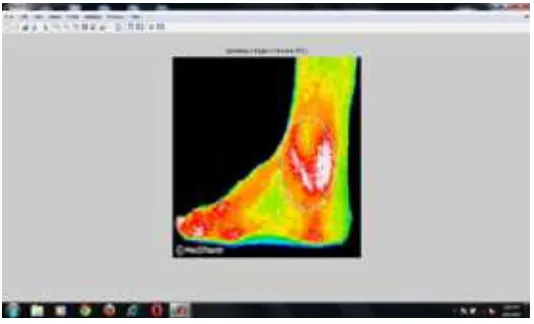
Figure 4: Specifying ROI
Clinical thermography or infrared imaging is based on a careful analysis of skin surface temperatures as a reflection of normal or abnormal human physiology. This Medical re-search has shown thermography to be helpful in the diagnosis of many applications such as Breast Cancer, Nervous System Disorders, Metabolic Disorders, Repetitive Strain Injuries Headaches, Neck and Back Problems, Pain Syndromes, Arthritis, Vascular Disorders, Soft Tissue Injuries among others
Aided Diagnosis (CAD) provides techniques for automatic detection of breast cancer. It gives benign/malignant classification. It reduces the number of unnecessary biopsies.
2 LITERATURE SURVEY ON NATIONAL & INTERNATIONAL
SCE-NARIO
Figure 5: Denoising using filters
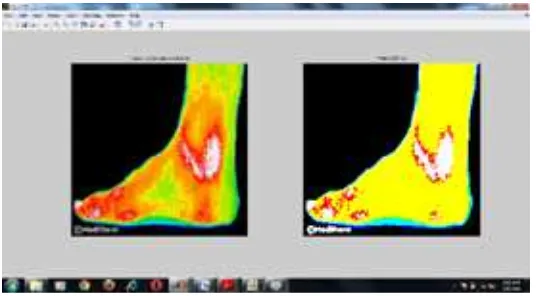
Figure 6: Thresholding
and it is the key screening tool for the early detection of breast cancer. Mammography is highly accurate, but like most medical tests, it is not perfect. On average, mammography will detect about 8090% of the breast cancers in women without symptoms. Mammography is used to examine human breast and is used as a diagnostic tool. The advantage of mam-mography is early detection of masses. Mammam-mography remains difficult in some places to detect suspicious region of interest. Region of interest is segmented to analyze abnormalities.
4 PROPOSED SYSTEM
For early detection of breast cancer considerable research efforts have been devoted to develop Computer-Aided Detection (CAD) systems, which would be beneficial for detecting breast lesions. CAD alerts radiologists to locate suspicious locations on the images during mammographic reading. CAD helps to detect true positive masses and remove false positives. The steps in breast cancer detection using CAD are , Pre-processing, ROI Segmentation and Feature Extraction Denoising Using Filter Edge Detection, Thresholding, Hough transform The block diagram shown in Figure1 is the proposed method which was implemented using Beagle Board.
5 COMPUTATIONAL EFFICIENCY MEASUREMENTS
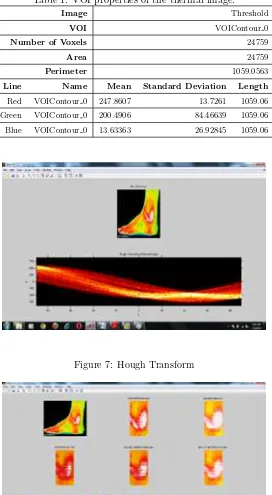
The values in Table1 are computed using MIPAV and Astroart software which gives the quantitative data for the thermal image considered.
Using MIPAV:
6 EXPERIMENTAL RESULTS
Following are results obtained using MATLAB R2013a for the thermal image of a diabetic foot.
References
[1] Anusha D.S., Survey on Computer Aided Diagnosis Methods for Breast Cancer Detec-tion and ClassificaDetec-tion, International Journal of Research in Computer Applications and Robotics, Vol.1 Issue.9, Pg: 127-130, December 2013, ISSN 2320-7345
Table 1: VOI properties of the thermal image.
Image Threshold
VOI VOIContour 0
Number of Voxels 24759
Area 24759
Perimeter 1059.0563
Line Name Mean Standard Deviation Length
Red VOIContour 0 247.8607 13.7261 1059.06
Green VOIContour 0 200.4906 84.46639 1059.06
Blue VOIContour 0 13.63363 26.92845 1059.06
Figure 7: Hough Transform
Figure 8: Cropping
[6] Francis Ring , Thermal Imaging Today and Its Relevance to Diabetes,Journal of Diabetes Science and Technology Volume 4, Issue 4, July 2010 Diabetes Technology Society [] Nobuyuki Otsu (1979). ”A threshold selection method from gray-level histograms”,IEEE