OECD Economic Surveys
Estonia
September
201
7
OVERVIEW
published on the responsibility of the Economic and Development Review Committee (EDRC)
of the OECD, which is charged with the examination of the economic situation of member
countries.
This document and any map included herein are without prejudice to the status of or sovereignty
over any territory, to the delimitation of international frontiers and boundaries and to the name
of any territory, city or area
OECD Economic Surveys:
Estonia
© OECD 201
7
You can copy, download or print OECD content for your own use, and you can include excerpts
from OECD publications, databases and multimedia products in your own documents,
presentations, blogs, websites and teaching materials, provided that suitable acknowledgment of
OECD as source and copyright owner is given. All requests for public or commercial use and
translation rights should be submitted to [email protected]. Requests for permission to photocopy
Executive summary
● Making growth stronger and more inclusive
● Deepening integration in global trade
Making growth stronger and more inclusive
The Estonian economy displays numerous strengths, including an excellent business environment, high educational attainment, high labour market participation, an innovative ICT sector and solid public finances. Economic growth has disappointed in recent years but is now gaining momentum. Around a quarter of the population is still at risk of poverty. Fiscal room is available for measures to increase the long-term growth potential and to make growth more inclusive. Strengthening social protection and life-long education is a priority, as it will help the most vulnerable adapt to the rapid changes induced by globalisation and technological progress.
Deepening integration in global trade
Estonia is well integrated into global trade, and export performance has been resilient. Low and medium value added products still account for a large share of total exports. To increase export potential and value-added drawn from trade, innovative capacity and transfer of knowledge from highly productive firms to the rest of the economy need to improve. Efforts should concentrate on strengthening adult education, immigration of talents, and co-operation between businesses and researchers.
Unleashing productive investment
Investment has weakened, particularly in projects required to increase business productivity. Skill shortages prevent business expansion in some sectors and investment in knowledge-based capital. Weak credit recovery from insolvent firms can limit funding of small innovative firms. The quality of infrastructure has improved, but bottlenecks in logistics remain. Green investment is needed to reduce pollution emitted by the oil shale industry and to achieve energy efficiency gains.
Income convergence has slowed down
Source: OECD National Accounts Database.
1 2 http://dx.doi.org/10.1787/888933580992
0
2000 2002 2004 2006 2008 2010 2012 2014 2016
GDP per capita USD, constant prices, 2010 PPPs
Estonia
OECD
Export performance has been resilient
1. Export performance is measured as actual growth in exports relative to the growth of the country’s export market. Source: OECD Economic Outlook 101 Database(updated with information available on 1 September 2017).
1 2 http://dx.doi.org/10.1787/888933582227
80
2005 2007 2009 2011 2013 2015 2017
Export performance¹ 2005 = 100
Estonia OECD
Investment has weakened
1. Simple average of OECD available countries.
2. Simple average of Czech Republic, Hungary, Latvia, Lithuania, Poland, Slovak Republic and Slovenia.
Source: OECD Economic Outlook 101 Database(updated with information available on 1 September 2017).
1 2 http://dx.doi.org/10.1787/888933582246
10
2000 2002 2004 2006 2008 2010 2012 2014 2016
Non-residential investment As a percentage of GDP
MAIN FINDINGS KEY RECOMMENDATIONS
Fostering inclusive and greener growth
The fiscal space to support growth-enhancing policies is large: the fiscal rule targets a balanced structural budget, even though gross public debt, at 13% of GDP, is the lowest in the OECD and is projected to decline in the medium term.
Increase spending on measures that boost growth potential and welfare. Consider allowing a small deficit in the government budget rule in the longer term.
Social programmes do not provide adequate protection and assistance to the jobless.
The coverage of unemployment benefit schemes is low, making the unemployed less reachable for the public employment services.
Increase subsistence benefits.
Relax eligibility conditions for unemployment benefits, not least to improve participation in active labour market measures.
Labour market participation of mothers is low and the gender pay gap the second highest in the OECD. To tackle these issues, the provision of childcare is being expanded considerably, but the long parental leave remains an important obstacle to gender equality.
Extend the share of parental leave reserved for fathers.
Many workers, especially the low-skilled, are exposed to physical health risks.
Increase sanctions for breaches of health and safety regulations.
Require that employers purchase occupational accident and disease insurance.
Financial incentives to prevent or reduce environmental damage are too low.
Set tax rates on oil shale, vehicle and energy use at a level that better reflects the environmental damage they generate.
Deepening integration in global trade
The business environment is good, but room for simplifying trade administrative procedures exists.
Complete a one-stop shop for administrative formalities. Improve access to information on trade regulation (e.g. agreements with third countries and appeal procedures). Innovative capacity of Estonian firms is limited, and
collaboration between academia and businesses is too low.
Give more weight to co-operation with the private sector when allocating funds to public R&D institutions.
Migration can open up new trade links and ease the adoption of foreign technologies. Policies to attract skilled migrants have had limited success.
Relax annual quotas, and simplify conditions for work permits of skilled workers.
There is no institution in charge of a regular assessment of productivity challenges and of monitoring policies in the field of competitiveness. The European Council advised to set up a national productivity board.
Establish an independent body to advise on policies to raise productivity.
Unleashing productive investment
Insolvency procedures are long and costly. Possibilities of early intervention are limited.
Allow creditors to initiate restructuring.
Introduce early warning mechanisms, such as one-line insolvency tests.
Develop options for out-of-court settlements. Businesses have difficulty finding suitable skilled labour,
and a large share of the population does not have a professional qualification. Participation in lifelong learning is relatively high but its effectiveness questioned.
Strengthen the monitoring of training courses, by using
ex postevaluation of training including labour market outcomes of participants.
Extend the accreditation system to all publicly funded learning programmes to signal and improve their quality. Competition in the banking sector seems low, and few
financing alternatives exist.
Create a centralised credit bureau that will collect both positive and negative information on creditors.
Varying approaches toex anteproject evaluation pose the challenge of identifying the most productive infrastructure investments.
Assessment and recommendations
● Growth is projected to gather pace
● Fiscal and social policies could better sustain inclusive growth
● Unleashing productive investment and export performance
Introduction
Estonia has major structural strengths, including a well-educated and flexible labour force, a business-friendly environment, a robust financial sector, and a strong and credible fiscal policy. It stands out in terms of its educational outcomes and the ease of doing business. Its transition to digitalisation in the public sector is more advanced than in most OECD countries. Major macroeconomic imbalances which had accumulated before the crisis (a large current account deficit and excessive indebtedness) have been addressed, and macro-prudential tools are in place to mitigate the risk of repeated boom-bust cycles. Significant measures have also been taken to improve labour market performance, including tax reforms and additional spending on active labour market policies.
After two years of relatively weak activity, GDP growth has gained momentum and is expected to exceed 4% in 2017 (Figure 1, Panel A). Progress in raising incomes towards those in more prosperous OECD economies is likely to resume, after having slowed almost to a halt (Figure 1, Panel B). Nevertheless, policy action is needed to support growth engines and economic resilience – critical to the convergence process. Productivity growth has been significantly lower than in pre-crisis years, and younger firms have not posted better performance in post-crisis years, suggesting reduced economic dynamism (IMF, 2017). The country faces a more severe decline in its working-age population than in most other European countries, and skill shortages have emerged in some sectors (e.g. information and communication technology and health care). Also, as a small open economy, Estonia is vulnerable to external shocks and is highly volatile as illustrated by GDP developments over the past few decades (Figure 1, Panel A).
Figure 1. Income convergence has slowed down
1. Simple average of Czech Republic, Hungary, Latvia, Lithuania, Poland, Slovak Republic, and Slovenia. Source: OECD National Accounts Database.
1 2 http://dx.doi.org/10.1787/888933580992
-20 -15 -10 -5 0 5 10 15 20
2005 2007 2009 2011 2013 2015 2017 A. GDP growth
Year-on-year percentage changes
Estonia CEE average¹ OECD
0 5 000 10 000 15 000 20 000 25 000 30 000 35 000 40 000
2000 2002 2004 2006 2008 2010 2012 2014 2016
B. GDP per capita
USD, constant prices, 2010 PPPs
Estonia
On many dimensions of well-being, Estonia scores as high as or higher than the typical OECD country, an impressive record for a country with a relatively low level of income (Figure 2). Nevertheless, subjective well-being in Estonia is below OECD standards, which seems to be mainly related to low income and wealth, and to poor health outcomes. Political willingness to address weaknesses is strong, and recent policy measures have already met with some success.
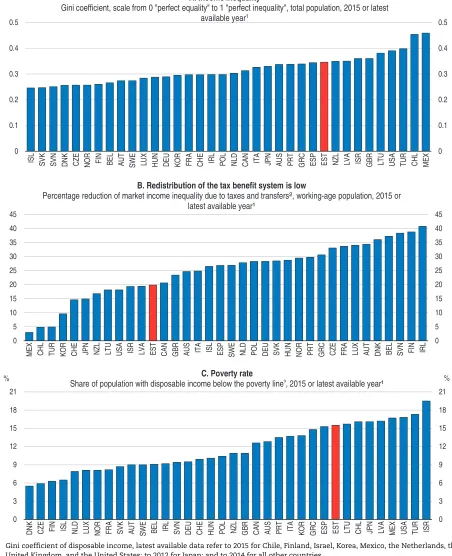
However, poverty and income inequality are among the highest in the OECD (Figure 3, Panels A and C). Over recent years, incomes of the poor have risen, due in part to successive rises in the minimum wage (from EUR 278 in 2011 to EUR 470 in 2017) and from a re-evaluation of subsistence benefits in 2016 (from EUR 90 to EUR 130). Thus, absolute poverty – i.e. the share of those who live with less than around EUR 200 per month – declined to below 4% in 2015.
High income inequality stems from both inequality in market income and very low redistributive effects of the tax and benefit system (Figure 3, Panel B). It leaves a considerable proportion of the population at risk of poverty, with risks significantly higher for the unemployed, disabled and low-educated as in most OECD countries. While a large share of social spending goes to families, poverty rates remain relatively high for lone parents and families with three and more children. The old-aged are also more at risk of poverty, not least due to the relatively low level of pensions. On-going reform of the tax and benefit system aims at reducing inequality (see details below). The reform of the personal income tax planned for 2018 should bring more progressivity to the tax system.
Against this background, the main messages of theSurveyare:
● Estonia has made great strides in increasing incomes and well-being, largely through sound macroeconomic policies and open, outward looking engagement with the world economy.
Figure 2. Well-being can be improved
Note:Each index dimension is measured by one to four indicators from the OECD Better Life Index (BLI) set. Normalised indicators are averaged with equal weights. Indicators are normalised to range between 10 (best) and 0 according to the following formula: (indicator value – minimum value)/(maximum value – minimum value) × 10. The OECD aggregate is weighted by population.
Source: OECD Better Life Initiative 2016.
1 2 http://dx.doi.org/10.1787/888933581011
0 2 4 6 8 10
Income and wealth
Jobs and earnings
Housing
Work and life balance
Health status
Education and skills Social connections
Civic engagement and governance Environmental quality
Personal security Subjective well-being
Figure 3. Estonia lags behind in terms of income inequality and poverty
1. Gini coefficient of disposable income, latest available data refer to 2015 for Chile, Finland, Israel, Korea, Mexico, the Netherlands, the United Kingdom, and the United States; to 2012 for Japan; and to 2014 for all other countries.
2. Redistribution is defined as the difference between market income and disposable income inequality (inequality measured using the Gini coefficient), expressed as a percentage of market income inequality. Market incomes are net of taxes in Hungary, Mexico and Turkey.
3. The poverty threshold is 50% of median disposable income. Source: OECD Income Distribution Database(IDD).
1 2 http://dx.doi.org/10.1787/888933581030
0
Gini coefficient, scale from 0 "perfect equality" to 1 "perfect inequality", total population, 2015 or latest available year1 % C. Poverty rate
Share of population with disposable income below the poverty line³, 2015 or latest available year¹
0
B. Redistribution of the tax benefit system is low
● Sustained economic and social progress hinges in part on policies to reduce inequality and poverty. An adequate social safety net, conducive to upskilling, should be implemented to ensure that all benefit from opportunities created by high trade intensity, while being protected against extreme external shocks.
● Raising investment, including in intangible capital, further integrating into global trade and easing labour-market bottlenecks would lay the foundations for continued and sustained increases in living standards.
Growth is projected to gather pace
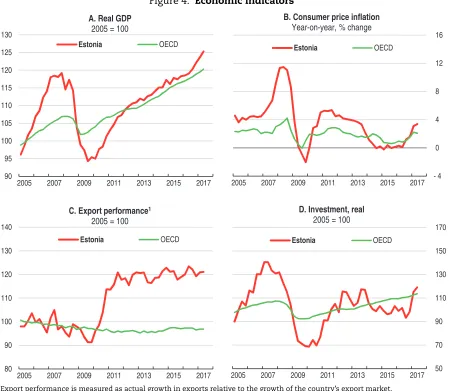
Economic growth has disappointed over the past two years, with GDP growth slowing from close to 3% in 2014 to around 2% in 2015 and 2016 (Table 1). This deceleration was driven by weak foreign demand and successive falls in capital spending (Figure 4, Panel D). As a result, GDP returned to its pre-crisis level only in 2016 (Figure 4, Panel A).
Estonia’s export market performance has been resilient (see Figure 4, Panel C). It exports approximately 80% of GDP, and around half of domestic employment is sustained by foreign demand. The main exported goods are machinery, electronic equipment, oil shale products, wood products, miscellaneous industrial goods and foodstuffs. Services account for around
Table 1. Macroeconomic indicators and projections
Annual percentage change, volume (2010 prices)
2013 Current prices
(billion EUR)
2014 2015 2016
Projections
2017 2018
Gross domestic product (GDP) 18.9 2.8 1.8 2.2 4.2 3.2
Private consumption 9.7 3.5 4.6 4.2 2.2 3.7 Government consumption 3.6 2.5 3.3 2.0 1.3 1.2 Gross fixed capital formation 5.2 -8.0 -3.1 -0.9 18.0 4.1 Final domestic demand 18.5 0.2 2.4 2.5 5.8 3.3 Stockbuilding1 -0.1 3.6 -1.3 0.7 -2.2 -0.3 Total domestic demand 18.4 3.9 1.1 3.4 3.7 2.9 Exports of goods and services 16.0 2.5 -0.6 4.1 3.5 3.4 Imports of goods and services 15.4 3.5 -1.8 5.2 4.5 3.8 Net exports1 0.5 -0.8 0.9 -0.7 -0.7 -0.2
Other indicators (growth rates, unless specified)
Potential GDP . . 2.2 2.2 2.3 2.6 2.9 Output gap2 . . -0.4 -0.9 -0.9 0.6 0.9 Employment . . 0.6 2.6 0.7 0.9 0.2 Unemployment rate . . 7.4 6.2 6.8 6.9 7.8 GDP deflator . . 1.6 1.2 1.5 3.6 3.1 Harmonised consumer price index . . 0.5 0.1 0.8 3.3 2.8 Harmonised core consumer price index . . 1.3 1.2 1.2 2.2 2.8 Current account balance3 . . 0.9 2.2 2.0 2.3 1.8 General government financial balance3 . . 0.7 0.1 0.3 -0.4 -0.7 Underlying government financial balance2 1.2 1.0 1.0 -0.3 -1.0 Underlying government primary financial balance2 . . 1.1 0.9 0.9 -0.3 -1.0 General government gross debt3 14.1 12.9 13.0 13.0 13.5 General government gross debt (Maastricht)3 . . 10.7 10.0 9.4 9.4 9.9
1. Contribution to changes in real GDP. 2. As a percentage of potential GDP. 3. As a percentage of GDP.
40% of gross exports and 60% in value added terms, with maritime transport and tourism being the largest items. The main exporting destinations are Sweden and Finland, with the EU being the destination for 70% of exports. Export diversification has mitigated the impact of weak economic developments in Estonia’s main trading partners, notably Finland and Russia. Nevertheless, some sectors, including food processing and tourism, have been hit by Russia’s economic downturn and its ban on imports of EU food products. The profitability of the domestic oil shale industry, which accounts for around 1% of GDP, has also been affected by the decline in oil prices over recent years.
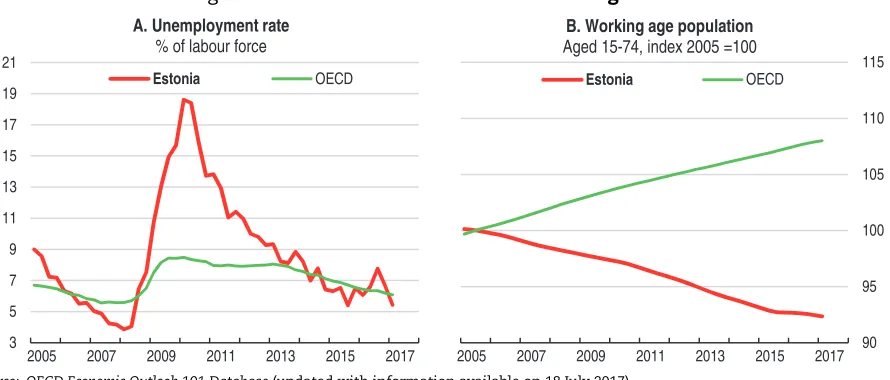
Private consumption has been the main growth engine over the past two years, supported by strong labour market performance, record low inflation and interest rates (see Figure 4, Panel B). Unemployment has declined by around 10 percentage points since 2010 (Figure 5). Since mid-2015, this trend has come to a halt partly due to the reform of the disability benefit pension scheme (the Work Ability reform), which now conditions the receipt of benefits to job-search activity. Recipients of the disability pension with work capacity have to register as unemployed and thereby have access to a range of activation and
Figure 4. Economic indicators
1. Export performance is measured as actual growth in exports relative to the growth of the country’s export market. Source: OECD Economic Outlook 101 Database(updated with information available on 1 September 2017).
1 2 http://dx.doi.org/10.1787/888933581049
2005 2007 2009 2011 2013 2015 2017 - 4 0 4 8 12 16
B. Consumer price inflation
Year-on-year, % change
Estonia OECD
90 95 100 105 110 115 120 125 130
2005 2007 2009 2011 2013 2015 2017
A. Real GDP
2005 = 100
Estonia OECD
80 90 100 110 120 130 140
2005 2007 2009 2011 2013 2015 2017
C. Export performance1
2005 = 100
Estonia OECD
2005 2007 2009 2011 2013 2015 2017 50 70 90 110 130 150 170
D. Investment, real
2005 = 100
rehabilitation measures aiming at improving their employability. Because some of them did not find a job, the unemployment rate has increased. Nevertheless, participation and employment rates stand above OECD average, and labour shortages have emerged in some sectors (e.g. ICT, and health care).
Wages have increased fast (Figure 6, Panel A). While strong wage growth is to be expected in a catch-up economy, it seems out of line with its peers and disconnected from flattening productivity growth (IMF, 2017 and Figure 6). Public-sector wage increases and rises in the minimum wage have played a significant part (IMF, 2017). Also, emigration of skilled labour puts upwards pressure on wages, though Estonia has been less affected by brain drain than its Baltic peers, and the net emigration trend has reversed in recent years (IMF, 2016). The rise in
Figure 5. Labour market conditions have tightened
Source: OECD Economic Outlook 101 Database(updated with information available on 18 July 2017).
1 2 http://dx.doi.org/10.1787/888933581068
3 5 7 9 11 13 15 17 19 21
2005 2007 2009 2011 2013 2015 2017
A. Unemployment rate
% of labour force
Estonia OECD
2005 2007 2009 2011 2013 2015 2017 90 95 100 105 110 115
B. Working age population
Aged 15-74, index 2005 =100
Estonia OECD
Figure 6. Unit labour costs have increased fast
1. Deflated by the consumer price index.
2. An increase in the index indicates a real appreciation and a corresponding deterioration of the competitive position. 3. Simple average of Czech Republic, Hungary, Latvia, Lithuania, Poland, Slovak Republic, and Slovenia.
Source: OECD Economic Outlook 101 Database(updated with information available on 1 September 2017).
1 2 http://dx.doi.org/10.1787/888933581448
90 100 110 120 130 140 150 160
2005 2007 2009 2011 2013 2015 2017 2005 = 100 A. Real wage rate¹
Estonia OECD CEE average³
80 100 120 140 160
2005 2007 2009 2011 2013 2015 2017 2005 = 100
B. Competitiveness indicator²
Based on relative unit labour costs
relative unit labour costs by over 30% since 2005 – the largest among CEE countries (Figure 6, Panel B) – has been compensated by a compression of firms’ margins and gains in non-price competitiveness (Eesti Pank, 2017a). Maintaining price competitiveness could prove challenging going forward, as the decline in the working-age population and emerging shortages of skilled workers will keep wage pressures high (see Figure 5).
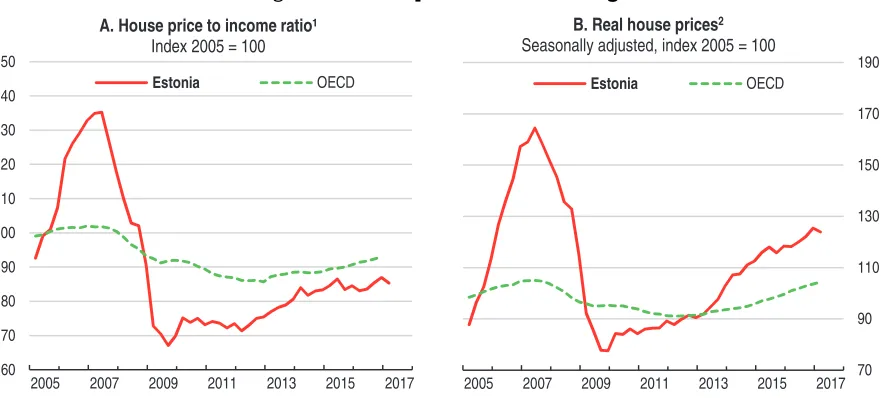
Since the crisis, Estonia has experienced one of the most pronounced declines in the ratio of non-residential investment to GDP (Figure 7), despite the favourable business environment and advantageous financial conditions. Poor investment performance is likely to reflect the weak outlook in main trading partners, a normalisation after the boom years, and lower EU funds disbursements at the beginning of the new programming period. It also stems from domestic factors, including the declining profitability of firms and recruitment difficulties (Figure 8). By contrast, robust growth in household disposable income has supported residential investment: prices in Tallinn now exceed pre-crisis levels but are in line with income developments (Figure 9).
At 2% of GDP, the current account remained in surplus in 2016 mainly due to large net exports of services. On the financing side, FDI inflows have declined significantly since the crisis, falling from 10% of GDP in 2007 to 0.6% in 2015 and reaching 3.8% in 2016. This mainly reflects capital flows towards foreign parent companies in the banking sector, but also modest investment in the manufacturing sector (European Commission, 2017). While it has improved since the financial crisis, the negative net international investment position remains large. The inward FDI stock reached 83% of GDP in 2016, the highest level among peer economies.
Macroeconomic policy is becoming more supportive. Fiscal policy was broadly neutral over 2015-16, but is expected to loosen significantly from 2017 (see Table 1). Financing conditions are also favourable for stronger growth, supported by the very accommodative stance of euro-area monetary policy. Meanwhile, lending conditions have loosened, borrowing costs remain at historically low levels, and access to external funds is deemed
Figure 7. Investment has lost ground
Non-residential investment in % of GDP
1. Simple average of OECD available countries.
2. Simple average of Czech Republic, Hungary, Latvia, Lithuania, Poland, Slovak Republic, and Slovenia. Source: OECD Economic Outlook 101 Database(updated with information available on 1 September 2017).
1 2 http://dx.doi.org/10.1787/888933581790
10 14 18 22 26 30 34
10 14 18 22 26 30 34
2000 2001 2002 2003 2004 2005 2006 2007 2008 2009 2010 2011 2012 2013 2014 2015 2016
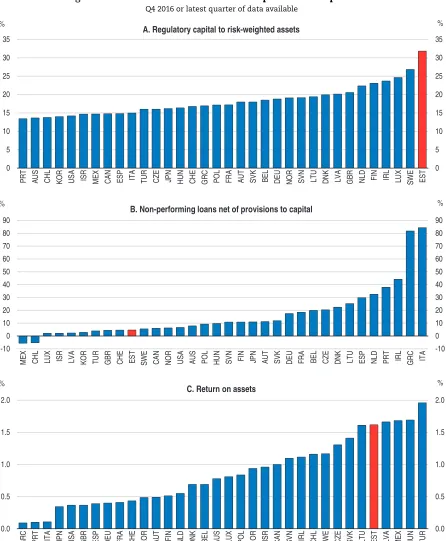
better than in the average EU country (Eesti Pank, 2016, 2017b). The Estonian banking sector seems well capitalised and profitable (IMF, 2017; Figure 10, Panels A and C). Non-performing loans are low (Figure 10, Panel B), but the loan-to-deposit ratio, at 108%, is relatively high.
Sustained by a more supportive macro-policy stance and recovering foreign demand, GDP growth is projected to gain strong momentum and exceed 4% in 2017 (see Table 1). The recovery will also be supported by public investment, in part because disbursement of EU structural funds will pick up. Export growth is set to recover in line with improvements in major export markets, despite continued rises in real wages and unit labour costs. Corporate
Figure 8. Skill shortages are a major obstacle to investment
% of all firms citing a major obstacle,12015
1. Firm responses to the question: “Thinking about your investment activities in your country, to what extent is each of the following an obstacle? Is a major obstacle, a minor obstacle or not an obstacle at all?”
Source:European Investment Bank – EIBIS, EIB Investment Survey
1 2 http://dx.doi.org/10.1787/888933581087
Figure 9. House prices are recovering
1. The nominal house price is divided by the nominal disposable income per head.
2. Nominal house prices deflated using the private consumption deflator from the national accounts. Source: OECD Analytical House Price Database.
1 2 http://dx.doi.org/10.1787/888933581106
0 10 20 30 40 50 60
0 10 20 30 40 50 60
Availability of staff with the right skills
Demand for product or service Uncertainty about the future Availability of finance
Estonia European Union
60 70 80 90 100 110 120 130 140 150
2005 2007 2009 2011 2013 2015 2017
A. House price to income ratio¹
Index 2005 = 100
Estonia OECD
70 90 110 130 150 170 190
2005 2007 2009 2011 2013 2015 2017
B. Real house prices2
Seasonally adjusted, index 2005 = 100
investment will recover supported by foreign demand. The labour force will expand somewhat as a result of the progressive implementation of the disability benefit reform and increases in pension age. Because the employability of some disability benefit recipients is
Figure 10. The financial sector is well capitalised and profitable
Q4 2016 or latest quarter of data available
Source:IMF Financial Soundness Indicators database.
1 2 http://dx.doi.org/10.1787/888933581125
0
A. Regulatory capital to risk-weighted assets
-10
B. Non-performing loans net of provisions to capital
0.0
low, expected increases in labour market participation will be accompanied by an increase in the unemployment rate over the projection period. Household spending will decelerate as inflation resumes. Consumer prices will increase by more than 3% in 2017 due to rising commodities, oil and energy prices, and large rises in excise duties on alcohol, tobacco and fuels (with an estimated impact of 0.9 and 1 percentage point on inflation in 2017 and 2018, respectively). Nevertheless, private consumption will remain strong, supported by rising wages and planned cuts in the personal income tax.
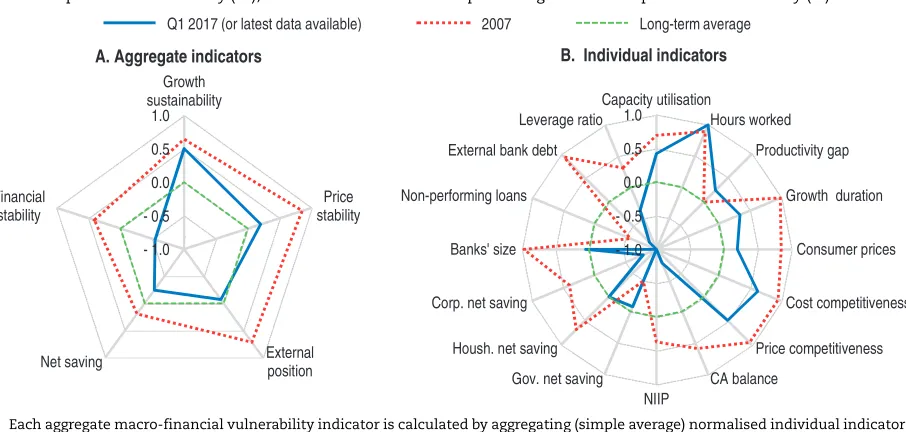
Estonia’s growth prospects are very sensitive to developments in its main trading partners and in the euro area, implying both downside and upside risks. Brexit may have only a small direct impact on the Estonian economy as trade links with the United Kingdom are limited, but may affect itvia its effects on trade in the Baltic Sea region. Domestic negative risks include deeper divergence between wages and productivity growth. Conversely, a higher level of return migration or better-than-expected integration of disabled and older workers in the labour market would relax labour supply constraints and wage pressures. Risks to the projection also include extreme shocks, which might have large economic repercussions if they materialise (Table 2). Macro-financial vulnerabilities have receded since 2007, but one of the tail risks includes capital outflows from Nordic parent banks (Figure 11 and Table 2).
Figure 11. Macroeconomic vulnerabilities have diminished since 2007
Deviations of indicators from their real time long-term averages (0), with the highest deviations representing the greatest potential vulnerability (+1), and the lowest deviations representing the smallest potential vulnerability (-1)1
1. Each aggregate macro-financial vulnerability indicator is calculated by aggregating (simple average) normalised individual indicators. Growth sustainability includes: capacity utilisation of the manufacturing sector, total hours worked as a proportion of the working-age population (hours worked), difference between GDP growth and productivity growth (productivity gap), and an indicator combining the length and strength of expansion from the previous trough (growth duration). Price stability includes headline and core inflation (consumer prices), and it is calculated by the following formula: absolute value of (core inflation minus inflation target) + (headline inflation minus core inflation). External position includes: the average of unit labour cost based real effective exchange rate (REER), and consumer price based REER (cost competitiveness), relative prices of exported goods and services (price competitiveness), current account (CA) balance as a percentage of GDP and net international investment position (NIIP) as a percentage of GDP. Net saving includes: government, household and corporate net saving, all expressed as a percentage of GDP. Financial stability includes: banks’ size as a percentage of GDP, the share of non-performing loans in total loans, external bank debt as percentage of total banks’ liabilities, and capital and reserves as a proportion of total liabilities (leverage ratio).
Source:OECD calculations based on OECD (2017),OECD Economic Outlook: Statistics and Projections(database), June; OECD (2017),Main Economic Indicators(database), June; Statistics Estonia, June; IMF, Financial Soundness Indicators database and Thomson Reuters Datastream.
1 2 http://dx.doi.org/10.1787/888933581144
- 1.0
B. Individual indicators
Fiscal and social policies could better sustain inclusive growth
Using fiscal space for a more inclusive growth
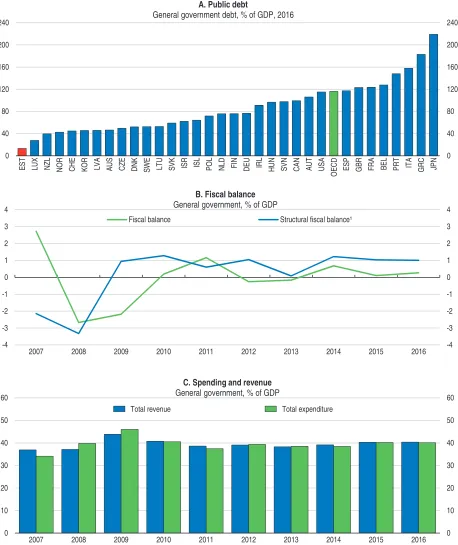
Fiscal policy has been tight over past years, despite economic slack. Estonia has the lowest gross public debt relative to GDP in the OECD (around 13%), a rough budget balance since 2010, and an estimated structural budget surplus since 2009 (Figure 12). The government plans a structural deficit of 0.5% in 2018, 2019 and 0.3% of GDP in 2020. The budgetary plans include broad changes in the tax system and increased spending on infrastructure, health care, education and family benefits (Box 1). The Fiscal Council and the Central Bank have raised concerns about a possible deviation of the deficit from current plans and questioned the expected increase in tax revenues.
Given the current favourable borrowing conditions and the need for growth-enhancing policies, the planned easing of fiscal policy over 2017-20 is appropriate. Fiscal room should be used to increase long-term growth potential, notably for measures that increase labour supply and productivity growth. As detailed below, more needs to be done to support innovative activities in domestic firms, improving access to lifelong education, and fostering labour market participation of mothers, while reducing labour taxation. In addition, public spending should be used to reinforce social protection, which does not adequately protect the most vulnerable against poverty, notably by activating all individuals with some work capacity.
Such fiscal initiatives should rely onex anteevaluation (OECD, 2016a). Cost and benefit analyses have not been systematically carried out for the infrastructure projects planned for 2018-20, and, given the already considerable levels of investment in road and rail transport, it is unlikely that such additional projects will have high positive economic returns. Furthermore, they will inevitably induce extra maintenance costs in the longer run.Ex anteevaluation should ideally be carried out by an independent advisory body tasked with reviewing long-term economic challenges and identifying priorities and synergies, as is done in a number of OECD countries including the Netherlands and Australia.
A well-designed institution can improve the quality of the decision process and contribute to evidence-based policymaking (Banks, 2015). There is no unique institution in charge of undertaking or commissioning the necessary research and analysis to identify the most promising growth-enhancing policies for Estonia. The authorities are considering different options to comply with the recent recommendation of the EU Council to establish productivity boards. While the national context is central in determining the optimal design, mandate, mission and governance of pro-productivity institutions, a recent OECD analysis shows that such institutions should be given sufficient resources, skills, transparency and procedural accountability to fulfil their tasks. It should consider both supply-side and demand-side policies (including those proposed by the government) and have policy evaluation functions (Renda and Dougherty, 2017).
Table 2. Possible shocks to the Estonian economy
Vulnerability Possible outcome
Increase in geopolitical tensions This could trigger an international financial crisis with difficult-to-project consequences for confidence and activity in Estonia.
Figure 12. Fiscal policy has been prudent
1. Per cent of potential GDP. The structural balance is adjusted for the cycle and for one-offs. For more details, see Sources and Methods
of theOECD Economic Outlook(www.oecd.org/eco/sources-and-methods.htm).
Source: OECD Economic Outlook 101 Database(updated with information available on 1 September 2017).
1 2 http://dx.doi.org/10.1787/888933581163
0
2007 2008 2009 2010 2011 2012 2013 2014 2015 2016
C. Spending and revenue
General government, % of GDP
Total revenue Total expenditure
-4
2007 2008 2009 2010 2011 2012 2013 2014 2015 2016
B. Fiscal balance
General government, % of GDP
Fiscal balance Structural fiscal balance¹
0
Improving the fiscal framework
Because of its vulnerability to external shocks, it is prudent that a small open economy like Estonia keeps a relatively low level of debt and room for manoeuvre for countercyclical
Box 1. Draft budget plans
The new coalition government appointed in November 2016 puts emphasis on reducing inequality and fighting the population decline. Budget plans for 2018-20 consist of additional spending in education, health, social welfare and public investment that will be partly financed by raising taxes (Table 3). The authorities expect the structural deficit to reach 0.5% of GDP in 2018 and progressively return to balance by 2021. Such projections are questioned by the Fiscal Council, in particular the level of tax revenues, as changes in the tax system are likely to take time to materialise and their impact is uncertain.
Spending
A sizeable investment plan of 1.3% of GDP has been announced and includes large-scale projects in transport infrastructure, development of the broadband distribution network, and investments in a conference centre in Tallinn, defence and public residential housing. A relatively large share of funds will be allocated to the road and railway networks (36% of the total amount).
Around 35% of additional spending will be allocated to the education system. Teacher’s salaries are set to increase to 120% of the national median wage, and wages in kindergarten will be aligned to the minimum level in schools. These measures are welcome, as teacher wages were particularly low by international standards. They should improve the attractiveness of the teaching profession among young graduates.
Revenues
Changes in the taxation system are expected to increase revenues from corporate income tax and indirect taxation, while reducing labour taxes.
● The income tax allowance will be increased from EUR 170 to 500 per month in 2018 and decreased gradually with the income level for those earning more than EUR 1 200.
● Increases in excise duty rates on alcohol and gas will strengthen incentives to reduce alcohol consumption and achieve energy savings.
● The tax rate on distributed dividends will be cut from the current 20% to 14% for mature companies (companies that pay dividends for three consecutive years). While this is expected to increase revenue in the short term by encouraging the companies to distribute profits, it will decrease it in the longer term.
Table 3. Budgetary and fiscal reforms planned for 2018-20
% of GDP 2018 2019 2020
Increase in spending 1.5 1.6 1.4
Education 0.3 0.5 0.5
Public investment 0.5 0.5 0.3
Increase in revenues 1.0 1.1 1.1
Personal income tax reform -0.6 -0.5 -0.5 Corporate income tax reform 0.6 0.4 0.2 Excise duty and VAT measures 0.5 0.1 0.2
Total impact on public deficit -0.5 -0.5 -0.3
fiscal policy. The current fiscal rule imposes a balanced budget in structural terms, but past surpluses can be used to allow a deficit of not more than 0.5% of GDP. Indeed, these will be used in 2018-20.
Beyond 2020, financing growth-enhancing measures could require revising the fiscal rule. Maintaining a small structural deficit for an extended period would not undermine the long-term sustainability of public finances. For instance, a persistent deficit of 0.5% of GDP would result in debt reaching less than 11% of GDP in 2030 (Figure 13). In the same vein, increasing the deficit by 1% of GDP would still maintain a prudent debt level, even if coupled with 1 percentage point lower inflation and GDP growth (Figure 13).
According to long-term projections, and despite a rapid decline in its working-age population, Estonia does not face particular ageing-related spending pressures (European Commission, 2016b). However, this is mainly because replacement rates in the public pension system are projected to decline and remain among the lowest in the EU (25% by 2060). Poverty risks for pensioners with a short contribution history, notably to the second pillar, and/or with low remuneration are already relatively high by international standards. To address this issue, a reform of the public pension system that increases redistribution among pensioners and raises the pensions of low income earners is being prepared. Measures to reduce fees and improve competition in the second pension pillar have also been taken. These measures are welcome, but their effects will materialise only in the long run. Fiscal space could be used to speed up the increase in pension levels at the lower end of the income distribution.
The tax mix could be made more favourable to long-term growth prospects. Taxes on immovable property – estimated to be the least distortionary of taxes (Johansson et al., 2008) – are particularly low by international standards (Figure 14). Extending the tax base to
Figure 13. Fiscal space is large
Illustrative public debt paths, General government debt, Maastricht definition, as a percentage of GDP1
1. The baseline consists of projections for the Economic Outlook No. 101 until 2018. Thereafter, assumptions are: real GDP growth progressively closing the output gap and from 2020 growing by 2.5% in line with OECD estimates for long-term potential growth; a budget balanced in structural terms from 2021 as set out in the national reform programme; inflation declining progressively to 2% by 2030 and an average effective interest rate converging to 3% by 2030. The “0.5% of GDP higher deficit” scenario assumes a structural deficit maintained at 0.5% of GDP from 2021. The “1% of GDP higher deficit” scenario assumes a structural deficit increasing to 1% of GDP from 2021. The “lower inflation, lower GDP growth and higher deficit” scenario assumes lower inflation and real GDP growth by 1 percentage point per year, both from 2019 with structural deficit increased by 1% of GDP from 2021.
Source: OECD Economic Outlook 101 Database; calculations based on OECD (2017),OECD Economic Outlook: Statistics and Projections(database), June.
1 2 http://dx.doi.org/10.1787/888933581182
0 5 10 15 20 25 30
0 5 10 15 20 25 30
2007 2009 2011 2013 2015 2017 2019 2021 2023 2025 2027 2029 Baseline
1% of GDP higher deficit 0.5% of GDP higher deficit
residential property and using market values for the tax base would raise revenue from this source significantly. Environmental taxes already account for a relatively large share of tax revenues, but increases in energy, pollution and transport tax rates would better price these activities’ negative impacts on the environment. As stressed in previousEconomic Surveys, energy tax rates should be increased and exemptions and reduced rates should be eliminated (OECD, 2015 and Table 4).
Strengthening public support to reduce poverty
The government plans important redistributive measures. Reform of the personal income tax, to take effect as of 2018, is expected to improve its progressivity and reduce poverty by 0.7 percentage point. The income tax allowance will be raised and decrease gradually with the income level, thereby increasing the disposable income of 80% of households and reducing some disincentives to work generated by threshold effects in the previous system. After the planned reform, the tax wedge will fall below the OECD average
Figure 14. Taxes on immovable property are among the lowest in the OECD
Recurrent taxes on immovable property as a per cent of total taxation, 2015 or latest available year
Source: OECD Revenue Statistics Database.
1 2 http://dx.doi.org/10.1787/888933581201
0
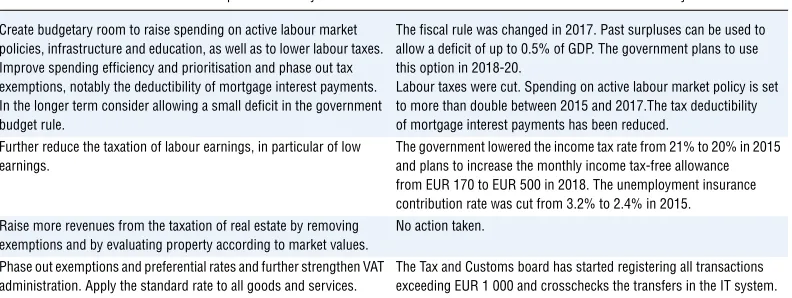
Table 4. Past recommendations for improving fiscal policy
Main recommendations from previousSurveys Action taken since the 2015Survey
Create budgetary room to raise spending on active labour market policies, infrastructure and education, as well as to lower labour taxes. Improve spending efficiency and prioritisation and phase out tax exemptions, notably the deductibility of mortgage interest payments. In the longer term consider allowing a small deficit in the government budget rule.
The fiscal rule was changed in 2017. Past surpluses can be used to allow a deficit of up to 0.5% of GDP. The government plans to use this option in 2018-20.
Labour taxes were cut. Spending on active labour market policy is set to more than double between 2015 and 2017.The tax deductibility of mortgage interest payments has been reduced.
Further reduce the taxation of labour earnings, in particular of low earnings.
The government lowered the income tax rate from 21% to 20% in 2015 and plans to increase the monthly income tax-free allowance from EUR 170 to EUR 500 in 2018. The unemployment insurance contribution rate was cut from 3.2% to 2.4% in 2015. Raise more revenues from the taxation of real estate by removing
exemptions and by evaluating property according to market values.
No action taken.
Phase out exemptions and preferential rates and further strengthen VAT administration. Apply the standard rate to all goods and services.
(Figure 15). However, as the lowest income earners (up to EUR 170 per month) do not pay income tax now, this measure will not help them. Moreover, the reform will replace a better targeted means-tested tax credit introduced in 2016, which was conditioned to work intensity, and is likely to increase marginal tax rates for medium wage earners.
The benefit for large families (which have the highest poverty risk) is set to increase to EUR 300 per month, at a cost of 0.1% of GDP. This measure would be more cost-effective if targeted on the poorest. The Work Ability reform to increase the participation of people with reduced work capacity in the job market can in principle also contribute to fighting poverty. However, its impact might be limited in the medium run, because employers’ willingness to hire persons with disabilities appears to be low (National Audit Office, 2017). Active labour market policies have been stepped up to improve the employability of jobseekers and increase incentives for hiring disabled people, but their success will rely on the provision of adequate financial and human resources, which is not currently guaranteed in all municipalities (National Audit Office, 2017). Finally, if approved by parliament, proposed changes to the public pension system could also mitigate inequality among pensioners and reduce old-age poverty, but would require several years to take effect.
There is room to make social support more effective at reducing poverty. Despite the high level of relative poverty, the level of spending allocated to protection of the most vulnerable is low: around 31% of total public spending in 2014 went on social spending, some 9 percentage points less than the EU average. A relative large share of spending is directed to family benefits, while expenditure on social exclusion lags behind (Table 5). At the same time, the impact of transfers and taxes on inequality is among the lowest in the OECD (see Figure 3, Panel B). The social safety net does not provide adequate support to those who most need it. Despite a significant increase in 2016, the level of social assistance has not stepped up to a level that would minimise the risk of poverty. The subsistence benefit stood at around 20% of the median equivalised income in 2016.
The targeting of social programmes is poor, with means-tested measures accounting for a low share in total social spending. In addition, estimates of take-up rates for social
Figure 15. High taxes on low wage earners are set to decrease
Labour tax wedge, % of total labour compensation, single person at 67% of average earnings without children, 2016
Note:The black bar shows the impact on the tax wedge of the reform of the personal income tax planned for 2018. Source:OECD Tax Statistics and OECD Secretariat calculations.
1 2 http://dx.doi.org/10.1787/888933581220
0
assistance benefits are relatively low (Võrk et al., 2016). All this calls for streamlining the existing benefit schemes and ensuring that transfers go to those most in need. This should be done by increasing the rate of subsistence benefits further. Because increasing benefit generosity might lower job take-up rates for low-wage earners, reforms should aim at maintaining strong work incentives and maximising the prospects of re-integrating beneficiaries into employment. To do so, social benefits should be withdrawn only gradually when the recipient takes up a job, or in-work benefits should be introduced, as is the case in a number of OECD countries.
To ensure that all benefit from opportunities created by globalisation and Estonia’s high trade intensity, those who can work need to have the right skills and incentives to get good jobs. International experience suggests that the best way to support jobseekers is through a combination of temporary income support, job search support and measures to improve their employability (OECD, 2016d). While all unemployed have access to the public employment service and activation programmes, in practice only a few participate. Participation in and spending on active labour market policies is modest. The coverage of the unemployment benefit system is low, with only half of the registered unemployed receiving benefits. Improving the coverage can make the unemployed more readily reachable for upskilling programmes availableviathe Unemployment Insurance Fund.
Improving health coverage
Low health status is one of the weaknesses identified by the OECD Better Life Index (see Figure 2). Significant discrepancies in life expectancy by education level and socio-economic background suggest a high level of inequality in access to health care, although they also reflect a number of other factors (Figure 16). Regional disparities persist in exposure to environmental health risks: residents of Ida-Viru County register worse health indicators than residents of other regions (OECD, 2017a). About 6% of the population was not covered by the Estonian Health Insurance Fund in 2016. Some health services are provided in municipalities to uninsured people, and the coverage of health insurance, which now includes dental care, has recently been extended.
Out-of-pocket payments are 19% of total health care spending, above the EU average of 14%, which poses a barrier for those with low incomes. The promotion of generics and more generous reimbursement have stabilised out-of-pocket payments for pharmaceuticals. Further effort to reduce out-of-pocket payments for low-income households could be made, as recommended in the 2012Economic Survey, by increasing and means testing the cap on out-of-pocket payments on prescribed pharmaceuticals (Table 6).
Table 5. Breakdown of social spending
% of total social protection spending, 2015
Sickness
and disability Old age Survivors
Family
and children Unemployment Housing
Social
exclusion Other Estonia 16.4 54.5 0.5 17.9 8.3 0.2 1.0 1.2 CEE1 18.4 55.9 6.0 9.3 3.1 0.8 3.7 2.7
Nordics2 18.4 46.3 1.5 14.6 9.4 2.1 6.0 1.6 OECD3 15.8 51.3 6.3 11.2 7.4 2.3 3.9 1.9
1. Unweighted average of Czech Republic, Hungary, Latvia, Lithuania, Poland, Slovak Republic, and Slovenia. 2. Unweighted average of Denmark, Finland, Sweden.
Prevention plans for risk factors (alcohol consumption, smoking, obesity) are being implemented, but spending in this area remains well below the OECD average and should be increased (De Maeseneer, 2016). Indeed, a relatively high proportion of the population smokes regularly, and alcohol consumption is among the highest in the OECD. As in other OECD countries, obesity rates have increased fast. Introducing taxes to limit health-damaging behaviour, as envisaged by the government with a tax on sugar-sweetened beverages, should be considered as it can improve health outcomes (Sassi et al., 2013). In addition, more needs to be done to reduce the number of occupational accidents, which increased by 68% between 2009 and 2016. A considerably higher proportion of Estonian workers, especially among the low skilled, are exposed to physical health risks than in, for instance, the Czech Republic, Slovakia or Finland (see Figure 16).
According to the Labour Inspectorate, there lack incentives for employers to meet the requirements for work environments and to improve their quality (National Audit Office, 2017). Well-developed occupational health and safety regulations have contributed to a decline in work accidents in most OECD countries (OECD, 2010a). In Estonia, enforcement of
Figure 16. Health outcomes vary strongly with socio-economic background
Source: OECD Social and Welfare Statistics Database; OECD Job quality indicators Database.
1 2 http://dx.doi.org/10.1787/888933581239
0 % pts Difference between rich and poor, 15 years old and over, 2015A. Share of population reporting good health
0
CZE EST FIN SVK CZE EST FIN SVK CZE EST FIN SVK
High skilled Medium skilled Low skilled
B. Workers exposed to physical health risk factors
health and security regulation should be strengthened, for instance by increasing the level of fines imposed for breaches of the regulations from current low levels (OECD, 2010b). An occupational accident and disease insurance system that would strengthen the liability of employers and thereby incentives for investment in health and work safety has been on the policy agenda of many past governments. It should be introduced and include experience rating of firms (i.e. basing insurance cost on amount and/or number of claims made in previous years) that, be it part of public or private scheme, has brought positive results for instance in the Netherlands, Finland and Belgium (OECD, 2010b; European Agency for Safety and Health at Work, 2017).
Making education more inclusive
Estonia outperformed the rest of Europe in the OECD’s latest PISA survey. In 2015, Estonia achieved high levels of both performance and equity in education. Coverage of pre-primary education and tertiary education attainment are high. At the secondary level, performance of students in reading, mathematics and science is among the best, and students’ socio-economic background has a smaller impact on performance than in other OECD countries. But there is still some room to make the education system more inclusive. A recent OECD review identifies policy priorities to improve equity in the Estonian school system, including targeting extra resources on students with special education needs and Russian-speaking students, notably by addressing shortages of Estonian language teachers in Russian schools (Santiago et al., 2016). These resources could be drawn from a further consolidation of the school network.
Integration of the Russian-speaking minority in the labour market remains a challenge, in particular in eastern regions of the country where redundancies in the chemical and oil shale industries further deepened the unemployment gap in 2016. The unemployment rate of the Russian-speaking minority (around 25% of total population), was 3 percentage points higher than that of other Estonians. While this is party linked to regional economic disparities, a whole-of-government approach is needed to tackle the multidimensional obstacles encountered by this minority, including limited Estonian language skills, choices regarding education, and weaker social contacts and networks. Particular attention should be paid to Estonian and English proficiency, which are found to improve labour market outcomes but are poor among Russian speakers (Ministry of Education and Research, 2015).
Table 6. Past recommendations for reducing poverty
Main recommendations from previousSurveys Action taken since the 2015Survey
Increase spending on active labour market policy, and better target spending, while ensuring stronger co-operation among local governments, education institutions and the Unemployment Insurance Fund.
Spending on active labour market policy is set to more than double between 2015 and 2017 due to the implementation of the Work Ability reform and the introduction of preventive measures for workers at risk of unemployment.
Refocus the social protection system on activation and return to work, underpinned by stronger inter-agency co-operation. All working-age people with some capacity to work should become clients of unemployment insurance fund offices and be encouraged to participate in job search and activation.
A reform of disability benefits, the Work Ability reform, is being implemented, strengthening the assessment of capacity to work and tying the receipt of benefits to the obligation to participate in activation programmes.
Target benefits to provide sufficient help for those in greatest need. No action taken. Strengthen health spending efficiency, promote healthy lifestyles
and improve access for disadvantaged groups.
The Strategy of Integration and Social Cohesion in Estonia 2020 includes a number of measures and measurable targets, but little progress has been achieved since 2011 (Ministry of Education and Research, 2016).
Addressing gender gaps
Estonian women have high employment rates and outperform men in the education system. However, Estonia has both the second highest gender pay gap in the OECD (Figure 17) and relatively low employment among mothers with children under 3 (24% in 2014). The gender employment gap for parents is large, while it is close to zero for childless women and men (OECD, 2017b). In addition, management and supervisory positions are overwhelmingly held by men. Differences in education and occupations explain only a minor part of the pay gap (Anspal, 2015). Meanwhile, gender stereotypes are prevalent (Figure 18).
The Welfare Development Plan for 2016-2023 sets targets to counter gender inequality, and policy measures including allowing the Labour Inspectorate to monitor the equality of pay and carry out audits on firms suspected of gender discrimination are under discussion. Measures for pay transparency, which require companies to carry out analyses of gender wage gaps and share them with employees, government auditors or the public, could be implemented as is done in several OECD countries (including Sweden, Germany, Lithuania and Austria). In Iceland, one of the OECD’s top performers in terms of gender equality, companies with 25 or more employees are required to disclose the gender composition of both general and management staff and to develop a certification scheme for gender pay equality, to ensure that all jobs of equal value are paid the same. Other strategies include the introduction of pay-gap calculators, publicly available online, to help employees to estimate what salary they should receive for a given job, sector and locality, as is done in the Czech Republic.
Figure 17. The gender pay gap is high
Full-time employees, 2015 or latest year available1
Note:The gender wage gap is defined as the difference between male and female median wages divided by the male median wage. 1. Data refer to 2016 for Czech Republic, Korea, United Kingdom and United States, 2014 for Belgium, Estonia, France, Germany, Greece,
Iceland, Italy, Latvia, Lithuania, Luxembourg, Netherlands, New Zealand, Poland, Portugal, Slovenia, Spain, Switzerland and Turkey, 2013 for Sweden, 2011 for Israel
Source: OECD Employment Database.
1 2 http://dx.doi.org/10.1787/888933581258
The parental leave system is also being revised. Estonia has the longest parental leave in the OECD (146 weeks vs. 37.5 weeks on average), but father-specific leave is very short (2 weeks). Long leaves can have a detrimental impact on careers, as skills can deteriorate and the costs to firms of vacancies can induce discrimination against women of childbearing age (Rossin-Slater, 2017; Thévenon and Solaz, 2013). Increasing the length of father-specific leave, as planned by the authorities, is not the most cost-effective way to achieve a better gender balance in childcare responsibilities. Introducing a “daddy quota” as in Sweden or France (whereby the length of the parental leave is reduced if the father does not take his leave) without increasing the total length of the parental leave would accelerate the return of mothers to the labour market at a lower cost.
Figure 18. Gender stereotypes are pronounced
1. Level of education: total tertiary education (ISCED 2011 levels 5 to 8). 2013 for OECD average. Source:EBRD (2016), Life in Transition: A decade of measuring transition; OECD Education Statistics.
1 2 http://dx.doi.org/10.1787/888933581277
0 10 20 30 40 50 60 70 80 90
Women are as competent as men to be business executives
It is important that my daughter achieves a university education
Men make better political leaders than women
A woman should do household chores even if her husband is not working
A. Attitude towards women
% of respondents who agreed with the statements below
Estonia
Share of female graduates at tertiary level of each field of education, 20141
The capacity of childcare services for children below 2 years old is being increased, as recommended in pastSurveys(OECD, 2015 and OECD, 2012). Participation of children aged 0-2 in pre-school education has increased significantly from 20% to 34% in 2016. With funding from the European Regional Fund around 2 300 childcare places will be created in larger cities and suburbs as well as in municipalities where needs are unmet (European Commission, 2017). Local governments will also be given more flexibility in organising the provision of high-quality early childhood education and care possibilities based on the needs of families.
Unleashing productive investment and export performance
Deepening participation in global trade
Trade and foreign direct investment can channel knowledge and innovation into the economy and thereby increase productivity. The economic performance of Estonian exporting firms is higher than their non-exporting counterparts, suggesting that deepening integration in global trade would contribute to reducing the currently high productivity gap with the OECD’s best performing countries. Higher productivity in exporting firms is due to both self-selection (i.e. more productive firms are the ones that tend to become exporters) and to productivity increases after the firms enter export markets (Wagner, 2012; Masso and Vahter, 2015; Benkovskis et al., 2017).
Estonia is already well integrated in global trade, and exports have been resilient (Figure 19, Panel A). On average around 12% of firms export, while in OECD countries less than 10% of firms are directly engaged in international trade (OECD, 2016b). Around a half of private-sector employment is sustained by foreign demand, twice as much as the OECD average. Nevertheless, low and medium value added goods and services dominate, and aggregate value added per worker remains modest, even if comparable to that of its peers (Figure 20). Gains in export market shares have been less than in its EU catch-up peers, to whom Estonian businesses may lose out, particularly in terms of price competitiveness (Figure 19, Panel B).
Figure 19. Export orientation and gains in export market shares are comparable to peers
1. Simple average of Czech Republic, Hungary, Latvia, Lithuania, Poland, Slovak Republic, and Slovenia.
2. Export performance is measured as actual growth in exports relative to the growth of the country’s export market. Source: OECD Economic Outlook 101 Database(updated with information available on 1 September 2017).
1 2 http://dx.doi.org/10.1787/888933581410
0 10 20 30 40 50 60 70 80 90 100
2005 2006 2007 2008 2009 2010 2011 2012 2013 2014 2015 2016
A. Exports of goods and services
% of GDP
Estonia OECD CEE average¹
90 100 110 120 130 140
2005 2006 2007 2008 2009 2010 2011 2012 2013 2014 2015 2016
B. Export performance for goods and services²
Volume, index 2005 = 100
Reducing regulatory barriers to investment and trade
Low corporate taxes combined with business and competition-friendly regulation compensate for Estonia’s small size, which might otherwise be a barrier for investment and productivity. The PMR and FDI Regulatory Restrictiveness Index indicators, which respectively measure the restrictiveness of product market regulation and the statutory restrictions on foreign direct investment, are well below the OECD average (Figure 21). Political willingness to continuously improve business conditions is strong, and several initiatives target reducing red tape: a ‘zero bureaucracy’ programme, the introduction of a business account for micro-entrepreneurs and an e-residency programme. Measures aiming at restricting tax-free transfers of profits distributed abroad in the form of long-term loans are welcome. The planned reduction of the taxation of distributed dividends for mature companies (from 20% to 14% for companies that pay dividends for three consecutive years) is unlikely to have any positive impact on investment by domestic firms, because reinvested profits are not taxed. Furthermore, it will add complexity to the tax system and penalise young firms.
Business conditions could be improved further through easing remaining unnecessary entry barriers in services (such as exclusive rights for engineers, architects, accountants and lawyers, as recommended in the 2015Economic Survey) and revising environmental regulation to reduce the administrative burden on small firms (OECD, 2017a). Alignment with best international practice for trade facilitation would reduce the administrative and information costs of trade. These include completing the one-stop shop for formalities (i.e. the Single Window) and improving co-operation between agencies involved in trade activities (e.g. customs, border control). Increasing regulatory certainty by making more use of advance rulings (i.e. binding statements by the administration on regulatory rules applied to specific goods) and making information about agreements with third countries, appeal procedures, and penalty provisions more accessible would also help.
Figure 20. Value added per worker embodied in foreign demand is low
Value added embodied in foreign final demand per worker
Note:Value added embodied in foreign final demand per worker is computed by dividing the domestic value added captured from foreign final demand by the number of employees sustained by foreign final demand. Figure refers to 2011 data.
Source:OECD/WTO (2016), Statistics on Trade in Value Added (database) and OECD (2016), “Trade in Employment: Core Indicators” in OECD Structural Analysis (STAN) Databases.
1 2 http://dx.doi.org/10.1787/888933581296
An efficient insolvency framework is key to supporting investment and avoiding capital becoming trapped in low-productivity firms. Bankruptcy laws that do not overly penalise business failure are likely to support capital spending in risky but innovative companies, though excessively low creditor protection could undermine credit supply. The high cost of closing a business in Estonia may reduce incentives to invest and raise the cost of credit. Bankruptcy procedures are long, and the recovery of creditor claims is low (Figure 22). A new OECD indicator on insolvency regimes shows that Estonia has ample room for improvement in terms of the framework and outcomes of corporate insolvency proceedings (Figure 23). The Ministry of Justice’s current review of the legislative framework, whose outcomes should be available in autumn 2017, is thus very welcome.
Avenues to improve the insolvency regime include giving creditors the right to initiate restructuring (rather than liquidation alone) as it increases either recovery rates or the chances of the company’s survival (Adalet McGowan and Andrews, 2016). Early-warning mechanisms, such as on-line self-assessments, and pre-insolvency regimes permitting swifter out-of-court settlement could also be introduced. Additionally, the length of the stay
Figure 21. The business environment is favourable
Source:OECD (2013),Product Market Regulation Database;OECD FDI Regulatory Restrictiveness Index Database.
1 2 http://dx.doi.org/10.1787/888933581980
0.0
A. Product Market Regulation, overall indicator, index scale of 0-6 from least to most restrictive, 2013
0.00
Figure 22. Credit recovery is low
Average recovery rate1
1. The recovery rate is calculated based on the time, cost and outcome of insolvency proceedings involving domestic legal entities and is recorded as cents on the dollar recovered by secured creditors. The calculation takes into account the outcome: whether the business emerges from the proceedings as a going concern or the assets are sold piecemeal. Then the costs of the proceedings are deducted. Finally, the value lost as a result of the time the money remains tied up in insolvency proceedings is taken into account. The recovery rate is the present value of the remaining proceeds, based on end-2015 lending rates.
Source:World Bank, Doing Business 2017.
1 2 http://dx.doi.org/10.1787/888933581999
Figure 23. The insolvency regime is inefficient
OECD indicator of insolvency regimes,12016
1. A higher value corresponds to an insolvency regime that is most likely to delay the initiation of and increase the length of insolvency proceedings. Composite indicator based on 13 components: time to discharge; exemption of assets; early warning mechanisms; pre-insolvency regimes; special pre-insolvency procedures for SMEs; creditor ability to initiate restructuring; availability and length of a stay on assets; possibility and priority of new financing; possibility to “cram-down” on dissenting creditors and dismissal of management during restructuring; degree of involvement of courts; distinction between honest and fraudulent entrepreneurs and the rights of employees. For more details, see Source
Source: Adalet McGowan, M., D. Andrews and V. Millot (2017), “Insolvency Regimes, Zombie Firms and Capital Reallocation”,OECD Economics Department Working Papers, No. 1399; and Adalet McGowan, M. and D. Andrews (2017), “The Design of Insolvency Regimes”,OECD Economics Department Working Papers, forthcoming.
1 2 http://dx.doi.org/10.1787/888933582018
on assets (i.e. the period in insolvency during which creditors cannot continue debt collection, thereby allowing for restructuring of the business) tends to delay the resolution of financial distress and should be limited as in some other OECD countries, including Germany, Ireland and the United Kingdom. Finally, to encourage capital injections required to facilitate the reorganisation of firms, international best practice suggests that new financing should have priority over unsecured creditors (Adalet McGowan et al., 2017).
Addressing skill shortages
Labour market tensions and recruitment difficulties can undermine capital spending and impact investment decisions, especially for international companies. With Estonia’s populating ageing, its working-age population is declining. Moreover, labour shortages have already materialised, in particular in managerial, specialised education, legal professional, health care and ICT (Information and Communication Technology) (EU Skills Panorama, 2014). Businesses’ difficulty to recruit an adequate skilled workforce is one of the main barriers for long-term investment (see Figure 8).
Make the labour market more inclusive and attractive
Estonia already has high participation and employment rates (Figure 24), but there are exploitable avenues to improve labour market performance, including reducing the gender participation gap. Combining reform of parental leave with better provision of childcare services would foster participation and upskilling of young mothers. Current efforts to rehabilitate individuals with partial ability to work and to reduce early retirement go in the right direction but are unlikely to have a major impact on employment or the integration of the disabled, given employer reluctance to offer jobs to those with reduced work capacity (National Audit Office, 2017).
Migration could also help to address skill shortages; it is also a means of knowledge transfer and of creating business links to foreign markets. Emigration has been significant in the past, but return migration rose in 2015/2016, reflecting at least in part deterioration of economic prospects in Finland and Russia and Estonia’s strong labour market. Still, immigration from non-EU countries is low (Figure 25). Excluding returning Estonians, only 2 800 immigrants (0.23% of the population and half of total migratory flows) arrived annually during 2005-13. Under a third of these were labour migrants, and only a quarter of the adult immigrants had higher education (National Audit Office, 2015).
Figure 24. Employment and participation rates are high
Percentage of population aged 15-64, 2016
Source: OECD Employment Outlook 2017.
1 2 http://dx.doi.org/10.1787/888933581315
Figure 25. Labour migration is modest
Source:Eurostat, Demography and migration database.
1 2 http://dx.doi.org/10.1787/888933581638
0
A. Labour force participation rate, %
0
B. Employment rate, %
0.0
A. First permits granted
2015, % of population
Remunerated activities reasons
2010 2011 2012 2013 2014 2015
B. Reasons for immigration
First permits granted, % of total