Gadjah Mada International Journal of Business
Vol. 18, No. 3 (September-December 2016): 285-300
Using Means-end Chain Analysis to Reveal Consumers’
Motivation for Buying Local Foods: An Exploratory Study
Poppy Arsil,
12*Elton Li,
1and
Johan Bruwer
31) School of Agriculture Food and Wine, University of Adelaide, Australia
2) Department of Agricultural Technology, Universitas Jenderal Soedirman, Purwokerto, Indonesia
3) School of Marketing, University of South Australia
Abstract: This article utilizes and discusses specific aspects of Means-End Chain (MEC) analysis for understanding the motives of Indonesian consumers when they purchase local food. The MEC theory is used as a measure of the attributes, consequences, and values of locally produced products, involving specific aspects of this theory, namely the laddering methods of administration, the content analysis procedure, and constructing and interpreting a Hierarchy Value Map (HVM). The results of the study indicate that the MEC approach is a powerful method to reveal consumers’ motivation for buying local foods, when associated with the various cultural groupings identified by the study, particular between the Javanese and non-Javanese consumers. This study offers a practical implication and source of knowledge for other future studies and policies in terms of: (a) A new approach for understanding the motives behind the purchase of local foods by Indonesian consumers, and (b) developing new categories of attributes, consequences and values for local food.
Abstrak:Penelitian ini menggunakan dan membahas berbagai aspek khusus analisis Means-End Chain (MEC) untuk memahami motif konsumen Indonesia ketika membeli makanan lokal. Teori MEC digunakan untuk mengukur berbagai atribut, konsekuensi dan nilai produk lokal, termasuk aspek-aspek khusus teori ini yang dikenal dengan metoda adminstrasi berjenjang, prosedur analisis isi, dan Hierarchy Value Map (HVM). Hasil studi mengindikasikan pendekatan MEC adalah metode yang bagus untuk mengungkapkan hubungan motivasi konsumen dalam membeli makanan lokal berdasarkan kelompok budaya, terutama antara konsumen Jawa dan non-Jawa. Studi ini diharapkan dapat memberikan implikasi praktis dan sumber pengetahuan untuk studi mendatang dalam hal penggunaan metode baru untuk memahami motivasi pembelian makan lokal oleh konsumen Indonesia dan pengembangan kategori-kategori baru berbagai atribut, konsekuensi dan nilai makanan lokal.
Keywords:consumer motivation; Indonesia; Javanese; local food; means-end chain
Introduction
The Means End Chain (MEC) theory describes the consumers’ knowledge of a product, then relates the attributes of that product, the consequences of its use, and personal values and represents all this in a hierarchical cognitive structure (Gutman 1984). This approach has frequently been applied to understand perceptions about, and why, consumers choose specific food prod-ucts including beverages, different methods of farming (local and organic foods, and ge-netically modified products) and different kinds of foods (pork and vegetables) (Gutman 1984; Gengler et al. 1999; Naspetti and Zanoli 2009; Hall and Lockshin 2000; Bredahl 1999; Grunert et al. 2001; Makatouni 2002; Urala and Lähteenmäki 2003; Fotopoulos et al. 2003; Baker et al. 2004; Roininen et al. 2006; Lind 2007; Krystallis et al. 2008; Barrena and Sanchez 2010; Kirchhoff et al. 2011; Arsil et al. 2014b). MECs have also been identified as a useful method to reveal the drivers of consumers’ food choices in the United States, many European countries including the United Kingdom, Denmark, Sweden, Belgium, Fin-land, Greece, Spain, and in Australia (Gutman 1984; Gengler et al. 1995; Bech-Larsen et al. 1996; Fotopoulos et al. 2003; Padel and Fos-ter 2005; Bonne and Verbeke 2006; Roininen et al. 2006; Grantham 2007; Lind 2007; Krystallis et al. 2008; Barrena and Sanchez 2010; Kirchhoff et al. 2011). This method is also used to compare the motivation for food choices between groups of consumers in different countries, and throughout many European countries (Grunert 1997; Bredahl 1999; Valette-Florence et al. 2000; Grunert et al. 2001; Baker et al. 2004; Naspetti and Zanoli 2009).
According to Reynolds and Gutman (1988), a specific product is chosen by con-sumers because they believe that they could achieve a desired value through the conse-quences provided by the attributes of the product. MEC theory relates to the attributes (A) and links sequentially to the consequences (C) that derive their importance from the use of the product by satisfying personal values (V), producing an A-C-V sequence and form-ing a so-called ‘ladder.’ A Hierarchical Value Map (HVM) is the name given to the graph that is formed from the various ‘ladders,’ representing the aggregate connections of A, C and V (Reynolds and Gutman 1988). How-ever, some barriers were found that preclude MEC’s use, including it being time-consum-ing, it requires expensive interviews, and arti-ficial sets of answers and researchers’ biases that demand a high level of expertise from the interviewers (Veludo-de-Oliveira et al. 2006). MEC theory has previously and ex-clusively only been applied in developing countries. As a result, there is little discus-sion about whether the backgrounds and sub-jects from developing countries affect the usefulness of the MEC’s procedure. It is pos-sible that social, personal and cultural back-grounds may seriously influence the outcome of the MEC’s approach. Therefore, the first aim of this study is to utilize the MEC’s ap-proach to understand the motives behind the purchase of local food by Indonesian con-sumers.
1995; Reynolds and Gutman 1988), or ana-lyzing, interpreting and presenting the MEC theory (Aurifeille and Valette-Florence 1995; Botschen and Hemetsberger 1998; Gengler et al. 1995; Gutman 1982; Vriens and Hofstede 2000; Leppard et al. 2004; Valette-FIorence and Rapacchi 1991; van Rekom and Wierenga 2007), graphic representations (Gengler et al. 1995), and reviews of the MEC theory (Leppard et al. 2004):
But there is no agreement among researchers as to the way MEC’s observations should be ana-lyzed.
The wide application of the MEC theory involves several ways of analyzing, interpret-ing and presentinterpret-ing the results of ladderinterpret-ing data. Therefore, the aim of this paper is to discuss laddering, content analysis, and the interpretation of the HVM that underlies the MEC theory for understanding the motives of Indonesian consumers who purchase lo-cal food.
Indonesia, the subject in this study, is an archipelago of many islands and a multi-ethnic society that consists of approximately 300 ethnic/sub-ethnic groups. The Javanese group is the largest ethnic group in Indonesia and made up 41 percent of Indonesia’s popu-lation in 2000. They are concentrated on the island of Java, but millions of them have also migrated throughout Indonesia. Moreover, around 60 percent of Indonesian people live on Java, making it the most heavily populated island in the world (Suryadinata et al. 2003). Although Indonesia is the fourth most popu-lous country in the word, it has a great diver-sity of ethnic groups with different personal, social and economic backgrounds, when com-pared to most developed countries, but knowl-edge of Indonesian consumers’ behavior to-ward their local foods is very limited. There-fore, the aim of this study is to apply the MEC
approach to understand the motives behind purchasing local foodstuffs between two dif-ferent groups of consumers: the Javanese and the non-Javanese.
Literature Review
Laddering Methods of
Administration
Laddering has been named as a tech-nique highlighting a series of guidelines to be followed during the primary data collec-tion through interviews in the context of the MEC theory (Phillips and Reynolds 2009; Reynolds and Gutman 1988). Reynold and Gutman (1988, p.12) stated Laddering refers to an in-depth, one-on-one interview tech-nique used to develop an understanding of how consumers translate the attributes of products into meaningful associations with respect to themselves, following the means-end theory.
Table 1. The Advantages and Challenges of the Soft and Hard Laddering Methods of Administration Linked to the MEC Theory
Type of Laddering Advantages and Challenges Soft Laddering Advantages
More linkages were produced between the levels of abstraction (Russell et al. 2004a, p. 545). Would uncover a complex pictorial representation of how consumers perceived and linked the A-C-V (Russell et al. 2004a). Produced higher frequency of attributes and consequences (Botschen and Hemetsberger 1998)
Challenges
Requires highly skilled and expert interviewers, time consuming, expen-sive interviews (Hofstede et al. 1988; Veludo-de-Oliveira 2006), artifi-cial sets of answers, simplistic analysis of the results (Veludo-de-Oliveira 2006) and researchers’ bias (Veludo-de-Oliveira 2006, Botsschen et al. 1999)
Hard laddering Advantages
Produced more ladders (Grunert and Grunert 1995), efficiency in data collection (quicker and cheaper) (Grunert and Grunert 1995; Botsschen et al. 1999), suitable for investigating the strong links within the linkages (Russell et al. 2004b), and minimize researchers’ influence (Grunert and Grunert 1995; Veludo-de-Oliveira 2006)
Challenges
The consistency of the codings’ interpretation among the respondents was questionable. There is a possible effect of bias for the abstract con-cepts and cross-cultural applications. There is the potential of missing levels of abstraction since only the specific coding is provided to the respondent to be selected. Since laddering is a recall recognition task, this technique might result in fatigue and boredom (Reynolds 2006). (based on pen and
paper)
(based on computer or paper-and pencil)
C, V in a given ladder, and that no levels of abstraction are out of sequence or missed. The last assumption was that an appropriate concept code should be developed that would accurately reflect the level of mean-ing involved.
There have been two laddering meth-ods of administration that have commonly been used by researchers in several MEC studies published in scholarly journals, namely the ‘soft’ and ‘hard’ laddering
conse-quences of the product’s use, and end in the values. When written questionnaires are used to obtain information from respondents, it is called ‘hard’ laddering. The information ob-tained could be based on pencil-and-paper or computerised questionnaires, and is an alter-native method for uncovering the level of abstraction in the context of the MEC’s ap-proach (Reynolds and Gutman 1988; Russell et al. 2004b). The advantages and challenges of the ‘hard’ and ‘soft’ laddering methods of administration are shown in Table 1. The application of the laddering method of ad-ministration has varied between researchers. Philip and Reynolds (2009, p.85) stated.
This is a particular concern because, as with pre-coded and open-ended survey ques-tions, it is possible that ‘hard’ and ‘soft’ laddering approaches will yield different re-sults, and researchers using different ap-proaches may not draw the same conclusions when investigating a similar research ques-tion.
The complexity, as well as the level of involvement with the product, are important factors to be considered when choosing the method of administration with respect to laddering (Grunert and Grunert 1995; Russell et al. 2004b). In this study, a routine and ha-bitual activity, namely ‘the motives of Indo-nesian consumers to purchase local food,’ is selected since this research study emphasizes the application of the MEC theory with re-spect to consumers from a developing country’s background. Food purchasing is a habitual and routine activity, but with the increasing encroachment of processed foods through mass retailers such as supermarkets, the attributes of locally grown products are sufficient to explore.
Content Analysis
Content analysis has been argued to be a scientific analysis that systematically evalu-ates all forms of communication messages (Kolbe and Burnett 1991). A guide to the methodological benchmarks for research into consumers’ behavior is offered by Kassarjian (1977). According to Reynolds and Gutman (1988), the first step in content analysis is to code the recording of the complete interview with the respondents and then to develop a set of master codes that represent the levels of hierarchy. Subsequently, an individual summary code for each respondent can be developed. Very broad coding in the content analysis procedure means that too much mean-ing can be lost. Re-readmean-ing and extensive dis-cussions is one way of dealing with this prob-lem.
are related to the personal views of the con-sumers (Prescott et al. 2002). This concept provides an understanding of the actions and behavior of consumers. In the means-end chain, the ‘terminal’ value has a dominant role in the consumers’ motivation for their purchasing decisions (Vriens and Hofstede 2000). The personal values emerge if con-sumers are able to link the attributes that the products have with positive consequences, and lead to the attainment of the desired val-ues. The stronger the A-C-V link is, as iden-tified by the consumers, means that they are highly involved and comply with a means-end association (Gengler et al. 1995).
Generating a Hierarchy Value
Map (HVM)
HVM has been the popular approach for analyzing laddering data (Reynolds and Gutman 1988). Once all the individual ma-trixes have been finalized, the numbers of direct and indirect relationship are assigned to a summary implication matrix. The impli-cation matrix displays the number of occa-sions on which each element in a given row leads to each other element in a square ma-trix, usually between 30 to 50 codes (Reynolds and Gutman 1988). The direct re-lationships are ‘implicative rere-lationships among adjacent elements’ (Reynolds and Gutman 1988, p.20), whereas the indirect relationships are ‘the connections among el-ements when there is another element be-tween them’ (Veludo-de-Oliveira et al. 2006, p. 634).
The output of a MEC study is a tree-like network diagram called a HVM, which is a graphical representation of the aggregate
map of cognitive structures (Reynolds and Gutman 1988). The hierarchical value map, formed from an aggregate matrix, is con-structed by connecting the chain and consid-ering the number of linkages among the ele-ments.
To construct a HVM requires the choice of the cut-off level. Reynold (2006, p.450) stated that:
This required choice of the cut-off level for this deterministic type of analysis is obviously quite problematic in the sense that the exact same set of laddering data can result in different HVM representations, depending upon the research analyst’s decision.
Reynold and Gutman (1988) suggest a cut off level of between 3 to 5 relations, typi-cally involving a cut of 4 relations from 50 respondents, and 125 ladders which would represent two thirds of the relationships among the elements. The type of relationship that mostly commonly represents the stan-dard basis on which to construct the hierar-chy is typically A-D, which is mapped as be-ing adjacent with a high number of direct re-lationships.
Interpretation of HVM
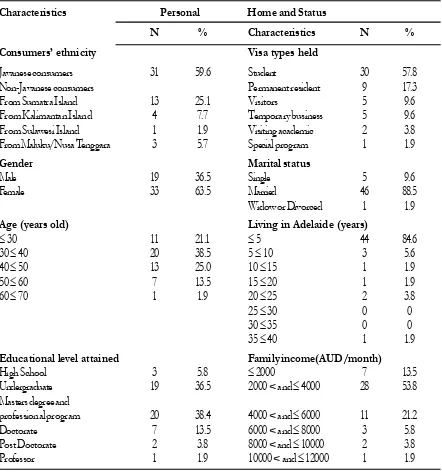
Table 2. Demographic Characteristics of Survey Respondents
Characteristics Personal Home and Status
N % Characteristics N %
Consumers’ ethnicity Visa types held
Javanese consumers 31 59.6 Student 30 57.8
Non-Javanese consumers Permanent resident 9 17.3
From Sumatra Island 13 25.1 Visitors 5 9.6
From Kalimantan Island 4 7.7 Temporary business 5 9.6
From Sulawesi Island 1 1.9 Visiting academic 2 3.8
From Maluku/Nusa Tenggara 3 5.7 Special program 1 1.9
Gender Marital status
Male 19 36.5 Single 5 9.6
Female 33 63.5 Married 46 88.5
Widow or Divorced 1 1.9
Age (years old) Living in Adelaide (years)
30 11 21.1 5 44 84.6
30 40 20 38.5 5 10 3 5.6
40 50 13 25.0 10 15 1 1.9
50 60 7 13.5 15 20 1 1.9
60 70 1 1.9 20 25 2 3.8
25 30 0 0
30 35 0 0
35 40 1 1.9
Educational level attained Family income(AUD/month)
High School 3 5.8 2000 7 13.5
Undergraduate 19 36.5 2000 < and 4000 28 53.8
Masters degree and
professional program 20 38.4 4000 < and 6000 11 21.2
Doctorate 7 13.5 6000 < and 8000 3 5.8
Post Doctorate 2 3.8 8000 < and 10000 2 3.8
Professor 1 1.9 10000 < and 12000 1 1.9
Methods
Sampling
Indonesia consists of hundreds of nic groups. The Javanese form the largest eth-nic group and comprise more than 40 per-cent of Indonesia’s population. Our partici-pants were 52 Indonesian consumers who
analyzed and interpreted, as well as the cat-egories of the attributes, consequences and values will all be valuable inputs to a bigger survey in Indonesia of Indonesian consum-ers of local food. The snowball technique was chosen to select respondents for practical rea-sons. They were selected based on two criti-cal characteristics, namely: (a) Food making deciders (the definition of ‘food decider’ re-fers to Schiffman and Kanuk 2010, p. 353) and (b) they were above 17 years old. These two characteristics are used to ensure that the respondents understood the topic that the interviewers addressed during the scheduled interviews. The meaning of ‘local’ as used in this study refers to Arsil et al. (2014a). The respondents were heterogeneous with respect to their ethnic groups, gender, age, marital status, educational level, visa type held, and how long they had been living in Adelaide, as shown in Table 2. Most of the respondents were female, of a mature age, with a high level of education, had lived for less than 5 years in Adelaide and had a family income of between 2,000 to 4,000 AUD per month. The interviews ranged in time from 45 minutes to 2 hours, and were held in a place selected by the respondents (at their home, in their office, at a cafe, or in the mall) during Octo-ber and NovemOcto-ber 2010. A souvenir costing 5 AUD was provided for each respondent, to thank them for their contribution to this study. A response rate of 93 percent was achieved.
MEC Procedures Employed
‘Soft’ laddering was chosen for use in this study, with a triadic sorting technique. The respondents were provided with a pic-ture of three sets of food products: Local, national and imported. Distinctions were elic-ited from the individual respondents based on meaningful differences between the sets of food products. Then laddering was
gener-ated by asking the question “Why is this ele-ment important for you?” All the interviews were recorded and transcribed. A series of codes for the attributes to the highest level of values was constructed using content analysis procedures (Kassarjian 1977; Reynolds and Gutman 1988). An implication matrix of all the pair-wise connections was obtained by using a cut-off level of four to allow only the most frequently chosen links to be included in the HVM, and then the HVM was created. The HVM was formed by the various ladders which represent the rela-tionships of all the attributes, consequences, and values related to the products. To deter-mine the perceptual presentations, the intrachain relationships would be summarized and evaluated (Gutman and Reynold (1988, page 23-25 for details). In this study, a net-work analysis approach was chosen for ana-lyzing and presenting the MEC’s data.
Results and Discussion
Laddering Method of
Administration
Russell et al. (2004b, p. 573) defined a ladder as “One’s participant sequence of re-sponses from attributes to a higher level of abstraction.” Ladders can then be constructed using several individual ladders to form a chain (Reynolds and Gutman, 1988). Laddering is commonly used to produce lad-ders.
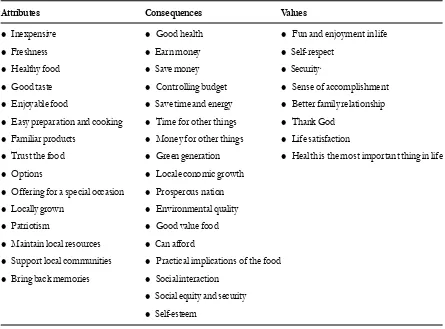
Table 3. The Attributes, Consequences, and Values Coding of Local Foods
Attributes Consequences Values
Inexpensive Good health Fun and enjoyment in life
Freshness Earn money Self-respect
Healthy food Save money Security·
Good taste Controlling budget Sense of accomplishment
Enjoyable food Save time and energy Better family relationship
Easy preparation and cooking Time for other things Thank God
Familiar products Money for other things Life satisfaction
Trust the food Green generation Health is the most important thing in life
Options Local economic growth
Offering for a special occasion Prosperous nation
Locally grown Environmental quality
Patriotism Good value food
Maintain local resources Can afford
Support local communities Practical implications of the food
Bring back memories Social interaction
Social equity and security
Self-esteem
laddering is employed in this study, since this method offers considerable consumer in-volvement and cognitive effort, in order to recall personally meaningful abstractions of the consumers. ‘Soft’ laddering is also an ap-propriate approach for a study that has little knowledge of the attributes, consequences and values.
Content Analysis
Interview transcripts are coded with an open coding procedure. The results of the content’s analysis using idiosyncratic concepts and a coding schedule produced 15 attributes, 17 consequences and 8 values terms (Table 3). Grunert and Grunert (1995) have argued that some of the bias in content analysis could arise from interference by the re-searcher during the coding process. The
pro-cedure of defining the elements, and select-ing and groupselect-ing the variables could also be a source of bias as it is a subjective process (Lin 2002). In this case, involvement in pre-vious studies can be of advantage during the content analysis’s process. The previous stud-ies reviewed in this investigation were re-stricted to articles about food choices using the MEC theory, which did help the re-searcher to identify coding themes from the raw data. The categories of the attributes, consequences and values have been summa-rized in Table 3.
Discussion: Hierarchy Value
Maps (HVMs) of Local Food
Fi
gu
re
2.
HV
M
of
Local
Foods
for
In
don
esian
Con
su
me
rs
for
th
e
Non-J
av
anese
Ethn
ic
Gr
oup
abstractness ratio and centrality index, pro-vides a powerful method for revealing what motives drive Indonesian consumers to pur-chase their local foodstuffs. The consumers’ main goals are presented in the HVMs, which yield a quick and better understanding of why consumers buy local food. Figure 1 shows the HVM of local food for Javanese consumers and Figure 2 presents the HVM of local food for non-Javanese consumers.
The findings show that the HVMs for local food differ between the Javanese and non-Javanese consumers and are summarized below:
The HVM of local food for Javanese
con-sumers is richer in attributes and values than the HVM of local food for the non-Javanese consumers. For non-Javanese consum-ers, two separate ladders are produced from the laddering interviews that result in 8 at-tributes, 7 consequences and 4 values. In contrast, only 3 attributes, 7 consequences and 3 values are involved in one HVM of the local food for non-Javanese consum-ers.
In terms of the context of centrality, good
health is the greatest importance of cogni-tion (0.613) for the Javanese consumers, followed by time for other things (0.484), a sense of accomplishment (0.323) and a prosperous family/area/nation (0.306). In contrast, time for other things (0.526), man-aging a budget (0.516), good health (0.400), money for other things (0.386), earning money (0.379) and saving time and energy (0.316) are the central elements for the non-Javanese consumers. Those elements play an important role in the decision mak-ing process for local food.
Values that can be inserted for an
adver-tising strategy for the Javanese consumers are ‘sense of accomplishment’, ‘life
satis-faction’, ‘better family relationship’ and ‘health is the most valuable thing in life,’ whereas for non-Javanese consumers, the important values are ‘sense of accomplish-ment’, ‘life satisfaction’ and ‘fun and en-joyment in life.’
Three main pathways are found from the
HVM for Javanese consumers, based on the linkages within the HWM.
The first pathway is named “Trust the food
so you feel a sense of accomplishment.” This pathway is: Trust the food save
time and energy time for other things sense of accomplishment.
The second pathway is named “Good
health” and the pathway is: Freshness
good healthtime for other things sense of accomplishment.
The third chain is called “Support our
lo-cal communities for a prosperous na-tion.” The linkage is: Support local com-munities prosperous nation.
There are 2 dominant pathways within the
HVM for non-Javanese consumers.
The first main chain is named “Easy to
prepare so you have fun and enjoyment,” which is the pathway: Easy to prepare
save time and energy time for other
things earn money save money money for other things fun and
en-joyment.
The second linkage is called “Inexpensive
price will create fun and enjoyment.” The linkage is: Inexpensivesave money money for other thingfun and
enjoy-ment.
The HVM’s interpretation is highly suited
lower-medium family incomes, are underforty years of age and hold a student or permanent resident visa.
Philip and Reynold (2009) state that one of the laddering assumption that might be met is that participants’ responses result in a complete ladder that consists of three levels of abstraction (A,C,V). However, in this study the higher values are not always achieved for all the HVMs, particularly in the HVM for the non-Javanese consumers, so this assumption was not met. In contrast, the find-ings of this study do not imply a failure to meet the laddering assumptions, as consum-ers may have incomplete laddconsum-ers due to their lack of product experience or the present of a few simple products (Olson and Reynolds 2003). Costa et al. (2004) argue that food choice is a habitual and routine activity that results in HVMs that are rich in attributes and consequences. In this case the HVMs of con-sumers from the island of Java are likely to be richer in attributes and values.
Conclusion
Although Means-End Chains (MEC) are frequently used for understanding the moti-vation behind particular food choices, little is known about the application of the MEC approach among subjects from a developing country. The MEC theory provides a quick and better approach for understanding the motivation behind food choices. A discussion of the MEC process is provided that includes some consideration of the specific approach selected. Thus, this study offers a seminal understanding of the motives for the choice of local food.
The contribution of this study also pro-vide a better perspective of the local
food-stuffs among Indonesian consumers, and de-velops new categories of attributes, conse-quences and values that are from a combina-tion of our field results and the large number of previous studies using the MEC process in the context of food choices.
Therefore, the result of this study can be used for a survey that involves a larger population, in particularly Indonesia and Asian countries in general. The motives be-hind purchasing local food for Javanese people: ‘Trust the food’, ‘good health’ and ‘support the local community’ are highlighted views that motivate consumers to buy local fresh produce while for non-Javanese people, ‘easy for preparation’ and ‘inexpensive price’ are important views that motivate them to purchase local food.
However, this study has two limitations. Firstly, a potential bias may come from the content analysis procedure we employed. Multiple coders were not used in this study during the development of the list of the cat-egories of the attributes, consequences and values. Multiple coders can provide a better level of methodological rigor and avoid a potential bias source arising from the research-ers who extract the themes from the inter-view transcripts. Secondly, the subjects in this study are limited to Indonesian consumers who live or stay in Adelaide. These respon-dents seem to have a higher level of educa-tion and a higher family income when com-pared to consumers who live in Indonesia.
Acknowledgement
We would like to express our sincere gratitude to Prof. Tony Spawton and Prof. John Keeves for their valuable feedback to improve the quality of this paper. We also would like to thank the two anonymous reviewers for their helpful and insightful comments and suggestions.
References
Arsil, P., E. Li, and J. Bruwer. 2014a. Perspectives on Consumer Perceptions of Local Foods: A View from Indonesia. Journal of International Food & Agribusiness Marketing 26 (2):107-124.
Arsil, P., E. Li, J. Bruwer, and G. Lyons. 2014b. Exploring consumer motivations towards buying local
fresh food products: A means-end chain approach. British Food Journal 116 (10): 1533 – 1549.
Aurifeille, J-M., and P. Valette-Florence. 1995. Determination of the dominant means-end chains: A constrained clustering approach. International Journal of Research in Marketing 12 (3): 267-278. Bagozzi, R. P., and P. A. Dabholkar. 1994. Consumer recycling goals and their effect on decisions to
recycle: A means-end chain analysis. Psychology and Marketing 11 (4): 313-341.
Baker, S., K. E. Thompson, J. Engelken, and K. Huntley. 2004. Mapping the values driving organic food choices: Germany vs the UK. European Journal of Marketing 38 (8): 995-1012.
Barrena, R., and M. Sanchez. 2010. Frequency of consumption and changing determinants of purchase decisions: From attributes to values in the organic food market. Spanish Journal of Agricultural Re-search 8 (2): 251-272.
Bech-Larsen, T., N. A. Nielsen, K. G. Grunert, and E. Sorensen. 1996. Means-end chains for low involment food products - a study of Danish consumers’ cognitions regarding different applications of vegetable oil. Working paper. The Aarhus School of Business.
Bonne, K., and W. Verbeke. 2006. Muslim consumer’s motivations towards meat consumption in Bel-gium: Qualitative exploratory insights from means-end chain analysis. Anthropology of Food 5: 1-24. Botschen, G,. and A. Hemetsberger. 1998. Diagnosing Means-End Structures to Determine the Degree
of Potential Marketing Program Standardization. Journal of Business Research 42 (2): 151-159. Botschen, G., E. M. Thelen, and R. Pieters. 1999. Using means-end structures to benefit segmentation an
application for services. European Journal of Marketing 33 (1-2): 38-58.
Bredahl, L. 1999. Consumers cognitions with regard to genetically modified foods. Results of a qualita-tive study in four countries. Appetite 33 (3): 343-360.
Costa, A. I. A., M. Dekker, and W. M. F. Jongen. 2004. An overview of the means-end theory: Potential applications in consumer-oriented food products design. Trends in Food Science & Technology 15 (7– 8): 403-415.
Fotopoulos, C., A. Krystallis, and M. Ness. 2003. Wine produced by organic grapes in Greece: Using means-end chains analysis to reveal organic buyers’ purchasing motives in comparison to the non-buyers. Food Quality and Preference 14 (7): 549-566.
Gengler, C. E., D. B. Klenosky. and M. S. Mulvey. 1995. Improving the graphic representation of means-end results. International Journal of Research in Marketing 12 (3): 245-256.
Grantham, S.. 2007. But what do they really think? Identifying consumers’ values relevant to adopting biotechnologically produced foods. Journal of Public Affairs 7 (4): 372-382.
Grunert, K. G. 1997. What’s in a steak? A cross-cultural study on the quality perception of beef. Food
Quality and Preference 8 (3): 157-174.
Grunert, K. G., and S. C. Grunert. 1995. Measuring subjective meaning structures by the laddering method: Theoretical considerations and methodological problems. International Journal of Research in Market-ing 12 (3): 209-225.
Grunert, K. G., L., Lähteenmäki, N. A. Nielsen, J. B. Poulsen, O. Ueland, and A. Åström. 2001. Consumer perceptions of food products involving genetic modification-results from a qualitative study in four Nordic countries. Food Quality and Preference 12 (8): 527-542.
Gutman, J. 1982. A means-and chain model based on consumer categorization processes. The Journal of
Marketing 46 (2): 60-72.
Gutman, J. 1984. Analysing consumer orientations toward beverages through means-end chain analysis. Psychology and Marketing 1 (3/4): 23-43.
Hall, J. and L. Lockshin. 2000. Using means-end chains for analysing occasions - not buyers. Australasian Marketing Journal (AMJ) 8 (1): 45-54.
Hofstede, F.t., A. Audenaert, J. B. E. M. Steenkamp, and M. Wedel. 1998. An investigation into the
association pattern technique as a quantitative approach to measuring means-end chains.
Interna-tional Journal of Research in Marketing 15 (1): 37-50.
Kaciak, E., and C. W. Cullen. 2006. Analysis of means-end chain data in marketing research. Journal of
Targeting, Measurement and Analysis for Marketing 15 (1): 12-20.
Kassarjian, H. H. 1977. Content analysis in consumer research. Journal of Consumer Research 4 (1): 8-18. Kirchhoff, S., H.Smyth, J. Sanderson, Y. Sultanbawa, and K. Gething, 2011. Increasing the consumption
of vegetables: A means-end chain approach. British Food Journal 113 (8): 1031-1044.
Kolbe, R. H., and M. S. Burnett. 1991. Content-analysis research: An examination of applications with directives for improving research reliability and objectivity. Journal of Consumer Research 18: 243-250. Krystallis, A., G. Maglaras, and S. Mamalis. 2008. Motivations and cognitive structures of consumers in
their purchasing of functional foods. Food Quality and Preference 19 (6): 525-538.
Leppard, P., C. G. Russell, and D. N. Cox. 2004. Improving means-end-chain studies by using a ranking method to construct hierarchical value maps. Food Quality and Preference 15 (5): 489-497.
Lin, C. 2002. Attribute-consequence-value linkages: A new technique for understanding customers’ prod-uct knowlegde. Journal of Targeting, Measurement and Analysis for Marketing 10: 339-352.
Lind, L. W. 2007. Consumer involvement and perceived differentiation of different kinds of pork – a means-end chain analysis. Food Quality and Preference 18 (4): 690-700.
Makatouni, A. 2002. What motivates consumers to buy organic food in the UK? Results from a qualita-tive study. British Food Journal 104 (3/4/5): 345-352.
Naspetti, S, and R. Zanoli. 2009. Organic food quality and safety perception throughout Europe. Journal
of Food Products Marketing 159 (3): 249-266.
Padel, S., and C. Foster. 2005. Exploring the gap between attitudes and behaviour: Understanding why consumers buy or do not buy organic food. British Food Journal 107 (8): 606-625.
Phillips, J. M., and T. J. Reynolds. 2009. A hard look at hard laddering: A comparison of studies examin-ing the hierarchical structure of means-end theory. Qualitative Market Research: An International Jour-nal 12( 1): 83-99.
Pieters, R., H. Baumgartner, and D. Allen. 1995. A means-end chain approach to consumer goal struc-tures. International Journal of Research in Marketing 12 (3): 227-244.
Prescott, J., O. Young, L. O’Neill, N. J. N. Yau, and R. Stevens. 2002. Motives for food choices: A
comparison of consumers from Japan, Taiwan, Malaysia and New Zealand. Food Quality and
Pref-erence 13 (7-8): 489-495.
Reynolds, T. J. 2006. Methodological and strategy development implications of decision segmentation. Journal of Advertising Research 46 (4): 445-461.
Reynolds, T. J. and J. Gutman. 1988. Laddering theory, method, analysis, and interpretation. Journal of
Advertising Research 28 (1): 11-31.
Roininen, K., A. Arvola, and L. Lähteenmäki. 2006. Exploring consumers’ perceptions of local food with two different qualitative techniques: Laddering and word association. Food Quality and Prefer-ence 17 (1-2): 20-30.
Russell, C. G., A. Busson, I. Flight, J. Brian, J. A.v.L. van Pabst, and D.N. Cox. 2004a. A comparison of three laddering techniques applied to an example of a complex food choice. Food Quality and Preference 15: 569-583.
Russell, C. G., I. Flight, P. Leppard, J. A.v.L. van Pabst, J. A. Syrette, and D.N. Cox. 2004b. A comparison
of paper-and-pencil and computerised methods of ‘hard’ laddering. Food Quality and Preference 15
(3): 279-291.
Schiffman, L. G, and L. L. Kanuk. 2010. Consumer Behaviour (6th ed.). New Jersey: Prentice Hall.
Suryadinata, L., E. N. Arifin, and A. Ananta. 2003. Indonesia’s Population: Ethnicity and Religion in a Changing Political Landscape. Singapore: Institute of Southeast Asian Studies.
Urala, N., and L. Lähteenmäki. 2003. Reasons behind consumers’ functional food choice. Nutrition and
Food Science 33 (4): 148-158.
Valette-FIorence, P., and B. Rapacchi. 1991. Improving means-end chain analysis using graph theory and correspondence analysis. Journal of Advertising Research 31 (1): 30-45.
Valette-Florence, P., L. Sirieix., K. Grunert, and N. Nielsen. 2000. Means-end chain analyses of fish con-sumption in Denmark and France: A multidimensional perspective. Journal of Euromarketing 8 (1-2): 15-27.
van Rekom, J., and B. Wierenga. 2007. On the hierarchical nature of means–end relationships in laddering data. Journal of Business Research 60 (4): 401-410.
Veludo-de-Oliveira, T. M., A. A. Ikeda, and M. C. Campomar. 2006. Laddering in the practice of mar-keting research: Barriers and solutions. Qualitative Market Research: An International Journal 9 (3): 297-306.