Afg h an ist an - D e m og r ap h ic an d He alt h
Su r v e y 2 0 1 5
Central Statistics Organization (CSO) - Government of Islamic Republic of
Afghanistan, Ministry of Public Health (MoPH) - Government of Islamic Republic of
Afghanistan
Re p or t g e n e r at e d on : May 2 3 , 2 0 1 7
Sampling
Sampling Procedure
The sampling frame used for the 2015 AfDHS is an updated version of the Household Listing Frame, prepared in 2003-04 and
updated in 2009, provided by the Central Statistics Organization (CSO). The sampling frame had information on 25,974
enumeration areas (EAs). An EA is a geographic area consisting of a convenient number of dwelling units that serve as
counting units for the census. The sampling frame contained information about the location (province, district, and control
area), the type of residence (urban or rural), and the estimated number of residential households for each of the 25,974 EAs.
Satellite maps were also available for each EA, which delimited the geographic boundaries of the area. The sampling frame
excluded institutional populations such as persons in hotels, barracks, and prisons.
The 2015 AfDHS followed a stratified two-stage sample design and was intended to allow estimates of key indicators at the
national level, in urban and rural areas, and for each of the 34 provinces of Afghanistan. The first stage involved selecting
sample points (clusters) consisting of EAs. A total of 950 clusters were selected, 260 in urban areas and 690 in rural areas. It
was recognized that some areas of the country might be difficult to reach because of ongoing security issues. Therefore, to
mitigate the situation, reserve clusters were selected in all of the provinces to replace the inaccessible clusters. The 101
reserve clusters that were preselected did not exceed 10% of the selected clusters in the province.
The second stage involved systematic sampling of households. A household listing operation was undertaken in all of the
selected clusters, and a fixed number of 27 households per cluster were selected through an equal probability systematic
selection process, for a total sample size of 25,650 households. Because of the approximately equal sample size in each
province, the sample is not self-weighting at the national level, and weighting factors have been calculated, added to the
data file, and applied so that results are representative at the national level.
All ever-married women age 15-49 who were either permanent residents of the selected households or visitors who stayed
in the households the night before the survey were eligible to be interviewed. In half of the households, all ever-married men
age 15-49 who were either residents of the selected households or visitors who stayed in the households the night before
the survey were eligible to be interviewed.
During the household listing operation, more than 70 selected clusters were identified as insecure. Therefore, a decision was
made to carry out the household listing operation in all of the 101 preselected reserve clusters, which also accounted for the
possibility of identifying more insecure clusters during data collection. Household listing was successfully completed in 976
of 1,051 clusters. Overall, the survey was successfully carried out in 956 clusters.
For further details on sample selection, see Appendix A of the final report.
Response Rate
A total of 25,741 households were selected for the sample, of which 24,941 were occupied during the survey fieldwork. Of
the occupied households, 24,395 were successfully interviewed, yielding a response rate of 98%.
In the interviewed households, 30,434 ever-married women age 15-49 were identified for individual interviews; interviews
were completed with 29,461 of these women, yielding a response rate of 97%. In the subsample of households selected for
the male survey, 11,778 ever-married men age 15-49 were identified and 10,760 were successfully interviewed, yielding a
response rate of 91%. The lower response rate for men was likely due to their more frequent and longer absences from the
household.
The response rates are lower in urban areas than in rural areas. The difference is more prominent for men than women, as
men in the urban areas are often away from their households for work. Moreover, given the security situation in the country,
the field teams could not carry out interviews in the late evenings when more men are at home.
Weighting
stratum. For the women’s individual sampling weight, the household sampling weight is multiplied by the inverse of the
women’s individual response rate, by stratum. For the men’s individual sampling weight, the household sampling weight for
the male subsample is multiplied by the inverse of the men’s individual response rate, by stratum. After adjusting for
nonresponse, the sampling weights are normalized to get the final standard weights that appear in the data files. The
normalization process is aimed at obtaining a total number of unweighted cases equal to the total number of weighted cases
using normalized weights at the national level, for the total number of households, women, and men. Normalization is done
by multiplying the sampling weight by the estimated total sampling fraction obtained from the survey for the household
weight, the individual woman’s weight, and the individual man’s weight. The normalized weights are relative weights that
are valid for estimating means, proportions, ratios, and rates, but they are not valid for estimating population totals or for
pooled data. Special weights for domestic violence were calculated that account for the selection of one woman per
household.
Questionnaires
Overview
Data Collection
Data Collection Dates
Start
End
Cycle
2015-06
2016-02
N/A
Data Collection Mode
Face-to-face [f2f]
DATA COLLECTION NOTES
Pretest
The fieldwork for the pretest was carried out in four locations in and around Kabul. There were four teams deployed: two
teams for testing the Dari language questionnaires and two teams for testing the Pashto language questionnaires. Following
the field practice, a debriefing session was held with the pretest field staff, and modifications to the questionnaires were
made based on lessons drawn from the exercise.
Fieldwork
Data collection was carried out by 33 field teams, each consisting of one team supervisor, one field editor, three female
interviewers, and three male interviewers. However, the team composition had to be adjusted during the different phases of
the fieldwork operation because of security challenges. Data collection took place from June 15, 2015, through February 23,
2016, although most of the teams completed the fieldwork by November 2015. The extension of fieldwork in some provinces
was due to the ongoing unrest and insurgency in the provinces of Kunduz, Helmand, Faryab, Badghis, and Ghazni. In the
case of Badakhshan, the team had to pass through Tajikistan to access the clusters; this entailed getting visa approval,
which took more than 3 months. Despite substantial challenges in the field, the AfDHS field teams successfully completed
the fieldwork.
Fieldwork monitoring was an integral part of the AfDHS, and five rounds of monitoring were carried out by the AfDHS core
team and the 17 master trainers. Two levels of monitoring strategies were identified: technical monitoring and coverage
monitoring. The technical monitoring was carried out by the AfDHS core team and the master trainers, while the coverage
monitoring was carried out by provincial statistical officers (PSOs) and the Provincial Health Directorate (PHD) of MoPH. The
monitors were provided with guidelines for overseeing the fieldwork.
Data Collectors
Name
Abbreviation
Affiliation
Central Statistics Organization
CSO
Government of Islamic Republic of Afghanistan
Data Processing
Data Editing
Data Appraisal
Estimates of Sampling Error
The estimates from a sample survey are affected by two types of errors: nonsampling errors and sampling errors.
Nonsampling errors are the results of mistakes made in implementing data collection and data processing, such as failure
to locate and interview the correct household, misunderstanding of the questions by either the interviewer or the
respondent, and data entry errors. Although numerous efforts were made during the implementation of the 2015
Afghanistan Demographic and Health Survey (2015 AfDHS) to minimize this type of error, nonsampling errors are
impossible to avoid and difficult to evaluate statistically.
Sampling errors, on the other hand, can be evaluated statistically. The sample of respondents selected in the 2015 AfDHS
is only one of many samples that could have been selected from the same population, using the same design and expected
size. Each of these samples would yield results that differ somewhat from the results of the actual sample selected.
Sampling errors are a measure of the variability among all possible samples. Although the degree of variability is not known
exactly, it can be estimated from the survey results.
Sampling error is usually measured in terms of the standard error for a particular statistic (mean, percentage, etc.), which
is the square root of the variance. The standard error can be used to calculate confidence intervals within which the true
value for the population can reasonably be assumed to fall. For example, for any given statistic calculated from a sample
survey, the value of that statistic will fall within a range of plus or minus two times the standard error of that statistic in
95% of all possible samples of identical size and design.
If the sample of respondents had been selected as a simple random sample, it would have been possible to use
straightforward formulas for calculating sampling errors. However, the 2015 AfDHS sample is the result of a multi-stage
stratified design, and, consequently, it was necessary to use more complex formulas. Sampling errors are computed by SAS
programs developed by ICF. These programs use the Taylor linearization method to estimate variances for survey
estimates that are means, proportions, or ratios. The Jackknife repeated replication method is used for variance estimation
of more complex statistics such as fertility and mortality rates.
The Taylor linearization method treats any percentage or average as a ratio estimate, r = y/x, where y represents the total
sample value for variable y, and x represents the total number of cases in the group or subgroup under consideration.
Note: A more detailed description of estimates of sampling errors are presented in APPENDIX B of the survey report.
Other forms of Data Appraisal
Data Quality Tables
- Household age distribution
- Age distribution of eligible and interviewed women
- Age distribution of eligible and interviewed men
- Completeness of reporting
- Births by calendar years
- Reporting of age at death in days
- Reporting of age at death in months
- Sibship size and sex ratio of siblings
Note: See detailed data quality tables in APPENDIX C of the report.
Related Materials
Questionnaires
Afghanistan Demographic and Health Survey 2015, Household Questionnaire
Title
Afghanistan Demographic and Health Survey 2015, Household Questionnaire
Author(s) Central Statistics Organization and Ministry of Public Health
Date
2015-06-01
Country
Afghanistan
Language English
Filename Afghanistan_2015_DHS_hh_questionnaires.pdf
Afghanistan Demographic and Health Survey 2015, Ever-Maried Woman's
Questionnaire
Title
Afghanistan Demographic and Health Survey 2015, Ever-Maried Woman's Questionnaire
Author(s) Central Statistics Organization and Ministry of Public Health
Date
2015-06-01
Country
Afghanistan
Language English
Filename Afghanistan_2015_DHS_woman_questionnaires.pdf
Afghanistan Demographic and Health Survey 2015, Ever-Married Man's
Questionnaire
Title
Afghanistan Demographic and Health Survey 2015, Ever-Married Man's Questionnaire
Author(s) Central Statistics Organization and Ministry of Public Health
Date
2015-06-01
Country
Afghanistan
Language English
Filename Afghanistan_2015_DHS_man_questionnaires.pdf
Reports
Afghanistan Demographic and Health Survey 2015, Report
Title Afghanistan Demographic and Health Survey 2015, Report
Author(s) Central Statistics Organization, Ansari Watt, Kabul, Afghanistan Ministry of Public Health, Wazir Akbar Khan, Kabul, Afghanistan The DHS Program, ICF, Rockville, Maryland, USA Date 2017-01-01
Country Afghanistan Language English
Table of contents
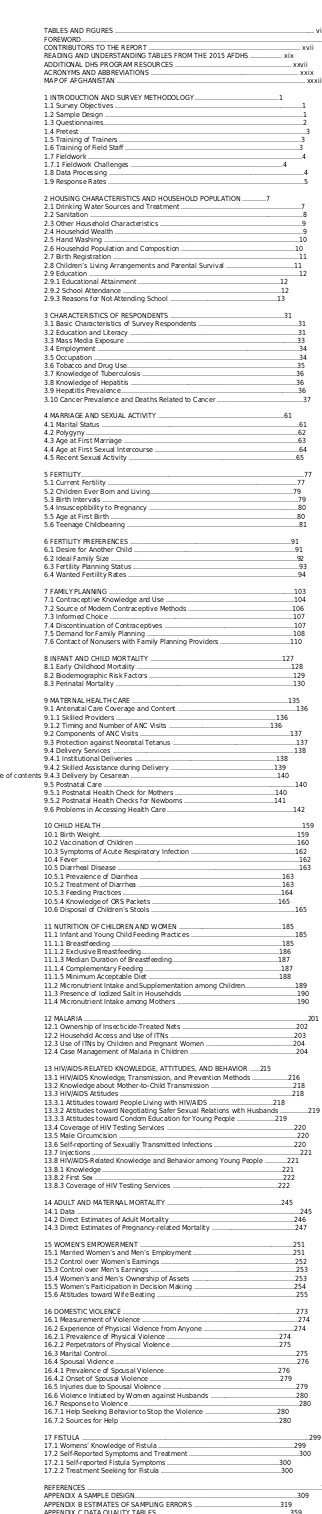
FOREWORD...xv
CONTRIBUTORS TO THE REPORT ... xvii
READING AND UNDERSTANDING TABLES FROM THE 2015 AFDHS ... xix
ADDITIONAL DHS PROGRAM RESOURCES ... xxvii
ACRONYMS AND ABBREVIATIONS ... xxix
MAP OF AFGHANISTAN ... xxxii
1 INTRODUCTION AND SURVEY METHODOLOGY ...1
1.1 Survey Objectives ...1
1.2 Sample Design ...1
1.3 Questionnaires...2
1.4 Pretest ...3
1.5 Training of Trainers ...3
1.6 Training of Field Staff ...3
1.7 Fieldwork ...4
1.7.1 Fieldwork Challenges ...4
1.8 Data Processing ...4
1.9 Response Rates ...5
2 HOUSING CHARACTERISTICS AND HOUSEHOLD POPULATION ...7
2.1 Drinking Water Sources and Treatment ...7
2.2 Sanitation ...8
2.3 Other Household Characteristics ...9
2.4 Household Wealth ...9
2.5 Hand Washing ...10
2.6 Household Population and Composition ...10
2.7 Birth Registration ...11
2.8 Children’s Living Arrangements and Parental Survival ...11
2.9 Education ...12
2.9.1 Educational Attainment ...12
2.9.2 School Attendance ...12
2.9.3 Reasons for Not Attending School ...13
3 CHARACTERISTICS OF RESPONDENTS ...31
3.1 Basic Characteristics of Survey Respondents ...31
3.2 Education and Literacy ...31
3.3 Mass Media Exposure ...33
3.4 Employment ...34
3.5 Occupation ...34
3.6 Tobacco and Drug Use...35
3.7 Knowledge of Tuberculosis ...36
3.8 Knowledge of Hepatitis ...36
3.9 Hepatitis Prevalence...36
3.10 Cancer Prevalence and Deaths Related to Cancer ...37
4 MARRIAGE AND SEXUAL ACTIVITY ...61
4.1 Marital Status ...61
4.2 Polygyny ...62
4.3 Age at First Marriage ...63
4.4 Age at First Sexual Intercourse ...64
4.5 Recent Sexual Activity ...65
5 FERTILITY...77
5.1 Current Fertility ...77
5.2 Children Ever Born and Living...79
5.3 Birth Intervals ...79
5.4 Insusceptibility to Pregnancy ...80
5.5 Age at First Birth ...80
5.6 Teenage Childbearing ...81
6 FERTILITY PREFERENCES ...91
6.1 Desire for Another Child ...91
6.2 Ideal Family Size ...92
6.3 Fertility Planning Status ...93
6.4 Wanted Fertility Rates ...94
7 FAMILY PLANNING ...103
7.1 Contraceptive Knowledge and Use ...104
7.2 Source of Modern Contraceptive Methods ...106
7.3 Informed Choice ...107
7.4 Discontinuation of Contraceptives ...107
7.5 Demand for Family Planning ...108
7.6 Contact of Nonusers with Family Planning Providers ...110
8 INFANT AND CHILD MORTALITY ...127
8.1 Early Childhood Mortality ...128
8.2 Biodemographic Risk Factors ...129
8.3 Perinatal Mortality ...130
9 MATERNAL HEALTH CARE ...135
9.1 Antenatal Care Coverage and Content ...136
9.1.1 Skilled Providers ...136
9.1.2 Timing and Number of ANC Visits ...136
9.2 Components of ANC Visits ...137
9.3 Protection against Neonatal Tetanus ...137
9.4 Delivery Services ...138
9.4.1 Institutional Deliveries ...138
9.4.2 Skilled Assistance during Delivery ...139
9.4.3 Delivery by Cesarean ...140
9.5 Postnatal Care ...140
9.5.1 Postnatal Health Check for Mothers ...140
9.5.2 Postnatal Health Checks for Newborns ...141
9.6 Problems in Accessing Health Care ...142
10 CHILD HEALTH ...159
10.1 Birth Weight...159
10.2 Vaccination of Children ...160
10.3 Symptoms of Acute Respiratory Infection ...162
10.4 Fever ...162
10.5 Diarrheal Disease ...163
10.5.1 Prevalence of Diarrhea ...163
10.5.2 Treatment of Diarrhea ...163
10.5.3 Feeding Practices ...164
10.5.4 Knowledge of ORS Packets ...165
10.6 Disposal of Children’s Stools ...165
11 NUTRITION OF CHILDREN AND WOMEN ...185
11.1 Infant and Young Child Feeding Practices ...185
11.1.1 Breastfeeding ...185
11.1.2 Exclusive Breastfeeding...186
11.1.3 Median Duration of Breastfeeding...187
11.1.4 Complementary Feeding ...187
11.1.5 Minimum Acceptable Diet ...188
11.2 Micronutrient Intake and Supplementation among Children...189
11.3 Presence of Iodized Salt in Households ...190
11.4 Micronutrient Intake among Mothers ...190
12 MALARIA ...201
12.1 Ownership of Insecticide-Treated Nets ...202
12.2 Household Access and Use of ITNs ...203
12.3 Use of ITNs by Children and Pregnant Women ...204
12.4 Case Management of Malaria in Children ...204
13 HIV/AIDS-RELATED KNOWLEDGE, ATTITUDES, AND BEHAVIOR ...215
13.1 HIV/AIDS Knowledge, Transmission, and Prevention Methods ...216
13.2 Knowledge about Mother-to-Child Transmission ...218
13.3 HIV/AIDS Attitudes ...218
13.3.1 Attitudes toward People Living with HIV/AIDS ...218
13.3.2 Attitudes toward Negotiating Safer Sexual Relations with Husbands ...219
13.3.3 Attitudes toward Condom Education for Young People ...219
13.4 Coverage of HIV Testing Services ...220
13.5 Male Circumcision ...220
13.6 Self-reporting of Sexually Transmitted Infections ...220
13.7 Injections ...221
13.8 HIV/AIDS-Related Knowledge and Behavior among Young People ...221
13.8.1 Knowledge ...221
13.8.2 First Sex ...222
13.8.3 Coverage of HIV Testing Services ...222
14 ADULT AND MATERNAL MORTALITY ...245
14.1 Data ...245
14.2 Direct Estimates of Adult Mortality ...246
14.3 Direct Estimates of Pregnancy-related Mortality ...247
15 WOMEN’S EMPOWERMENT ...251
15.1 Married Women’s and Men’s Employment ...251
15.2 Control over Women’s Earnings ...252
15.3 Control over Men’s Earnings ...253
15.4 Women’s and Men’s Ownership of Assets ...253
15.5 Women’s Participation in Decision Making ...254
15.6 Attitudes toward Wife Beating ...255
16 DOMESTIC VIOLENCE ...273
16.1 Measurement of Violence ...274
16.2 Experience of Physical Violence from Anyone ...274
16.2.1 Prevalence of Physical Violence ...274
16.2.2 Perpetrators of Physical Violence ...275
16.3 Marital Control...275
16.4 Spousal Violence ...276
16.4.1 Prevalence of Spousal Violence...276
16.4.2 Onset of Spousal Violence ...279
16.5 Injuries due to Spousal Violence ...279
16.6 Violence Initiated by Women against Husbands ...280
16.7 Response to Violence ...280
16.7.1 Help Seeking Behavior to Stop the Violence ...280
16.7.2 Sources for Help ...280
17 FISTULA ...299
17.1 Womens’ Knowledge of Fistula ...299
17.2 Self-Reported Symptoms and Treatment ...300
17.2.1 Self-reported Fistula Symptoms ...300
17.2.2 Treatment Seeking for Fistula ...300
REFERENCES ...307
APPENDIX A SAMPLE DESIGN...309
APPENDIX B ESTIMATES OF SAMPLING ERRORS ...319
APPENDIX C DATA QUALITY TABLES ...359
[image:11.595.50.211.33.790.2]Filename http://dhsprogram.com/pubs/pdf/FR323/FR323.pdf
Afghanistan 2015 Demographic and Health Survey, Key Findings
Title
Afghanistan 2015 Demographic and Health Survey, Key Findings
Author(s) The DHS Program
Date
2017-01-01
Country
Afghanistan
Language English
Filename http://dhsprogram.com/pubs/pdf/SR236/SR236.pdf
Afghanistan 2015 Demographic and Health Survey, Wall Chart
Title
Afghanistan 2015 Demographic and Health Survey, Wall Chart
Author(s) The DHS Program
Date
2017-01-01
Country
Afghanistan
Language English
Filename http://dhsprogram.com/pubs/pdf/DM99/DM99.pdf
Fast Facts from The 2015 Afghanistan Demographic and Health Survey
Title
Fast Facts from The 2015 Afghanistan Demographic and Health Survey
Author(s) The DHS Program
Date
2017-01-01
Country
Afghanistan
Language English
Filename http://dhsprogram.com/pubs/pdf/DM101/DM101.pdf
2015 Afghanistan Demographic and Health Survey (AfDHS) , Flyer
Title
2015 Afghanistan Demographic and Health Survey (AfDHS) , Flyer
Author(s) The DHS Program
Date
2017-01-01
Country
Afghanistan
Language English
Filename http://dhsprogram.com/pubs/pdf/DM100/DM100.pdf