Discrimination? A Meta-Regression
Analysis
Stephen B. Jarrell
T. D. Stanley
A B S T R A C T
This paper extends, tests, and revises a previous meta-regression analysis of the gender wage gap (Stanley and Jarrell 1998). We find that there remains a strong, though dampened, tendency for discrimination estimates to fall, and male researchers still report significantly larger amounts of wage dis-crimination against women. This extensive research base, containing 104 estimates, suggests that there is less need to correct for selection bias—an indirect sign of lessened discrimination. There is evidence that gender research is changing and improving. Although gender wage discrimination has lessened, the research base still finds a significant gender wage inequality.
I. Introduction
Has gender equity, in pay at least, been achieved? Gender discrimina-tion has been extensively studied and documented for decades. Dozens of studies using a wide array of estimation techniques, models, and data sets have estimated its severity. Gender wage discrimination is one of the most frequently researched fields of labor economics.
Clearly, women experience significant discrimination in pay. Almost all studies confirm this. Yet, there remains great variability among the estimates of gender dis-crimination. We wish to investigate whether gender discrimination is continuing to
Stephen B. Jarrell is a professor of management and international business at Western Carolina University. T. D. Stanley is a professor of economics and business at Hendrix College. The authors would like to acknowledge the helpful suggestions of two anonymous referees, Thomas Buford of Hendrix College for his competent research assistance; Brenda Moore of Hunter Library at Western Carolina University for her assistance in obtaining dissertations and other manuscripts; finally, Western Carolina University’s Scholarly Development Leave Program for providing time to work on this project. The data used in this article can be obtained beginning January 2005 through December 2008 from Stephen Jarrell, College of Business, Western Carolina University, Cullowhee, NC 28723.
[Submitted September 2002; accepted March 2003]
ISSN 022-166X © 2004 by the Board of Regents of the University of Wisconsin System
decline, whether male researchers still report larger gender wage discrimination and whether, even after Heckman’s Nobel Prize, it remains as important to correct for selection bias.
Stanley and Jarrell (1998) offer a quantitative assessment of the empirical literature on gender wage discrimination. This meta-regression analysis (MRA) identifies 12 separate factors that are related to the reported gender wage gap, which together explain more than 80 percent of the variation across this research literature. Since this meta-analysis was conducted, the number of reported estimates has nearly doubled. Have the findings about gender wage discrimination changed? Will this meta-regres-sion model still accurately explain these newer results? Although the previous MRA model can explain 90 percent of the variation among the more recent results (Table 3, Column 2), we find evidence that gender research has significantly changed and improved. Nonetheless, there remains a core of research characteristics that exerts a sta-ble influence on research findings and explains the majority of the research variation.
Surprisingly, the trend of declining discrimination estimates remains strong, though moderating. Against a background of reduced wage inequality, there would be less pressure for further declines. Thus, the rate of decline of wage discrimination should slow down. As conventional theory predicts, falling wage discrimination lessens selection bias. In general, this study finds a moderation in gender wage discrimination and in the sensitivity of its estimation to changes in research approaches. Although progress has been made, this expanded research base still estimates the presence of significant gender wage inequality (6.2 percent for 2003).
In her comprehensive review of the literature, Blau (1998) acknowledges the strik-ing decline in the unexplained gender gap and discusses whether there has been a genuine decline in discrimination or an improvement in women’s unmeasured pro-ductivity. In their Handbook of Labor Marketcontribution, Altonji and Blank (1999) suggest that the role of women’s changing labor market selectivity is an area “ripe for more research” (p. 3250). By extending the meta-analysis of gender wage discrimi-nation to over 100 estimates, we hope to provide answers to such issues.
II. Wage Discrimination Estimates
Since the 1970s, researchers have typically used Blinder-Oaxaca decomposition to divide the observed average gender gap into two components. The first is the portion attributable to differences in endowments (or skills), and the remainder is often characterized as a difference in coefficients (or returns to skills) (Blinder 1973; Oaxaca 1973). The latter component also provides an upper-bound estimate for the magnitude of wage discrimination.
To operationalize these distinctions, conventional discrimination estimates begin by fitting regression models to samples of male and female workers.
(1) W X
Xs are various worker/job characteristics.
βs are regression coefficients.
εis the usual regression disturbances.
After estimating Equation 1, researchers use the unexplained portion of the average gender gap,
( )2 Gj=X bftm-X bftf=X bf(tm-btf),
as an estimate of discrimination (Blinder 1973; Oaxaca 1973).
Many studies over the last 30 years alternatively report Oaxaca’s Das a measure of the magnitude of discrimination. Dand Gjare related by:
( )3 D=eGj-1
In the meta-regression analysis (MRA) that follows, a study’s estimate of Gjis the dependent variable, and its variation from one study to the next is explained by dif-ferent model specifications, alternative measurements of wages, passage of time, and the gender of the researchers.
III. Meta-Analysis of Gender Wage Discrimination
Meta-analysts employ statistics to describe and explain previously reported statistical estimates that examine the same phenomenon. Treating these esti-mates as a socioeconomic phenomenon, itself subject to empirical investigation pro-vides researchers with a framework for quantitative literature reviews (Stanley and Jarrell 1989; Stanley 2001). Meta-analysis allows researchers to combine, summarize, evaluate, and extend a given body of empirical knowledge. It is widely used in med-ical research, and its application to economics has been growing (Stanley 2001). It is “how science takes stock” (Hunt 1997).
In a meta-analysis, each reported empirical study becomes an observation for an applied econometric study. The wide variation that is routinely found in empirical economic research is largely a function of model misspecification, measurement, and methods that the investigator chooses to employ. For example, Stanley (1998) finds that several modeling choices as well as the number of specification tests passed have a significant influence on the reported findings about Ricardian equivalence. And, meta-analysis has begun to reveal a widespread pattern of publication bias in eco-nomics (Card and Krueger 1995; Ashenfelter et al. 1999; Görg and Strobl 2001; Florax 2002).
of changes in this area of research? How adequate is meta-analysis in summarizing empirical labor research?
A. Methods
To investigate the mutable nature of gender research we replicate the meta-analysis of Stanley and Jarrell (1998). As before, we searched EconLitfor any new listing with the phrase (wages or salary or earnings) and (discrimination or differen) and (sex or gender). This process netted 49 additional estimates. The rules for including a study in the meta-analysis are:
(1) The study must present an empirical estimate of the gender gap or sufficient information to calculate it.
(2) The estimate must concern gender wage discrimination in the United States.
(3) The estimate must be based on a broad national database.
(4) The estimate must also be derived from a regression analysis.
Stanley and Jarrell (1998) give greater technical details about this application of meta-analysis, while Stanley (2001) offers general guidelines for conducting meta-regres-sion analyses in economics.
B. Results
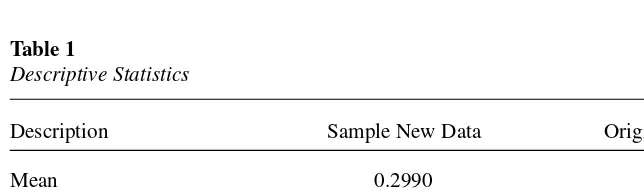
In the new sample of 49 estimates, the gender gap, Gj, ranged from −.046 to 0.77 with a mean of 0.2990 and standard deviation 0.1560 (see Table 1). By Equation 3, we may alternatively express this average as 34.9 percent of the female wage. Obviously, there remains significant average wage discrimination (t=13.4; p< .01). When we expand our view to include both samples (n=104), the average becomes 0.287, or 33.2 per-cent (t=19.5; p< .01), with a standard deviation of 0.1505.
Although descriptive statistics can be quite interesting and useful as a summary of research, it is more revealing to identify which factors are responsible for the large variation among these findings. Also descriptive statistics can be misleading. For example, the more recent research actually reports a slightly larger average gender
Table 1
Descriptive Statistics
Description Sample New Data Original Study
Mean 0.2990 0.2763
Percent of female wage 34.9 31.8
Standard deviation 0.1560 0.1460
Median 0.2816 0.2390
Range 0.8161 0.6746
gap (0.2990 versus 0.2763). Nonetheless, multiple regression analysis establishes a clear declining trend.
Table 2 lists the moderator variables found to be important by Stanley and Jarrell (1998)—reflecting the modeling choices made by the researcher, characteristics of workers modeled, time period covered by study, and the gender of the researchers. The most important explanatory factors among research characteristics concern how wages are measured. Salaryindicates that the researcher used annual salary to meas-ure a worker’s wages. While Weekis one when the researcher uses weekly wages, and
Wageyr denotes the calculation of hourly wage from annual salary. Because annual salary does not correct for known gender differences in weeks worked per year or in hours worked per week, its use is likely to cause the largest upward bias in gender wage discrimination estimates. Next in severity, weekfails to adjust for gender dif-ferences in weeks worked per year, while wageyr imperfectly corrects for both of these effects. The MRA results confirm the implied, ordered pattern (see Table 3, Column 1). Together, measures of wages explain more than half of the variation among the previous gender gap estimates and a third or more in the new and com-bined research samples.
Many other research characteristics exert a significant influence on discrimination estimates. Year(1970 =0) is used to capture any trend in gender discrimination. Male
Table 2
Meta-Regression Variables
A. Trend
Year =the year in which wages are earned (Year=0 in 1970).
B. Alternative measures of wages
Salary =1 if a study used annual salary as its measure of wages. Week =1 if a study used weekly salary as its measure of wages. Wageyr =1 if hourly wages were computed from annual salary.
C. Model specifications
Select =1 if a study did not correct for selection bias. Dummy =1 if a dummy variable for sex is used.
D. Worker characteristics
Age =1 if a study omitted the worker’s age.
Exp =1 if a study omitted the worker’s job experience.
Ind =1 if a study omitted the worker’s industry of employment. Govt =1 if a study omitted a government/private employment distinction. New Ent =1 if a study investigated the wages of new entrants only.
E. Researcher characteristics
Male =1 if a study was authored solely by men.
F. Dependent variable
(one for studies authored by males alone) investigates whether there is gender bias in gender research. Select(one if the study does not correct for selection biases) and
Dummy(one when the gender gap is estimated by a regression coefficient on a gen-der dummy variable) models researchers’ choice of methods. New Ent reflects whether the wage data concerns only recent entrants into the labor force. Lastly, Govt, Age, Exper,and Indsignal studies that omit these potentially relevant worker charac-teristics and thereby bias their estimates of discrimination. All of these effects are found to be statistically significant in our understanding of gender wage discrimina-tion research (see Table 3, Column 1). Here, they serve as a benchmark from which to compare and contrast the more recent research.
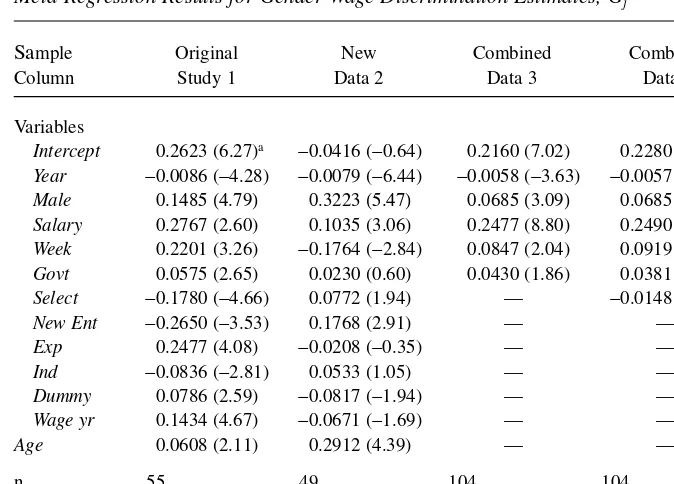
Table 3, Column 2 replicates Stanley and Jarrell’s (1998) MRA model (Column 1) for the more recent research. This meta-regression model is still able to explain more than 80 percent of the variation among these estimates of gender discrimination. Because the meta-analysis of regression coefficients is likely to contain het-eroskedasticity (Stanley and Jarrell 1989), hethet-eroskedasticity-consistent standard errors are used throughout Table 3 (White 1980). Nine of the previously significant characteristics of gender research remain significant (one tail tests), though some change signs. Nonetheless, the key findings of Stanley and Jarrell (1998) are corrob-orated. Specifically, the declining trend in the gender gap remains strongly in evidence (t=− 6.44). Also, male researchers are still reporting significantly larger estimates of
Table 3
Meta-Regression Results for Gender Wage Discrimination Estimates, Gj
Sample Original New Combined Combined
Column Study 1 Data 2 Data 3 Data 4
Variables
Intercept 0.2623 (6.27)a −0.0416 (−0.64) 0.2160 (7.02) 0.2280 (6.30)
Year −0.0086 (−4.28) −0.0079 (−6.44) −0.0058 (−3.63) −0.0057 (−3.58)
Male 0.1485 (4.79) 0.3223 (5.47) 0.0685 (3.09) 0.0685 (3.08)
Salary 0.2767 (2.60) 0.1035 (3.06) 0.2477 (8.80) 0.2490 (8.79)
Week 0.2201 (3.26) −0.1764 (−2.84) 0.0847 (2.04) 0.0919 (2.13)
Govt 0.0575 (2.65) 0.0230 (0.60) 0.0430 (1.86) 0.0381 (1.56)
Select −0.1780 (−4.66) 0.0772 (1.94) — −0.0148 (−0.63)
New Ent −0.2650 (−3.53) 0.1768 (2.91) — —
Exp 0.2477 (4.08) −0.0208 (−0.35) — —
Ind −0.0836 (−2.81) 0.0533 (1.05) — —
Dummy 0.0786 (2.59) −0.0817 (−1.94) — —
Wage yr 0.1434 (4.67) −0.0671 (−1.69) — —
Age 0.0608 (2.11) 0.2912 (4.39) — —
n 55 49 104 104
R2 0.807 0.900 0.548 0.550
Standard error 0.073 0.057 0.104 0.104
gender discrimination (t=5.47). On the other hand, the omission of various worker characteristics (for example, Experand Ind) is not as influential on research results as it once was.
Most striking is the large difference in the magnitude of some of the meta-regres-sion coefficients. However, this volatility of the meta-regresmeta-regres-sion coefficients can be understood as the result of multicollinearity in this particular sample of research. For example, all studies that use weekly salaries also fail to correct for selection bias, and no study in this new sample omits both the worker’s age and experience. Although these patterns in themselves do not invalidate regression analysis, they do cause a high degree of multicollinearity and the concomitant inability to estimate individual effects reliably or to distinguish them meaningfully. Clear evidence of multicollinearity is seen by R2 =0.923 for the auxiliary regression of Ageon the remaining independent
variables. This alone expands the variance of the regression coefficients by a factor of 12. Although we cannot know for sure whether multicollinearity alone is the cause of these differences in our MRA estimates, it is sufficient to induce such differences.
It seems that research characteristics are highly related in the new sample and per-haps that their effects interact. However, it is impossible to estimate the effects of the interaction of these research characteristics, because they induce perfect multi-collinearity. Fortunately, multicollinearity is a sample problem, confined largely to this new sample, and not evidenced in either the previous sample of gender research or in the combined sample.
A Chow test comparing these two samples of research confirms that gender research has changed (F13,78 = 11.57). Follow-up tests show that the more recent
research is less likely to calculate hourly wage from annual salaries (χ2
(1) =4.04; p< .05),
more likely to correct for selection bias (χ2
(1) =13.93; p< .01), and less likely to omit
the age of the worker (χ2
(1) =8.58; p< .01). Although these simple tests are not
defin-itive, they are suggestive. Clearly, something about gender research is changing. All of these changes represent positive developments for gender wage research. Stanley and Jarrell (1998) find that omitting a worker’s age causes the gender gap to be over-stated by 8 percent. The failure to correct for selection bias can make a large differ-ence in these estimates, reducing them by approximately 18 percent (Table 3, Column 1). Lastly, using annual salaries is the least defensible, most biasing measure of worker wages. Thus, we find evidence that gender research in economics is changing and improving.
To accommodate all of these research findings, both samples are combined and insignificant moderator variables are dropped, see Table 3, Column 3. The above Chow test implies this area of research has changed; thus, the original model cannot adequately describe the combined research results. Thus, we seek a more parsimo-nious core of research characteristics that exerts a stable influence on gender research findings. The obvious approach is to begin with the original MRA model that suc-cessfully passed a whole battery of specification tests (Stanley and Jarrell 1998). From this model, insignificant research characteristics may be dropped to reveal a stable base and to minimize multicollinearity.
(Charemza and Deadman 1997, p. 78). Hopefully, by systematically testing restric-tions and omitting variables accordingly, the effects of multicollinearity may be mod-erated and the solid core of relevant research characteristics revealed.
In this way, five moderator variables remain significant. This more parsimonious model no longer detects any change in this MRA’s explanation of gender research between the two samples (Chow’s F6,92 =1.36). Although the statistical fit of this
model is not as good as the one reported previously, these five variables still explain over half of the variation among gender discrimination estimates. Also, the central findings that male researchers report larger gender biases and that discrimination esti-mates have a strong downward trend remain. Furthermore, the combined sample shows no signs of multicollinearity, and, as a result, its meta-regression coefficients are more consistent with those of the former study.1Nonetheless, each meta-regression
coefficient is more moderate than those reported in Stanley and Jarrell (1998), perhaps reflecting a regression toward the mean or an expected moderating of research over time as progress is made toward equality.
Neither a changing of research effects nor a moderation of its findings should be surprising. In fact, Goldfarb (1995) suggests that there may be a predictable pattern to changes in research results. First, researchers tend to confirm a theoretically expected effect. Later on, after confirmations have accumulated, contrary findings become more interesting, hence more publishable. Similarly, the gender bias identified by Stanley and Jarrell (1998) might also be expected to diminish or even to reverse. If the pattern of male researchers reporting larger gender discrimination estimates is due to their “bending over backward” to allow the data to express findings contrary to their own potential prejudices, then this pattern might well erode as gender discrimination becomes increasingly well established. In the full sample, the coefficient on Maleis smaller, but remains significantly positive.
Moderation is also seen in the effect of selection bias correction. Stanley and Jarrell (1998) find that correcting for selection bias exerts quite an important influ-ence on a study’s estimate of discrimination, lowering it by approximately 16 per-centage points. Altonji and Blank (1999), however, question the continued relevance of selection with the changing attachment of women to careers and the workforce. “(T)he impact of women’s changing selectivity into the labor market on their wages has not been revisited in recent years. . . . This suggests our older esti-mates of selectivity could be outdated” (Altonji and Blank 1999, p. 3250). Adding
Selectto the combined model reinforces the finding seen in the recent data that cor-recting for selection no longer has a significant negative effect on an author’s esti-mate of discrimination (Table 3, Columns 2 and 4). But then, if gender discrimination were declining, conventional economic theory would predict the diminution of selection effects.
Selection effects arise from the decision of workers to join the labor force, or instead to remain at home. When estimating discrimination, only the wages of
employedworkers can be observed and used. With gender wage discrimination, the market undervalues women’s skills, education, and productivity. Hence, they will “rationally” and disproportionately choose not to enter the labor force. As demonstrated and popularized by Nobel laureate, James Heckman, not accounting for such selection
effects biases regression estimates. If gender wage discrimination is lessening, women have less reason to remain out of the work force, reducing sample selection effects and the associated bias of OLS estimates. Thus, a moderating of selection bias is what one would expect when discrimination is in fact falling. Indirectly, this may confirm the decline of gender wage discrimination.
Surely, this precipitous decline in discrimination estimates cannot be expected to persist indefinitely. Nonetheless, this declining trend of discrimination estimates does persevere—Table 3, Columns 2 and 3. And, as might be expected, the rate of decline has diminished, from nearly 1 percent per year to about three-fifths of a percent per year. Thus, biases, gender wage discrimination, and its rate of decline are all observed to be diminishing, or moderating.
Given that female workers have raised their labor market productivity in recent decades both relative to men and absolutely (Blau 1998 p.136), the gender gap in returns to worker productivity must be declining even more rapidly than our trend estimates. Recall from Equation 2 that Blinder-Oaxaca decomposition estimates gender discrimination as: Gj= Xf(btm−btf). Where Xfis a vector of the average female worker characteristics, btfis the vector of estimated regression coefficients from the sample of female workers, btmis the vector of estimated regression coef-ficients from the sample of male workers, and Gjis the dependent variable of our MRA. The increase of Xfover time implies that gender gap among the rates of return to worker productivity, (btm−btf), must be closing even more rapidly than Gj. The only other explanation is that there has been a closure of the unmeasured skill gap.
This meta-regression model (Table 3, Column 3) may be employed to estimate the current level of gender wage discrimination. Arguably, it will be superior to con-ventional estimates, because it is based upon more information from a richer research base. Best research practice suggests that annual and weekly salaries should not form the basis of discrimination estimates (Salary = 0 and Week = 0); otherwise, gender differences in weeks worked per year or hours worked per week may bias these estimates. Nor should researchers omit government workers (Govt = 0). This leaves only the values of Maleand Yearto be selected. To be gender neu-tral, we use half of the coefficient on Male,which represents the midpoint between the average findings of female researchers and those of male researchers. Lastly, substituting the current year (2003 or Year = 33) into this MRA model estimates gender wage discrimination to be 0.0597, or 6.2 percent of the female wage (com-pared to a value of −1.8 percent from the previous MRA model, Column 1, Table 3). A 95 percent prediction interval for this regression forecast goes from 0.4 per-cent to 12.2 perper-cent. Thus, research on gender wage discrimination still finds sig-nificant discrimination—but not for long at the current rate of decline (0.6 percent per year).
IV. Conclusion
or weekly salaries significantly overestimates discrimination. Thus, it is important to employ hourly wages as the appropriate benchmark.
There seems to be a moderation of gender research. The trend of diminishing discrimination estimates is itself slowing. The biasing effects of researchers’ gen-der and of not correcting for selection bias have also weakened. Although correct-ing for selection bias has become common practice, it seems that changes in the labor market have made it less important. Perhaps, these are the symptoms of a genuine decline in gender wage discrimination and a maturing of gender research in economics.
References
Altonji, Joseph, and Rebecca Blank. 1999. “Race and Gender in the Labor Market.” In
Hand-book of Labor Economics, ed. Orley Ashenfelter and David Card, 3143–3259. Amsterdam: Elsevier.
Ashenfelter, Orley, Colm Harmon, and Hessel Oosterbeek. 1999. “A Review of Estimates of
the Schooling/Earnings Relationship, With Tests for Publication Bias.” Labour Economics
6(4):453–70.
Blau, Francine. 1998. “Trends in the Well-Being of American Women, 1970–1995.” Journal
of Economic Literature36(1):112–65.
Blinder, Alan. 1973. “Wage Discrimination: Reduced Form and Structural Estimates.” Journal
of Human Resources8(4):436–55.
Card, David, and Alan Krueger. 1995. “Time-Series Minimum-Wage Studies: A
Meta-analy-sis.” American Economic Review85(2):238–43.
Charemza, Wojciech, and Derek Deadman. 1997. New Directions in Econometric Practice,
2ndedition. Cheltenham: Russell Edward Elgar.
Davidson, James, David Hendry, Frank Srba, and Stephen Yeo. 1978. “Econometric Modeling of the Aggregate Time-Series Relationship between Consumers’ Expenditures and Income
in the United Kingdom.” Economic Journal88(352):661–92.
Florax, Raymond. 2002. “Methodological Pitfalls in Meta-Analysis: Publication Bias.” In
Comparative Environmental Economic Assessment, ed. Raymond Florax, Peter Nijkamp, and Kenneth Willis, 177–207. Cheltenham: Edward Elgar.
Goldfarb, R. S. 1995. “The Economist-as-Audience Needs a Methodology of Plausible
Infer-ence.” Journal of Economic Methodology2(2):201–22.
Görg, Holger, and Eric Strobl. 2001. “Multinational Companies and Productivity Spillovers:
A Meta-analysis.” Economic Journal111(475):F723–739.
Hunt, Morton. 1997. How Science Takes Stock: The Story of Meta-Analysis. New York:
Rus-sell Sage Foundation.
Oaxaca, Ronald. 1973. “Male-Female Wage Differentials in Urban Labor Markets.”
Interna-tional Economic Review14(3):693–709.
Stanley, T. D. 1998. “New Wine in Old Bottles: A Meta-Analysis of Ricardian Equivalence.”
Southern Economic Journal64(3):713–27.
———. 2001. “Wheat from Chaff: Meta-Analysis as Quantitative Literature Review.” Journal
of Economic Perspectives15(3):131–50.
Stanley, T. D. and Stephen Jarrell. 1989. “Meta-Regression Analysis: A Quantitative Method
of Literature Surveys.” Journal of Economic Surveys3(2):161–70.
———. 1998. “Gender Wage Discrimination Bias? A Meta-Regression Analysis.” Journal of
Human Resources33(4):947–73.
White, Halbert. 1980. “A Heteroskedasticity-Consistent Covariance Matrix and a Direct Test
Meta-Analysis References
Ashraf, Javed. 1996. “Is Gender Pay Discrimination on the Wane? Evidence from Panel Data
1968–1989.” Industrial and Labor Relations Review49(3):537–45.
Blanchflower, David, and Andrew Oswald. 1994. The Wage Curve. Cambridge, Mass.: MIT
Press.
Blau, Francine and Lawrence Kahn. 1995. “The Gender Earnings Gap: Some International
Evidence.” In Differences and Changes in Wage Structure, ed. R. Freeman and L. Katz,
105–143. Chicago: University of Chicago Press.
——— . 1996. “Wage Structure and Gender Earnings Differential: An International
Compari-son.” Economica63(250):S29–S62.
——— . 1997. “Swimming Upstream: Trends in the Gender Wage Differential in the 1980s.”
Journal of Labor Economics15(1):1–42.
Bound, John, and Laura Dresser. 1999. “Losing Ground: The Erosion of the Relative Earnings
of African American Women during the 1980s.” In Latinas and African American Women
at Work: Race, Gender, and Economic Inequality, ed. I. Browne, 61–104. New York: Rus-sell Sage Foundation.
Donohue, Susan. 1997. “Job Satisfaction, Earnings, and Unions: Three Essays on the Role of Gender.” Dissertation. Milwaukee: University of Minnesota-Milwaukee.
Fan, Pi-ling. 1996. “Gender and Wage Attainment at Entry into the Labor Market: Cohort and Racial Comparisons.” Dissertation. Minneapolis: University of Minnesota.
Ghosh, Koushik. 1994. “The Long Run Impact of Early Employment Experience of American Youth.” Dissertation. Seattle: Washington State University.
Gold, Edward. 1993. “Gender Discrimination: Applications to Promotional Discrimination, On-the-Job Investment, and the Hospital/Resident Matching Process.” Dissertation. Rochester: University of Rochester.
Hoffnar, Emily, and Michael Green. 1996. “Gender Discrimination in the Public and Private
Sectors: A Sample Selectivity Approach.” Journal of Socio-Economics25(1):105–14.
Holzer, Harry. 1998. “Employer Skill Demands and Labor Market Outcomes of Blacks and
Women.” Industrial and Labor Relations Review52(1):82–98.
Kim, Hyochung. 1995. “Sex and Earnings Differentials among Home-Based Workers.” Unpublished. Iowa State University.
Kim, Young. 1993. “Deprived, Privileged, or Just Deviated? Unequal Resources and Differen-tials Returns to Resources in Explaining Gender, Race and Sector Differences in Earning Attainment among Young Career Workers.” Dissertation. Southern Illinois University. Moore, Carol. 1994. “Information in the Labor Market: Empirical Studies of Incentive Pay,
Work Hour and Earnings.” Dissertation. University of Texas.
Schweitzer, Mark. 1992. “Sources of Earnings Inequality in the United States: Industry Affili-ations versus Human Capitol Factors (Mobility).” Dissertation. University of California at Los Angles.
Solberg, Eric and Teresa Laughlin. 1995. “The Gender Pay Gap, Fringe Benefits, and