Variabel Lokasi(Hasil try out 30 responden)
Case Processing Summary
N %
Cases
Valid 30 100.0
Excludeda 0 .0
Total 30 100.0
a. Listwise deletion based on all variables in the
procedure.
Reliability Statistics
Cronbach's
Alpha
N of Items
.939 7
Item Statistics
Mean Std. Deviation N
X1_1 3.63 .890 30
X1_2 3.73 .785 30
X1_3 3.83 1.177 30
X1_4 3.73 1.230 30
X1_5 3.83 1.177 30
X1_6 3.60 .932 30
X1_7 3.60 .968 30
Item-Total Statistics
Scale Mean if
Item Deleted
Scale Variance
if Item Deleted
Corrected
Item-Total Correlation
Cronbach's
Alpha if Item
Deleted
X1_1 22.33 30.782 .689 .939
X1_2 22.23 30.875 .790 .933
X1_3 22.13 26.051 .911 .918
X1_4 22.23 25.564 .909 .919
X1_5 22.13 26.120 .904 .919
X1_6 22.37 30.033 .732 .935
Variabel Pelayanan (Hasil try out 30 responden)
Case Processing Summary
N %
Cases
Valid 30 100.0
Excludeda 0 .0
Total 30 100.0
a. Listwise deletion based on all variables in the
procedure.
Reliability Statistics
Cronbach's
Alpha
N of Items
.929 10
Item Statistics
Mean Std. Deviation N
X2_1 3.47 .819 30
X2_2 3.57 .817 30
X2_3 3.50 .861 30
X2_4 3.43 .898 30
X2_5 3.50 .900 30
X2_6 3.43 1.073 30
X2_7 3.43 .774 30
X2_8 3.50 .861 30
X2_9 3.47 .860 30
Item-Total Statistics
Scale Mean if
Item Deleted
Scale Variance
if Item Deleted
Corrected
Item-Total Correlation
Cronbach's
Alpha if Item
Deleted
X2_1 31.33 39.747 .650 .925
X2_2 31.23 40.047 .620 .926
X2_3 31.30 37.872 .804 .917
X2_4 31.37 37.757 .777 .918
X2_5 31.30 38.424 .708 .922
X2_6 31.37 35.689 .803 .917
X2_7 31.37 40.378 .626 .926
X2_8 31.30 38.148 .775 .919
X2_9 31.33 38.023 .789 .918
Variabel Promosi (Hasil try out 30 responden)
Case Processing Summary
N %
Cases
Valid 30 100.0
Excludeda 0 .0
Total 30 100.0
a. Listwise deletion based on all variables in the
procedure.
Reliability Statistics
Cronbach's
Alpha
N of Items
.953 11
Item Statistics
Mean Std. Deviation N
X3_1 3.43 .817 30
X3_2 3.47 .819 30
X3_3 3.53 .973 30
X3_4 3.47 1.074 30
X3_5 3.53 .937 30
X3_6 3.37 1.189 30
X3_7 3.43 .898 30
X3_8 3.50 1.042 30
X3_9 3.67 .922 30
X3_10 3.60 .932 30
Item-Total Statistics
Scale Mean if
Item Deleted
Scale Variance
if Item Deleted
Corrected
Item-Total Correlation
Cronbach's
Alpha if Item
Deleted
X3_1 35.27 65.857 .741 .951
X3_2 35.23 65.082 .802 .949
X3_3 35.17 62.075 .869 .946
X3_4 35.23 60.944 .850 .947
X3_5 35.17 62.971 .841 .947
X3_6 35.33 58.851 .882 .946
X3_7 35.27 63.237 .862 .946
X3_8 35.20 63.407 .715 .952
X3_9 35.03 66.033 .632 .954
X3_10 35.10 63.955 .773 .949
Variabel Keputusan Pembelian (Hasil try out 30 responden)
Case Processing Summary
N %
Cases
Valid 30 100.0
Excludeda 0 .0
Total 30 100.0
a. Listwise deletion based on all variables in the
procedure.
Reliability Statistics
Cronbach's
Alpha
N of Items
.877 6
Item Statistics
Mean Std. Deviation N
Y_1 3.53 .819 30
Item-Total Statistics
Scale Mean if
Item Deleted
Scale Variance
if Item Deleted
Corrected
Item-Total Correlation
Cronbach's
Alpha if Item
Deleted
Y_1 18.53 10.257 .624 .866
Y_2 18.53 9.844 .771 .841
Y_3 18.37 8.861 .826 .829
Y_4 18.27 10.685 .644 .862
Y_5 18.40 10.386 .570 .876
Regression
Descriptive Statistics
Mean Std. Deviation N
Keputusan
Pembelian (Y) 23.00 3.769 98
Lokasi (X1) 26.92 5.811 98
Pelayanan (X2) 37.28 7.397 98
Promosi (X3) 41.80 7.875 98
Variables Entered/Removeda
Model Variables
Entered
Variables
Removed
Method
1
Promosi (X3),
Lokasi (X1),
Pelayanan (X2)b
. Enter
a. Dependent Variable: Keputusan Pembelian (Y)
b. All requested variables entered.
Model Summary
Model R R Square Adjusted R
Square
Std. Error of the
Estimate
1 .845a .713 .704 2.050
a. Predictors: (Constant), Promosi (X3), Lokasi (X1), Pelayanan (X2)
ANOVAa
Model Sum of Squares df Mean Square F Sig.
1
Regression 982.798 3 327.599 77.921 .000b
Residual 395.202 94 4.204
Total 1378.000 97
a. Dependent Variable: Keputusan Pembelian (Y)
Coefficientsa
Model Unstandardized Coefficients Standardized
Coefficients
t Sig.
B Std. Error Beta
1
(Constant) 5.677 1.165 4.875 .000
Lokasi (X1) .187 .061 .289 3.059 .003
Pelayanan (X2) .144 .049 .282 2.944 .004
Promosi (X3) .166 .047 .346 3.497 .001
Frekuensi Indentitas Responden
Statistics
jenis kelamin Usia Pekerjaan
N
Valid 98 98 98
Missing 0 0 0
Frequency Table
jenis kelamin
Frequency Percent Valid Percent Cumulative
Percent
Valid
perempuan 56 57.1 57.1 57.1
Laki-laki 42 42.9 42.9 100.0
Total 98 100.0 100.0
Usia
Frequency Percent Valid Percent Cumulative
Percent
Valid
20-25 tahun 20 20.4 20.4 20.4
26-30 tahun 32 32.7 32.7 53.1
31-40 tahun 20 20.4 20.4 73.5
di atas 40 tahun 26 26.5 26.5 100.0
Pekerjaan
Frequency Percent Valid Percent Cumulative
Percent
Valid
Lain-Lain 24 24.5 24.5 24.5
Karyawan Swasta 35 35.7 35.7 60.2
Wiraswasta/Pedagang 21 21.4 21.4 81.6
Pegawai Negeri 18 18.4 18.4 100.0
Frekuensi variabel Lokasi (X1)
Statistics
N Mean Median Mode Sum
Valid Missing
X1_1 98 0 3.72 4.00 4 365
X1_2 98 0 3.84 4.00 4 376
X1_3 98 0 3.95 4.00 5 387
X1_4 98 0 3.94 4.00 4 386
X1_5 98 0 3.90 4.00 4 382
X1_6 98 0 3.68 4.00 4 361
X1_7 98 0 3.89 4.00 4 381
Lokasi (X1) 98 0 26.92 28.00 32 2638
Frequency Table
X1_1
Frequency Percent Valid Percent Cumulative
Percent
Valid
1 1 1.0 1.0 1.0
2 10 10.2 10.2 11.2
3 22 22.4 22.4 33.7
4 47 48.0 48.0 81.6
5 18 18.4 18.4 100.0
Total 98 100.0 100.0
X1_2
Frequency Percent Valid Percent Cumulative
Percent
Valid
1 1 1.0 1.0 1.0
2 6 6.1 6.1 7.1
3 26 26.5 26.5 33.7
4 40 40.8 40.8 74.5
5 25 25.5 25.5 100.0
X1_3
Frequency Percent Valid Percent Cumulative
Percent
Valid
1 2 2.0 2.0 2.0
2 6 6.1 6.1 8.2
3 23 23.5 23.5 31.6
4 31 31.6 31.6 63.3
5 36 36.7 36.7 100.0
Total 98 100.0 100.0
X1_4
Frequency Percent Valid Percent Cumulative
Percent
Valid
1 4 4.1 4.1 4.1
2 6 6.1 6.1 10.2
3 15 15.3 15.3 25.5
4 40 40.8 40.8 66.3
5 33 33.7 33.7 100.0
Total 98 100.0 100.0
X1_5
Frequency Percent Valid Percent Cumulative
Percent
Valid
1 5 5.1 5.1 5.1
2 4 4.1 4.1 9.2
3 17 17.3 17.3 26.5
4 42 42.9 42.9 69.4
5 30 30.6 30.6 100.0
X1_6
Frequency Percent Valid Percent Cumulative
Percent
Total 98 100.0 100.0
X1_7
Frequency Percent Valid Percent Cumulative
Percent
Total 98 100.0 100.0
Lokasi (X1)
Frequency Percent Valid Percent Cumulative
25 3 3.1 3.1 33.7
26 4 4.1 4.1 37.8
27 7 7.1 7.1 44.9
28 7 7.1 7.1 52.0
29 4 4.1 4.1 56.1
30 9 9.2 9.2 65.3
31 8 8.2 8.2 73.5
32 13 13.3 13.3 86.7
33 5 5.1 5.1 91.8
34 4 4.1 4.1 95.9
35 4 4.1 4.1 100.0
Frekuensi Variabel Pelayanan
Statistics
N Mean Median Mode Sum
Valid Missing
X2_1 98 0 3.66 4.00 4 359
X2_2 98 0 3.66 4.00 4 359
X2_3 98 0 3.69 4.00 4 362
X2_4 98 0 3.83 4.00 4 375
X2_5 98 0 3.65 4.00 4 358
X2_6 98 0 3.73 4.00 4 366
X2_7 98 0 3.81 4.00 4 373
X2_8 98 0 3.73 4.00 4 366
X2_9 98 0 3.82 4.00 4 374
X2_10 98 0 3.68 4.00 4 361
Pelayanan (X2) 98 0 37.28 39.00 40 3653
Frequency Table
X2_1
Frequency Percent Valid Percent Cumulative
Percent
Valid
1 1 1.0 1.0 1.0
2 13 13.3 13.3 14.3
3 19 19.4 19.4 33.7
4 50 51.0 51.0 84.7
5 15 15.3 15.3 100.0
Total 98 100.0 100.0
X2_2
Frequency Percent Valid Percent Cumulative
Percent
Valid
1 1 1.0 1.0 1.0
2 9 9.2 9.2 10.2
3 23 23.5 23.5 33.7
5 11 11.2 11.2 100.0
Total 98 100.0 100.0
X2_3
Frequency Percent Valid Percent Cumulative
Percent
Valid
1 2 2.0 2.0 2.0
2 2 2.0 2.0 4.1
3 29 29.6 29.6 33.7
4 56 57.1 57.1 90.8
5 9 9.2 9.2 100.0
Total 98 100.0 100.0
X2_4
Frequency Percent Valid Percent Cumulative
Percent
Valid
1 4 4.1 4.1 4.1
2 3 3.1 3.1 7.1
3 23 23.5 23.5 30.6
4 44 44.9 44.9 75.5
5 24 24.5 24.5 100.0
Total 98 100.0 100.0
X2_5
Frequency Percent Valid Percent Cumulative
Percent
Valid
1 1 1.0 1.0 1.0
2 14 14.3 14.3 15.3
3 19 19.4 19.4 34.7
4 48 49.0 49.0 83.7
5 16 16.3 16.3 100.0
X2_6
Frequency Percent Valid Percent Cumulative
Percent
Valid
1 3 3.1 3.1 3.1
2 10 10.2 10.2 13.3
3 21 21.4 21.4 34.7
4 40 40.8 40.8 75.5
5 24 24.5 24.5 100.0
Total 98 100.0 100.0
X2_7
Frequency Percent Valid Percent Cumulative
Percent
Valid
1 1 1.0 1.0 1.0
2 2 2.0 2.0 3.1
3 26 26.5 26.5 29.6
4 55 56.1 56.1 85.7
5 14 14.3 14.3 100.0
Total 98 100.0 100.0
X2_8
Frequency Percent Valid Percent Cumulative
Percent
Valid
1 2 2.0 2.0 2.0
2 8 8.2 8.2 10.2
3 17 17.3 17.3 27.6
4 58 59.2 59.2 86.7
5 13 13.3 13.3 100.0
X2_9
Frequency Percent Valid Percent Cumulative
Percent
Total 98 100.0 100.0
X2_10
Frequency Percent Valid Percent Cumulative
Percent
Total 98 100.0 100.0
Pelayanan (X2)
Frequency Percent Valid Percent Cumulative
33 2 2.0 2.0 28.6
34 6 6.1 6.1 34.7
35 5 5.1 5.1 39.8
37 5 5.1 5.1 44.9
38 4 4.1 4.1 49.0
39 3 3.1 3.1 52.0
40 10 10.2 10.2 62.2
41 3 3.1 3.1 65.3
42 1 1.0 1.0 66.3
43 8 8.2 8.2 74.5
44 9 9.2 9.2 83.7
45 8 8.2 8.2 91.8
46 4 4.1 4.1 95.9
49 4 4.1 4.1 100.0
Total 98 100.0 100.0
Frekuensi Variabel Promosi
Statistics
N Mean Median Mode Sum
Valid Missing
X3_1 98 0 3.85 4.00 4 377
X3_2 98 0 3.81 4.00 4 373
X3_3 98 0 3.71 4.00 4 364
X3_4 98 0 3.79 4.00 4 371
X3_5 98 0 3.88 4.00 4 380
X3_6 98 0 3.73 4.00 4 366
X3_7 98 0 3.72 4.00 4 365
X3_8 98 0 3.76 4.00 4 368
X3_9 98 0 3.90 4.00 4 382
X3_10 98 0 3.72 4.00 4 365
X3_11 98 0 3.93 4.00 4 385
Frequency Table
X3_1
Frequency Percent Valid Percent Cumulative
Percent
Valid
1 1 1.0 1.0 1.0
2 4 4.1 4.1 5.1
3 24 24.5 24.5 29.6
4 49 50.0 50.0 79.6
5 20 20.4 20.4 100.0
Total 98 100.0 100.0
X3_2
Frequency Percent Valid Percent Cumulative
Percent
Valid
1 1 1.0 1.0 1.0
2 5 5.1 5.1 6.1
3 27 27.6 27.6 33.7
4 44 44.9 44.9 78.6
5 21 21.4 21.4 100.0
Total 98 100.0 100.0
X3_3
Frequency Percent Valid Percent Cumulative
Percent
Valid
1 1 1.0 1.0 1.0
2 6 6.1 6.1 7.1
3 26 26.5 26.5 33.7
4 52 53.1 53.1 86.7
5 13 13.3 13.3 100.0
X3_4
Frequency Percent Valid Percent Cumulative
Percent
Valid
1 2 2.0 2.0 2.0
2 7 7.1 7.1 9.2
3 23 23.5 23.5 32.7
4 44 44.9 44.9 77.6
5 22 22.4 22.4 100.0
Total 98 100.0 100.0
X3_5
Frequency Percent Valid Percent Cumulative
Percent
Valid
1 2 2.0 2.0 2.0
2 6 6.1 6.1 8.2
3 18 18.4 18.4 26.5
4 48 49.0 49.0 75.5
5 24 24.5 24.5 100.0
Total 98 100.0 100.0
X3_6
Frequency Percent Valid Percent Cumulative
Percent
Valid
1 3 3.1 3.1 3.1
2 10 10.2 10.2 13.3
3 23 23.5 23.5 36.7
4 36 36.7 36.7 73.5
5 26 26.5 26.5 100.0
X3_7
Frequency Percent Valid Percent Cumulative
Percent
Valid
1 2 2.0 2.0 2.0
2 7 7.1 7.1 9.2
3 20 20.4 20.4 29.6
4 56 57.1 57.1 86.7
5 13 13.3 13.3 100.0
Total 98 100.0 100.0
X3_8
Frequency Percent Valid Percent Cumulative
Percent
Valid
1 3 3.1 3.1 3.1
2 6 6.1 6.1 9.2
3 17 17.3 17.3 26.5
4 58 59.2 59.2 85.7
5 14 14.3 14.3 100.0
Total 98 100.0 100.0
X3_9
Frequency Percent Valid Percent Cumulative
Percent
Valid
1 1 1.0 1.0 1.0
2 3 3.1 3.1 4.1
3 22 22.4 22.4 26.5
4 51 52.0 52.0 78.6
5 21 21.4 21.4 100.0
X3_10
Frequency Percent Valid Percent Cumulative
Percent
Total 98 100.0 100.0
X3_11
Frequency Percent Valid Percent Cumulative
Percent
Total 98 100.0 100.0
Promosi (X3)
Frequency Percent Valid Percent Cumulative
39 4 4.1 4.1 33.7
40 1 1.0 1.0 34.7
41 5 5.1 5.1 39.8
42 7 7.1 7.1 46.9
43 8 8.2 8.2 55.1
44 8 8.2 8.2 63.3
45 1 1.0 1.0 64.3
46 3 3.1 3.1 67.3
47 4 4.1 4.1 71.4
48 4 4.1 4.1 75.5
49 8 8.2 8.2 83.7
50 1 1.0 1.0 84.7
51 5 5.1 5.1 89.8
52 9 9.2 9.2 99.0
53 1 1.0 1.0 100.0
Frekuensi Variabel Keputusan Pembelian
Statistics
N Mean Median Mode Sum
Valid Missing
Y_1 98 0 3.72 4.00 4 365
Y_2 98 0 3.76 4.00 4 368
Y_3 98 0 3.84 4.00 4 376
Y_4 98 0 3.91 4.00 4 383
Y_5 98 0 3.85 4.00 4 377
Y_6 98 0 3.93 4.00 4 385
Kinerja (Y) 98 0 23.00 24.00 26 2254
Frequency Table
Y_1
Frequency Percent Valid Percent Cumulative
Percent
Valid
1 2 2.0 2.0 2.0
2 6 6.1 6.1 8.2
3 12 12.2 12.2 20.4
4 75 76.5 76.5 96.9
5 3 3.1 3.1 100.0
Total 98 100.0 100.0
Y_2
Frequency Percent Valid Percent Cumulative
Percent
Valid
1 1 1.0 1.0 1.0
2 6 6.1 6.1 7.1
3 16 16.3 16.3 23.5
4 68 69.4 69.4 92.9
5 7 7.1 7.1 100.0
Y_3
Frequency Percent Valid Percent Cumulative
Percent
Valid
1 1 1.0 1.0 1.0
2 5 5.1 5.1 6.1
3 27 27.6 27.6 33.7
4 41 41.8 41.8 75.5
5 24 24.5 24.5 100.0
Total 98 100.0 100.0
Y_4
Frequency Percent Valid Percent Cumulative
Percent
Valid
1 2 2.0 2.0 2.0
2 3 3.1 3.1 5.1
3 25 25.5 25.5 30.6
4 40 40.8 40.8 71.4
5 28 28.6 28.6 100.0
Total 98 100.0 100.0
Y_5
Frequency Percent Valid Percent Cumulative
Percent
Valid
1 1 1.0 1.0 1.0
2 4 4.1 4.1 5.1
3 18 18.4 18.4 23.5
4 61 62.2 62.2 85.7
5 14 14.3 14.3 100.0
Y_6
Frequency Percent Valid Percent Cumulative
Percent
Valid
1 2 2.0 2.0 2.0
2 3 3.1 3.1 5.1
3 12 12.2 12.2 17.3
4 64 65.3 65.3 82.7
5 17 17.3 17.3 100.0
Total 98 100.0 100.0
Kinerja (Y)
Frequency Percent Valid Percent Cumulative
Percent
Valid
11 1 1.0 1.0 1.0
14 3 3.1 3.1 4.1
15 3 3.1 3.1 7.1
16 1 1.0 1.0 8.2
17 3 3.1 3.1 11.2
18 2 2.0 2.0 13.3
19 5 5.1 5.1 18.4
20 3 3.1 3.1 21.4
21 4 4.1 4.1 25.5
22 11 11.2 11.2 36.7
23 7 7.1 7.1 43.9
24 11 11.2 11.2 55.1
25 12 12.2 12.2 67.3
26 20 20.4 20.4 87.8
27 9 9.2 9.2 96.9
28 3 3.1 3.1 100.0
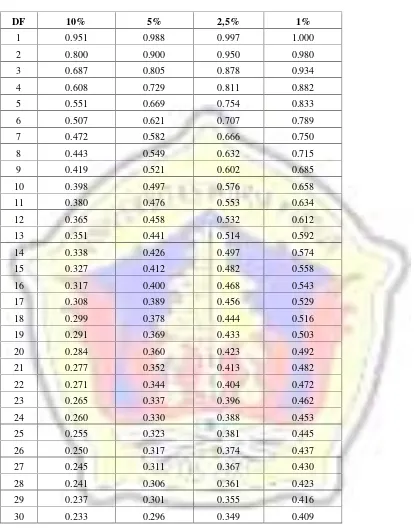
TABEL R
DF 10% 5% 2,5% 1%
1 0.951 0.988 0.997 1.000
2 0.800 0.900 0.950 0.980
3 0.687 0.805 0.878 0.934
4 0.608 0.729 0.811 0.882
5 0.551 0.669 0.754 0.833
6 0.507 0.621 0.707 0.789
7 0.472 0.582 0.666 0.750
8 0.443 0.549 0.632 0.715
9 0.419 0.521 0.602 0.685
10 0.398 0.497 0.576 0.658
11 0.380 0.476 0.553 0.634
12 0.365 0.458 0.532 0.612
13 0.351 0.441 0.514 0.592
14 0.338 0.426 0.497 0.574
15 0.327 0.412 0.482 0.558
16 0.317 0.400 0.468 0.543
17 0.308 0.389 0.456 0.529
18 0.299 0.378 0.444 0.516
19 0.291 0.369 0.433 0.503
20 0.284 0.360 0.423 0.492
21 0.277 0.352 0.413 0.482
22 0.271 0.344 0.404 0.472
23 0.265 0.337 0.396 0.462
24 0.260 0.330 0.388 0.453
25 0.255 0.323 0.381 0.445
26 0.250 0.317 0.374 0.437
27 0.245 0.311 0.367 0.430
28 0.241 0.306 0.361 0.423
29 0.237 0.301 0.355 0.416
DF 10% 5% 2,5% 1%
91 0.134 0.172 0.204 0.241
92 0.133 0.171 0.203 0.240
93 0.133 0.170 0.202 0.238
94 0.132 0.169 0.201 0.237
95 0.131 0.168 0.200 0.236
96 0.131 0.167 0.199 0.235
97 0.130 0.166 0.198 0.234
98 0.129 0.165 0.197 0.232
99 0.129 0.165 0.196 0.231
100 0.128 0.164 0.195 0.230
101 0.127 0.163 0.194 0.229
102 0.127 0.162 0.193 0.228
103 0.126 0.161 0.192 0.227
104 0.125 0.161 0.191 0.226
105 0.125 0.160 0.190 0.225
106 0.124 0.159 0.189 0.224
107 0.124 0.158 0.188 0.223
108 0.123 0.158 0.187 0.222
109 0.123 0.157 0.187 0.221
110 0.122 0.156 0.186 0.220
111 0.121 0.156 0.185 0.219
112 0.121 0.155 0.184 0.218
113 0.120 0.154 0.183 0.217
114 0.120 0.153 0.182 0.216
115 0.119 0.153 0.182 0.215
116 0.119 0.152 0.181 0.214
117 0.118 0.152 0.180 0.213
118 0.118 0.151 0.179 0.212
119 0.117 0.150 0.179 0.211
Cuplikan Tabel Distribusi t (satu sisi)
No 10% 5% 2,5%
91 1.291 1.662 1.986
92 1.291 1.662 1.986
93 1.291 1.661 1.986
94 1.291 1.661 1.986
95 1.291 1.661 1.985
96 1.290 1.661 1.985
97 1.290 1.661 1.985
98 1.290 1.661 1.984
99 1.290 1.660 1.984
100 1.290 1.660 1.984
101 1.290 1.660 1.984
102 1.290 1.660 1.983
103 1.290 1.660 1.983
104 1.290 1.660 1.983
105 1.290 1.659 1.983
106 1.290 1.659 1.983
107 1.290 1.659 1.982
108 1.289 1.659 1.982
109 1.289 1.659 1.982
110 1.289 1.659 1.982
111 1.289 1.659 1.982
112 1.289 1.659 1.981
113 1.289 1.658 1.981
114 1.289 1.658 1.981
115 1.289 1.658 1.981
116 1.289 1.658 1.981
117 1.289 1.658 1.980
118 1.289 1.658 1.980
119 1.289 1.658 1.980
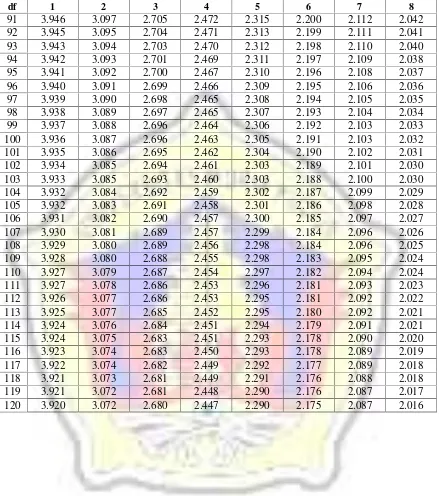
Tabel F untuk
= 0.05
df 1 2 3 4 5 6 7 8