TRY OUT 25 Responden Variabel Kepuasan / x1
Case Processing Summary
N %
Cases
Valid 25 100.0
Excludeda 0 .0
Total 25 100.0
a. Listwise deletion based on all variables in the procedure.
Reliability Statistics
Cronbach's Alpha
N of Items
.819 6
Item Statistics
Mean Std. Deviation N
x1_1 4.44 .583 25
x1_2 3.12 1.201 25
x1_3 4.04 1.020 25
x1_4 3.88 .927 25
x1_5 3.56 1.356 25
Item-Total Statistics
Scale Mean if Item Deleted
Scale Variance if Item Deleted
Corrected Item-Total Correlation
Cronbach's Alpha if Item
Deleted
x1_1 18.88 15.110 .631 .797
x1_2 20.20 11.250 .697 .764
x1_3 19.28 13.210 .548 .798
x1_4 19.44 13.257 .621 .783
x1_5 19.76 10.607 .664 .781
TRY OUT 25 Responden Variabel komitmen / x2
Case Processing Summary
N %
Cases
Valid 25 100.0
Excludeda 0 .0
Total 25 100.0
a. Listwise deletion based on all variables in the procedure.
Reliability Statistics
Cronbach's Alpha
N of Items
.883 6
Item Statistics
Mean Std. Deviation N
x2_1 4.08 .862 25
x2_2 3.44 .917 25
x2_3 3.76 .926 25
x2_4 4.00 .707 25
x2_5 3.76 1.052 25
Item-Total Statistics
Scale Mean if Item Deleted
Scale Variance if Item Deleted
Corrected Item-Total Correlation
Cronbach's Alpha if Item
Deleted
x2_1 18.84 13.223 .682 .864
x2_2 19.48 13.510 .578 .881
x2_3 19.16 11.973 .845 .836
x2_4 18.92 14.410 .621 .875
x2_5 19.16 11.890 .723 .859
TRY OUT 25 Responden Variabel OCB / y
Case Processing Summary
N %
Cases
Valid 25 100.0
Excludeda 0 .0
Total 25 100.0
a. Listwise deletion based on all variables in the procedure.
Reliability Statistics
Cronbach's Alpha
N of Items
.952 10
Item Statistics
Mean Std. Deviation N
Y_1 3.76 .831 25
Y_2 3.72 .678 25
Y_3 3.64 .860 25
Y_4 3.56 .870 25
Y_5 3.52 1.005 25
Y_6 3.68 1.030 25
Y_7 3.52 .770 25
Y_8 3.56 .821 25
Y_9 3.64 .907 25
Item-Total Statistics
Scale Mean if Item Deleted
Scale Variance if Item Deleted
Corrected Item-Total Correlation
Cronbach's Alpha if Item
Deleted
Y_1 32.52 43.093 .742 .949
Y_2 32.56 44.590 .754 .949
Y_3 32.64 42.407 .779 .947
Y_4 32.72 41.877 .821 .945
Y_5 32.76 40.357 .823 .945
Y_6 32.60 40.083 .823 .946
Y_7 32.76 44.357 .675 .951
Y_8 32.72 42.127 .852 .944
Y_9 32.64 40.907 .874 .943
Descriptive Statistics
Mean Std. Deviation N
OCB (Y) 40.38 5.105 80
Kepuasan Kerja (X1) 23.06 3.902 80
Komitmen (X2) 23.41 3.521 80
Correlations
OCB (Y) Kepuasan Kerja (X1)
Komitmen (X2)
Pearson Correlation
OCB (Y) 1.000 .576 .582
Kepuasan Kerja (X1) .576 1.000 .478
Komitmen (X2) .582 .478 1.000
Sig. (1-tailed)
OCB (Y) . .000 .000
Kepuasan Kerja (X1) .000 . .000
Komitmen (X2) .000 .000 .
N
OCB (Y) 80 80 80
Kepuasan Kerja (X1) 80 80 80
Variables Entered/Removeda
Model Variables Entered
Variables Removed
Method
1
Komitmen (X2), Kepuasan Kerja (X1)b
. Enter
a. Dependent Variable: OCB (Y) b. All requested variables entered.
Model Summary
Model R R Square Adjusted R Square
Std. Error of the Estimate
1 .674a .454 .440 3.820
a. Predictors: (Constant), Komitmen (X2), Kepuasan Kerja (X1)
ANOVAa
Model Sum of Squares df Mean Square F Sig.
1
Regression 934.919 2 467.460 32.028 .000b
Residual 1123.831 77 14.595
Total 2058.750 79
a. Dependent Variable: OCB (Y)
Coefficientsa
Model Unstandardized Coefficients Standardized Coefficients
t Sig.
B Std. Error Beta
1
(Constant) 15.225 3.184 4.782 .000
Kepuasan Kerja (X1) .506 .125 .386 4.032 .000
Komitmen (X2) .576 .139 .397 4.145 .000
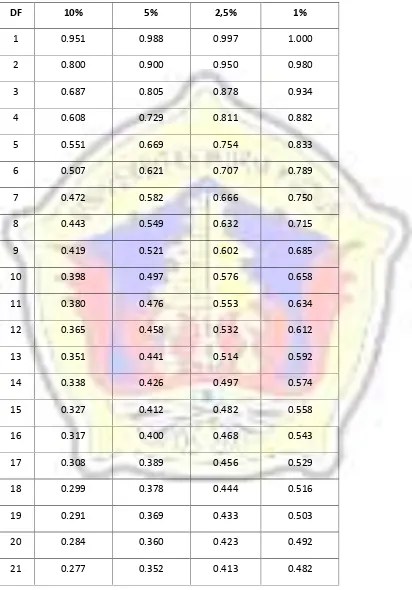
TABEL R
DF
10%
5%
2,5%
1%
1
0.951
0.988
0.997
1.000
2
0.800
0.900
0.950
0.980
3
0.687
0.805
0.878
0.934
4
0.608
0.729
0.811
0.882
5
0.551
0.669
0.754
0.833
6
0.507
0.621
0.707
0.789
7
0.472
0.582
0.666
0.750
8
0.443
0.549
0.632
0.715
9
0.419
0.521
0.602
0.685
10
0.398
0.497
0.576
0.658
11
0.380
0.476
0.553
0.634
12
0.365
0.458
0.532
0.612
13
0.351
0.441
0.514
0.592
14
0.338
0.426
0.497
0.574
15
0.327
0.412
0.482
0.558
16
0.317
0.400
0.468
0.543
17
0.308
0.389
0.456
0.529
18
0.299
0.378
0.444
0.516
19
0.291
0.369
0.433
0.503
20
0.284
0.360
0.423
0.492
22
0.271
0.344
0.404
0.472
23
0.265
0.337
0.396
0.462
24
0.260
0.330
0.388
0.453
25
0.255
0.323
0.381
0.445
26
0.250
0.317
0.374
0.437
27
0.245
0.311
0.367
0.430
28
0.241
0.306
0.361
0.423
29
0.237
0.301
0.355
0.416
Cuplikan Tabel Distribusi t
0
No
10%
5%
2,5%
71
1.294
1.667
1.994
72
1.293
1.666
1.993
73
1.293
1.666
1.993
74
1.293
1.666
1.993
75
1.293
1.665
1.992
76
1.293
1.665
1.992
77
1.293
1.665
1.991
78
1.292
1.665
1.991
79
1.292
1.664
1.990
80
1.292
1.664
1.990
81
1.292
1.664
1.990
82
1.292
1.664
1.989
83
1.292
1.663
1.989
84
1.292
1.663
1.989
85
1.292
1.663
1.988
86
1.291
1.663
1.988
87
1.291
1.663
1.988
89
1.291
1.662
1.987
90
1.291
1.662
1.987
91
1.291
1.662
1.986
92
1.291
1.662
1.986
93
1.291
1.661
1.986
94
1.291
1.661
1.986
95
1.291
1.661
1.985
96
1.290
1.661
1.985
97
1.290
1.661
1.985
98
1.290
1.661
1.984
99
1.290
1.660
1.984
Tabel F untuk
= 0.05
0
df
1
2
3
4
5
6
7
8
71
3.976
3.126
2.734
2.501
2.344
2.229
2.142
2.072
72
3.974
3.124
2.732
2.499
2.342
2.227
2.140
2.070
73
3.972
3.122
2.730
2.497
2.340
2.226
2.138
2.068
74
3.970
3.120
2.728
2.495
2.338
2.224
2.136
2.066
75
3.968
3.119
2.727
2.494
2.337
2.222
2.134
2.064
76
3.967
3.117
2.725
2.492
2.335
2.220
2.133
2.063
77
3.965
3.115
2.723
2.490
2.333
2.219
2.131
2.061
78
3.963
3.114
2.722
2.489
2.332
2.217
2.129
2.059
79
3.962
3.112
2.720
2.487
2.330
2.216
2.128
2.058
80
3.960
3.111
2.719
2.486
2.329
2.214
2.126
2.056
81
3.959
3.109
2.717
2.484
2.327
2.213
2.125
2.055
82
3.957
3.108
2.716
2.483
2.326
2.211
2.123
2.053
83
3.956
3.107
2.715
2.482
2.324
2.210
2.122
2.052
84
3.955
3.105
2.713
2.480
2.323
2.209
2.121
2.051
85
3.953
3.104
2.712
2.479
2.322
2.207
2.119
2.049
86
3.952
3.103
2.711
2.478
2.321
2.206
2.118
2.048
88
3.949
3.100
2.708
2.475
2.318
2.203
2.115
2.045
89
3.948
3.099
2.707
2.474
2.317
2.202
2.114
2.044
90
3.947
3.098
2.706
2.473
2.316
2.201
2.113
2.043
91
3.946
3.097
2.705
2.472
2.315
2.200
2.112
2.042
92
3.945
3.095
2.704
2.471
2.313
2.199
2.111
2.041
93
3.943
3.094
2.703
2.470
2.312
2.198
2.110
2.040
94
3.942
3.093
2.701
2.469
2.311
2.197
2.109
2.038
95
3.941
3.092
2.700
2.467
2.310
2.196
2.108
2.037
96
3.940
3.091
2.699
2.466
2.309
2.195
2.106
2.036
97
3.939
3.090
2.698
2.465
2.308
2.194
2.105
2.035
98
3.938
3.089
2.697
2.465
2.307
2.193
2.104
2.034
99
3.937
3.088
2.696
2.464
2.306
2.192
2.103
2.033
FREKUENSI IDENTITAS RESPONDEN
Statistics
Jenis Kelamin Usia Pendidikan Masa Kerja
N
Valid 80 80 80 80
Missing 0 0 0 0
Mean 1.61 2.15 2.34 3.01
Median 2.00 2.00 3.00 3.00
Mode 2 2 3 3
Sum 129 172 187 241
Frequency Table
Jenis Kelamin
Frequency Percent Valid Percent Cumulative Percent
Valid
Pria 31 38.8 38.8 38.8
Wanita 49 61.3 61.3 100.0
Usia
Frequency Percent Valid Percent Cumulative Percent
Valid
20 - 35 th 15 18.8 18.8 18.8
35 - 45 th 38 47.5 47.5 66.3
di atas 45 th 27 33.8 33.8 100.0
Total 80 100.0 100.0
Pendidikan
Frequency Percent Valid Percent Cumulative Percent
Valid
SLTA/sederajat 17 21.3 21.3 21.3
Diploma 19 23.8 23.8 45.0
S1 44 55.0 55.0 100.0
Total 80 100.0 100.0
Masa Kerja
Frequency Percent Valid Percent Cumulative Percent
FREKUENSI VARIABEL KEPUASAN KERJA
Statistics
N Mean Median Mode Sum
Valid Missing
x1_1 80 0 4.43 5.00 5 354
x1_2 80 0 3.08 3.00 2 246
x1_3 80 0 4.06 4.00 4 325
x1_4 80 0 3.98 4.00 4 318
x1_5 80 0 3.38 4.00 5 270
x1_6 80 0 4.15 4.00 4 332
Kepuasan Kerja (X1) 80 0 23.06 24.00 24 1845
Frequency Table
x1_1
Frequency Percent Valid Percent Cumulative Percent
Valid
1 1 1.3 1.3 1.3
2 1 1.3 1.3 2.5
3 2 2.5 2.5 5.0
4 35 43.8 43.8 48.8
5 41 51.3 51.3 100.0
x1_2
Frequency Percent Valid Percent Cumulative Percent
Valid
1 4 5.0 5.0 5.0
2 33 41.3 41.3 46.3
3 6 7.5 7.5 53.8
4 27 33.8 33.8 87.5
5 10 12.5 12.5 100.0
Total 80 100.0 100.0
x1_3
Frequency Percent Valid Percent Cumulative Percent
Valid
1 1 1.3 1.3 1.3
2 5 6.3 6.3 7.5
3 1 1.3 1.3 8.8
4 54 67.5 67.5 76.3
5 19 23.8 23.8 100.0
x1_4
Frequency Percent Valid Percent Cumulative Percent
Valid
1 1 1.3 1.3 1.3
2 2 2.5 2.5 3.8
3 6 7.5 7.5 11.3
4 60 75.0 75.0 86.3
5 11 13.8 13.8 100.0
Total 80 100.0 100.0
x1_5
Frequency Percent Valid Percent Cumulative Percent
Valid
1 9 11.3 11.3 11.3
2 17 21.3 21.3 32.5
3 11 13.8 13.8 46.3
4 21 26.3 26.3 72.5
5 22 27.5 27.5 100.0
x1_6
Frequency Percent Valid Percent Cumulative Percent
Total 80 100.0 100.0
Kepuasan Kerja (X1)
23 2 2.5 2.5 42.5
24 14 17.5 17.5 60.0
25 6 7.5 7.5 67.5
26 9 11.3 11.3 78.8
27 8 10.0 10.0 88.8
28 8 10.0 10.0 98.8
30 1 1.3 1.3 100.0
FREKUENSI VARIABEL KOMITMEN ORGANISASI
Statistics
N Mean Median Mode Sum
Valid Missing
x2_1 80 0 4.11 4.00 4 329
x2_2 80 0 3.53 3.50 3 282
x2_3 80 0 3.81 4.00 4 305
x2_4 80 0 4.08 4.00 4 326
x2_5 80 0 3.90 4.00 4 312
x2_6 80 0 3.99 4.00 4 319
Komitmen (X2) 80 0 23.41 23.00 22 1873
Frequency Table
x2_1
Frequency Percent Valid Percent Cumulative Percent
Valid
1 1 1.3 1.3 1.3
2 2 2.5 2.5 3.8
3 11 13.8 13.8 17.5
4 39 48.8 48.8 66.3
5 27 33.8 33.8 100.0
x2_2
Frequency Percent Valid Percent Cumulative Percent
Valid
1 1 1.3 1.3 1.3
2 11 13.8 13.8 15.0
3 28 35.0 35.0 50.0
4 25 31.3 31.3 81.3
5 15 18.8 18.8 100.0
Total 80 100.0 100.0
x2_3
Frequency Percent Valid Percent Cumulative Percent
Valid
1 1 1.3 1.3 1.3
2 3 3.8 3.8 5.0
3 19 23.8 23.8 28.8
4 44 55.0 55.0 83.8
5 13 16.3 16.3 100.0
x2_4
Frequency Percent Valid Percent Cumulative Percent
Valid
1 1 1.3 1.3 1.3
2 2 2.5 2.5 3.8
3 4 5.0 5.0 8.8
4 56 70.0 70.0 78.8
5 17 21.3 21.3 100.0
Total 80 100.0 100.0
x2_5
Frequency Percent Valid Percent Cumulative Percent
Valid
1 1 1.3 1.3 1.3
2 2 2.5 2.5 3.8
3 18 22.5 22.5 26.3
4 42 52.5 52.5 78.8
5 17 21.3 21.3 100.0
x2_6
Frequency Percent Valid Percent Cumulative Percent
Total 80 100.0 100.0
Komitmen (X2)
26 5 6.3 6.3 78.8
27 8 10.0 10.0 88.8
28 4 5.0 5.0 93.8
29 4 5.0 5.0 98.8
30 1 1.3 1.3 100.0
FREKUENSI VARIABEL
ORGANIZATIONAL CITIZENSHIP BEHAVIOR
Statistics
N Mean Median Mode Sum
Valid Missing
Y_1 80 0 4.08 4.00 4 326
Y_2 80 0 4.11 4.00 4 329
Y_3 80 0 3.99 4.00 4 319
Y_4 80 0 4.19 4.00 4 335
Y_5 80 0 4.08 4.00 4 326
Y_6 80 0 4.21 4.00 4 337
Y_7 80 0 4.19 4.00 4 335
Y_8 80 0 4.30 4.00 4a 344
Y_9 80 0 3.46 4.00 4 277
Y_10 80 0 3.78 4.00 4 302
OCB (Y) 80 0 40.38 42.00 42 3230
Frequency Table
Y_1
Frequency Percent Valid Percent Cumulative Percent
Valid
1 1 1.3 1.3 1.3
2 1 1.3 1.3 2.5
3 5 6.3 6.3 8.8
4 57 71.3 71.3 80.0
5 16 20.0 20.0 100.0
Total 80 100.0 100.0
Y_2
Frequency Percent Valid Percent Cumulative Percent
Valid
1 1 1.3 1.3 1.3
2 1 1.3 1.3 2.5
3 9 11.3 11.3 13.8
4 46 57.5 57.5 71.3
5 23 28.8 28.8 100.0
Y_3
Frequency Percent Valid Percent Cumulative Percent
Valid
1 2 2.5 2.5 2.5
2 1 1.3 1.3 3.8
3 8 10.0 10.0 13.8
4 54 67.5 67.5 81.3
5 15 18.8 18.8 100.0
Total 80 100.0 100.0
Y_4
Frequency Percent Valid Percent Cumulative Percent
Valid
1 1 1.3 1.3 1.3
2 1 1.3 1.3 2.5
3 5 6.3 6.3 8.8
4 48 60.0 60.0 68.8
5 25 31.3 31.3 100.0
Y_5
Frequency Percent Valid Percent Cumulative Percent
Valid
1 1 1.3 1.3 1.3
2 1 1.3 1.3 2.5
3 4 5.0 5.0 7.5
4 59 73.8 73.8 81.3
5 15 18.8 18.8 100.0
Total 80 100.0 100.0
Y_6
Frequency Percent Valid Percent Cumulative Percent
Valid
1 1 1.3 1.3 1.3
2 2 2.5 2.5 3.8
3 5 6.3 6.3 10.0
4 43 53.8 53.8 63.8
5 29 36.3 36.3 100.0
Y_7
Frequency Percent Valid Percent Cumulative Percent
Valid
1 1 1.3 1.3 1.3
2 1 1.3 1.3 2.5
3 2 2.5 2.5 5.0
4 54 67.5 67.5 72.5
5 22 27.5 27.5 100.0
Total 80 100.0 100.0
Y_8
Frequency Percent Valid Percent Cumulative Percent
Valid
1 1 1.3 1.3 1.3
2 2 2.5 2.5 3.8
3 5 6.3 6.3 10.0
4 36 45.0 45.0 55.0
5 36 45.0 45.0 100.0
Y_9
Frequency Percent Valid Percent Cumulative Percent
Valid
1 6 7.5 7.5 7.5
2 19 23.8 23.8 31.3
3 3 3.8 3.8 35.0
4 36 45.0 45.0 80.0
5 16 20.0 20.0 100.0
Total 80 100.0 100.0
Y_10
Frequency Percent Valid Percent Cumulative Percent
Valid
1 1 1.3 1.3 1.3
2 2 2.5 2.5 3.8
3 22 27.5 27.5 31.3
4 44 55.0 55.0 86.3
5 11 13.8 13.8 100.0
OCB (Y)
Frequency Percent Valid Percent Cumulative Percent