JOURNAL OF GREEN SCIENCE AND TECHNOLOGY
ANALYSIS OF IMPROVEMENT ROAD PALIMANAN
–
KRAMAT
SECTION CIREBON REGENCY
Mustakim*, Martinus Agus S**
*) Student of Civil Engineering Major, Faculty of Engineering, University of Swadaya Gunung Jati Cirebon **) Lecturer of Civil Engineering Major, Faculty of Engineering, University of Swadaya Gunung Jati Cirebon
ABSTRACT
Cirebon Regency has a good potential of both in trading and service. So, the roads should contribute to support the driving to comfort for road users. Palimanan – Kramat road is one of the access roads to Regency Cirebon. Along the way Palimanan - Kramat majority to be a place of business. Along Palimanan – Kramat road is a lot of structural damage such as potholes, cracked lengthwise and there is also almost the entire surface of the asphalt peeling. All this happened was possible because the line was often traversed by vehicles such as dump trucks which overload. The purpose of this study is to solve the damage to the road by means of the overlay. The method which is used in this study is a survey method in the location of the Overlay Palimanan – Kramat Road. Analysis of the data which is used are the Summary of Traffic Volume, Volume Peak Hour Traffic, Highway Capacity Analysis, Traffic Growth, Calculation of Pavement Thickness. The results of the study explained that the capacity of the vehicle on roads this time is at 1450 pcu/h, the degree of saturation of 0.3 into the current level of service B that is stable, high capacity most vehicles via this road for 378 pcu/hour. From these results, the road quite smoothly enough so that it can be concluded that the vehicles passing dominated by heavy vehicles with a load of overload which caused damage to the road and the re-layer thickness of 11 cm. Therefore, to note the level of vehicle load so as not to overload the structure of the pavement.
I. INTRODUCTION 1.1. Background
Cirebon Regency is a regency potential in trade and services. So that road in the district of Cirebon has to participate and support the driving comfort for road users. Palimanan road - Kramat is one of the access roads to Cirebon. Along the Way Palimanan - Kramat majority to be a place of business. There are markets, restaurants, mini market, schools, manufacturers granite and others.
This road also becomes an alternative route for road users of directions Brass or Central Java who want to go to Jakarta or Bandung without going through the north coast. By passing the sea Sindang - Caracas then passes Mandirancan - Source and direction Source - Majalengka. Then the track conditions Palimanan - this Kramat - should be good to road users can shorten the distance on the go.
Along roads Palimanan - Kramat is a lot of structural damage such as potholes, cracked lengthwise and there is also almost the entire surface of the asphalt peeling. All this happened was possible because the line was often traversed by vehicles such as dump trucks laden overload. Based on the aforementioned problems the authors are interested in creating a thesis entitled "Analysis of ImprovementRoad Section Palimanan - Kramat Cirebon Regency".
1.2. Limitations
This Thesis, Writer focus problems on Road Improvement Analysis on Palimanan – Kramat Road.
1.3. Problem Formulation
The problem that exists today is a pavement suffered considerable damage. For that we need to know:
1. How is thick extra layer which needed?
1.4. Research Objective
Pavement structures Improving these roads so that traffic flow more smoothly and safely, so, that it can generate growth in the surrounding area. Also, addressing road damage by doing an overlay.
1.5.
Usefulness Research
1. For consideration in evaluating damage assessment locations.
2. Expected to be a recommendation to the Government of Cirebon to improve roads in the area in question.
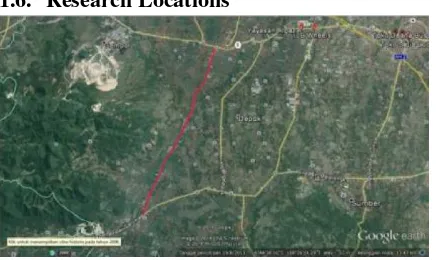
1.6. Research Locations
Figure1. Research Sites
Palimanan - Kramat Road has a functional length of 7.3 km. These segments across four (4) villages namely Balad and Panongan village located in Palimanan District, then Kepuh village and Dukupuntang village in the Dukupuntang District.
II. LITERATURE REVIEW 2.1. Types and Pavement Layer Function
Type surface layer should be waterproof and have high stability to support the weight of the wheels during the service. Common types of surfaces used in Indonesia is as follows:
Lapisan Permukaan
Lapisan Pondasi Atas
Lapisan Pondasi Bawah
Lapisan Tanah Dasar
A. SurfaceCourse
This surface layer is a layer that lies on top and are directly related to load on it.
B. BaseCourse
Layer located between layers of pavement sub-base and base course surface layer called Base Course.
C. Sub-baseCourse
Pavement layer located between the upper base course and subgrade this works as follows:
1. As part of the construction of pavement to spread the load wheels to the subgrade.
2. Achieving efficient use of material. Under the foundation materials are relatively inexpensive compared to the pavement on it.
3. Reducing thick layer on it is relatively expensive.
4. Penetrate layer, so that the ground water is not accumulated in the foundation. 5. First layer, so that the work can proceed
smoothly. If done at the optimum water content and water content constant cultivated during the life of the plan. This can be accomplished by drainagea qualified fitting.
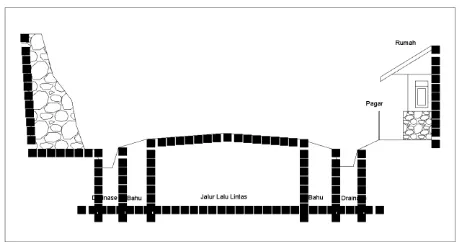
E. Cross Section
The road cross section are pieces of a street perpendicular to the axis of the road which shows the structure of the road sections concerned in the transverse direction, Profile Road consists of parts section as follows:
1. Line of traffic,
2. median and lane edge, 3. shoulder of the road, 4. walking trails, 5. Drainage, 6. Slope.
The cross section can be seen in the following figure (Figure 2.3.):
Figure 3. Cross-section shape Crossing Pieces
F. Performance Pavement
Pavement Performance includes three (3) things,are as follows:
1. Security can be determined by the amount of friction as a result of contact between the tire and the road surface. 2. Being pavement, with respect to the
physical condition of the road as the crack - crack, wave, and others - others.
2.2. Types and Causes Damage Flexible Pavement
Handling pavement construction whether it is maintenance, support, enhancement or rehabilitation can be done well after the damage incurred on the pavement. The magnitude of the effect of a damage and subsequent handling steps depends on the evaluation by the observer
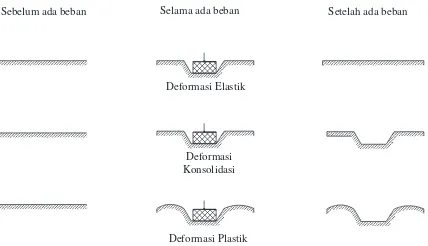
The road receives vehicle wheel load over and over - again during his ministry which lasted for many - years each time passed the load, resulting in a deflection either coated the surface and the layer below it. If the load it will experience excessive wear resulting and total crack damage.
Figure 4. Miscellaneous the deformation
Consolidation deformation occurs when the load raises the pressure is so great that the air grouped into two categories, namely:
A. FlexiblePavement
Flexible pavement is a pavement that uses materials that are pliable asphalt belt, especially during the summer. Mix asphalt and aggregate reinforcement on subgrade with or without sub-base layer. Traffic load is passed down concrete plate. B. The flexible Pavement tier component
analysis method has been approved by the National Standards Council (DSN) Indonesia became Indonesian National
Standard (SNI) with the number: SKBI 2.3.26.1987 / SNI 03-1732- 1989 "Planning Procedures Highway Pavement Thickness Bending with Component Analysis Method (MAK) ". C. Regional factors Regional factors (FR)
is a correction factor with respect to differences in the condition with the experimental conditions AASTHO Road Testand adapted to the circumstances in Indonesia. Regional factors are influenced by the shape of alignment, the percentage of heavy vehicles and stops as well as the flatness.
D. The surface index value index is the surface flatness/fineness and robustness of the surface concerned with the level of service for the traffic passing by. E. Index Tebal Perkerasan (ITP) pavement
thickness index value is obtained from foundation under correlational determined according to the value Marshall Test (for materials with bitumen), compressive strength (for material stabilized with cement or lime), or CBR (for the sub base layer materials). If tool Marshall Test is not available, then the strength (stability) of paving material can be measured in other ways such as Hubbard Field, and Smith Tri axial.
G. Determining Index Tebal Perkerasan (ITP) existing or the power of the old road.
H. Component Analysis Pavement
Calculation of this planning is based on the relative strength of each
layer of
pavement long term, where the
determination of pavement thickness
is expressed by ITP (Index Tebal
Sebelum ada beban Selama ada beban Setelah ada beban
Deformasi Elastik
Deformasi Konsolidasi
Perkerasan), with the following
formula:
ITP = a1D1 + a2D2 + A3d3 Where: ITP = Index Tebal Perkerasan a1, a2, a3 = coefficient of relative strength of pavement materials.
D1, D2, D2 = thickness of each pavement the study location directly on Overlay Palimanan - Kramat Roads with quantitative methods supported by relevant data. In this case, the condition survey has done visually supported by the theory - the theory of this and from various literature references related to the focus of the problem as well as data - data taken from several sources and the results of the review field.
3.2. Data Collection Method
The method used in the writing of this thesis is as follows:
A. FieldResearch
Namely direct observation in the field to obtain data and information by means of:
1. Observation of seeing and observing and recording directly in the field to get the data and accurate information.
2. Asking questions to related parties on matters relating to the subject matter. 3. Documentation.
B. LibraryResearch
Namely data collection - theoretically relevant data through the resources related to the principal language.
C. Types and Sources of Data 1. Primary Data
Data obtained directly from the field in the form of interviews, identification and documentation.
2. Secondary Data
Data obtained from the offices/agencies related material Thesis study.
IV. DISCUSSION
4.1.
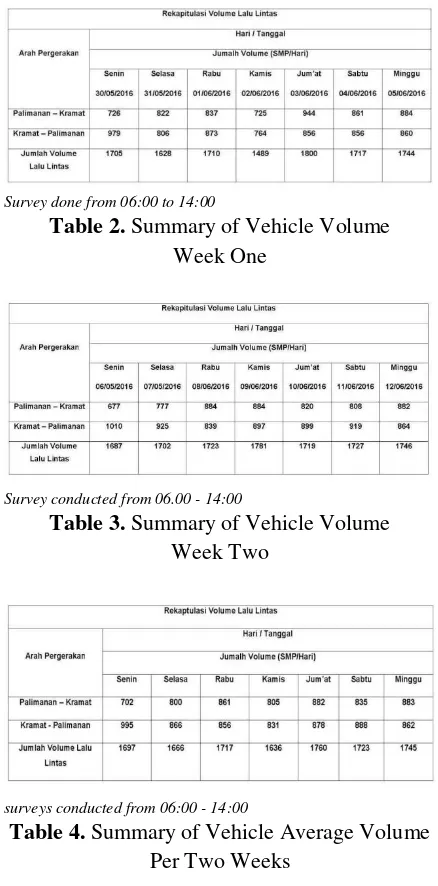
Recapitulation Traffic VolumeTraffic volume is the number of vehicles passing through a certain cross-section at a certain cross-section segment on a particular road segment in units of time traffic certain. Volume average - average is calculated according to the number of vehicles which one - unit of time.
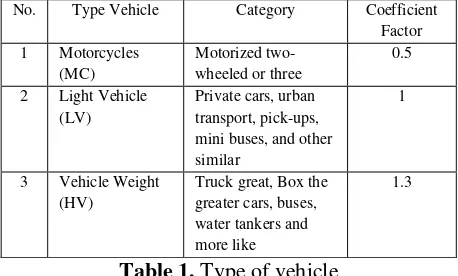
In Palimanan – Kramat road, research done by calculating a density of vehicles passing over the eight (8) hours at the start of Monday May 30, 2016 until the day of the week of June 12, 2016 or for 14 days, in which recording is classified to 3 (three) types of vehicles, namely:
No. Type Vehicle Category Coefficient
Factor mini buses, and other similar
1
3 Vehicle Weight
(HV)
Truck great, Box the greater cars, buses, water tankers and more like
1.3
Table 1. Type of vehicle
Survey done from 06:00 to 14:00
Table 2. Summary of Vehicle Volume Week One
Survey conducted from 06.00 - 14:00
Table 3. Summary of Vehicle Volume Week Two
surveys conducted from 06:00 - 14:00
Table 4. Summary of Vehicle Average Volume Per Two Weeks
4.2.
Peak Hour Traffic VolumePeak hour traffic volume can be determined after observing each - each day. It can be seen at any hour of peak traffic flow is needed when it will be planning a road section because by knowing the highest volume, the highway designers can create a highway design appropriate to the circumstances on the ground. So, the level of service a road section will be good.
The volume of traffic at peak hours can be seen by the following table:
Figure 1. Peak hour traffic volume Kramat – Palimanan
Graph 2. peak hour traffic volume Kramat - Palimanan
Based on traffic volume charts above are taken from the data traffic volume hours peak conducted over two (2) weeks, it can be seen that the peak hours for the direction of movement of Palimanan - Kramat be on Monday, dated May 30, 2016 (first Week) is 09.00 - 10.00WIB of 183 pcu/hour, while for directions movement Kramat - Palimanan peak hours the vehicle is on Monday, dated May 30, 2016 (the first week), i.e. 06.00 - 07.00WIB of 195 pcu/hour.
4.3.
Analysis of Highway CapacityA.Calculation Analysis of Road Capacity based on your results of this research conducted at Palimanan – Kramat road for 2 (two) weeks which begins on Monday, May 30, 2016, until Sunday, June 12th, 2016, it acquired the data as follows:
- Road type
- Geometric Condition
Figure 5. Sketch Location
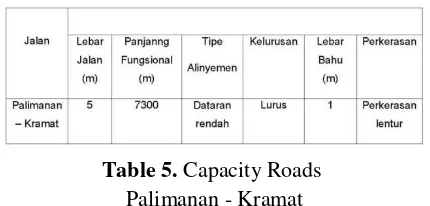
Based on analysis of the location activities road geometric description study on Palimanan – Kramat road is as follows:
Table 5. Capacity Roads Palimanan - Kramat
Highway capacity is space traversed by vehicles, whose magnitude depends on many factors including the effective width of the road used for traffic (MKJI 1997).
Calculation capacity of the road to the road outside the city is done by using the formula: C = C0 x FCW x FCSF x FCSP
Known:
C0 = Basic capacity (pcu/hour) FCW = Factor width adjustment path FCSP = Factor adjustment separation
directions
FCSF = Factor adjustment side friction
Road type 1 track 1 lane 2 direction not to share it with the type of alignment is hilly so the capacity is basically = 2900 pcu / hour total two-way
FCW = factor width adjustment path road type 1 track 1 lane 2 directions no share has wide lanes 5 M so that FCW = 0.56, FCSP = adjustment factor dividing direction Q direction palimanan - Kramat = 183 pcu/hour, Q direction Kramat - palimanan = 195 pcu/hour, Q total = 183 + 195 = 378 pcu/hour.
183
𝑄𝑡𝑜𝑡𝑎𝑙x 100% =
183
378 x 100% = 48.4% = 50% 195
𝑄𝑡𝑜𝑡𝑎𝑙x 100% =
195
378x 100% = 51.6% = 50%
Thus, SP: 50% - 50%
For roads in the city, type of road 1 lane 2 directions with SP 50% - 50% = 1.00, FCSF = adjustment factor side barriers on this road use with a wide shoulder - flatten 1 meter, having activity roadside being with type 1 track 1 line 2 directions, so, FCSF = 0.95.
Based on the data that already exist can be calculated from amount of capacity from road as follows:
C = C0 x FCW x FCSP x FCSF x FCCS C = 2.900 x 0.56 x 1.00 x 0.94 x 0.95 C = 1450 pcu/hour
So, known that the capacity of the vehicle on Roads Palimanan - Kramat is set at 1450 pcu/hour.
B. Calculation of Degree of Saturation Degree is the ratio of traffic volume to capacity. The calculation of the degree of saturation can be calculated by the formula:
DS = Q / C
Where:
DS = Degree of Saturation / degree of saturation (pcu/hour)
Q = Flow of traffic (pcu/hour) C = Capacity (pcu/hour)
From the survey results in to the volume
of traffic = 378 pcu/hour/track.
DS = 𝑄 𝐶 DS = 378
1450
DS = 0:26 or = 0.3
4.
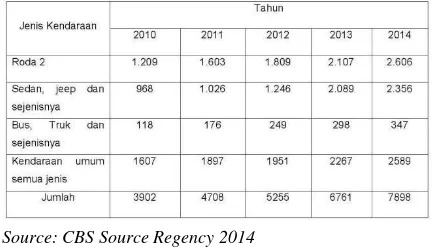
4. Traffic GrowthIn traffic volume growth was influenced by developments in traffic per year, number of vehicles per year can be seen in the following table:
Source: CBS Source Regency 2014
Table 6. Number of motor vehicles
The motor vehicle multitude of data above, it can be in the predicted growth of the average per year in the Sumber Regency of 8%.
Prediction of traffic volume growth can be searched by the formula:
Q = VJP x (1 + 𝑖)𝑛
Q = Flow of total traffic (pcu/hour) VJP = Volume of hours of planning
(In the passenger car unit) i = Traffic Development (Source: BPS Sumber Regency) n = Age of plan
VJP = 378 pcu/hour n = 10 year i = 8% / year
Q = 378 (1 + 0.08)10 Q10th = 816.07 = 817 pcu/hour Degree Burnout
DS = 𝑄𝐶 DS = 1450817
D = 0.563 = 0.57
So, the ten (10) years to come precisely in 2026 the degree of saturation of traffic volume reached 0.57.
4.5.
Calculation of Pavement Thickness A. Supporting Data1. Carrying capacity of the land: 4 (ASSUMPTIONS)
2. Traffic growth (i) :( 8%) = 0.08
3. Age of plan (n): 10 years
B. Annual Average Daily Traffic Plan Determination of the average daily traffic load - average shown in the calculations.
LEP = 378 pcu/hour
LEA = 817 pcu/hour
LET = 𝐿𝐸𝐴 + 𝐿𝐸𝑃 2
= 378+817
2 = 597.5 pcu/hour
LER = LET x FP
FP = 10𝑁=1010= 1
= 598 X 1 = 598 pcu/hour
C. Regional Factors
Regional factors determined by the influence of the form of alignment (slope and bend), the percentage of heavy vehicles and stops, as well as climate (rainfall). Number of Regional Factor (FR) can be determined by referring to the "Table Regional factors”, Calculation factors - factors that affect the value of regional factors are as follows:
1. Percentage of Heavy Vehicles
On Average Daily Traffic - Average Palimanan - Kramat road are: Vehicle weight = 156 pcu/hour.
The formula to get the percentage of heavy vehicles passing through this road are:
= 156378x 100
= 41.26% = 41%
Thus, the percentage of heavy vehicles > 30%
3. Final Surface Index
Value of Index street level plan at the end of design life can be known index level at the End of the General Plan (IPt) by looking for the value and classification of roads in the table is appropriate for LER value (Lintas Ekivalen Rencana) that has been calculated.
Presentase kendaraan berat =
∑ 𝑘𝑒𝑛𝑑𝑎𝑟𝑎𝑎𝑛 𝑏𝑒𝑟𝑎𝑡
With the column LER noted that the numbers entered into the group < 1000, (LER = 598), with local roads classification index values obtained final pavement design life: IPt = 1.5 to 2.0 is used for planning IPt = 2.0,
4. Determining of Index Tebal Perkerasan (ITP)
Stages and relining calculation results are described as follows:
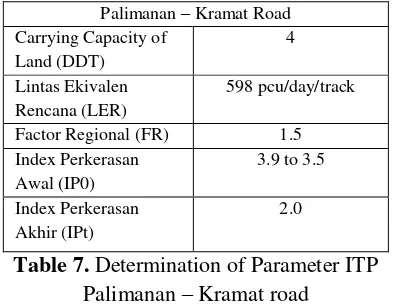
A. Determining of Index Tebal Perkerasan Plan (ITP)
Analysis of the results of the calculation to determine the index of pavement plan (ITP) is known as follows:
Palimanan – Kramat Road Carrying Capacity of
Land (DDT)
4
Lintas Ekivalen Rencana (LER)
598 pcu/day/track
Factor Regional (FR) 1.5 Index Perkerasan
Awal (IP0)
3.9 to 3.5
Index Perkerasan Akhir (IPt)
2.0
Table 7. Determination of Parameter ITP Palimanan – Kramat road
Soil bearing capacity is assumed to be 4 then showed:
- IP0 = 3.9 -3.5 ITP = 10.7 ITP= 12
B. Determination of Pavement
To determine of pavement thickness that can be from a list of relative path coefficient as follows: (used IP0 3.9 -3.5).
- Base layer: 0.28 - Sub-base layer: 0.12
ITPexist Palimanan - Kramat road Surface = 65% x 10 x 0.35 = 2,28 Base layer = 63% x 20 x 0.28 = 3.53 Sub-base layer = 60% x 25 x 0.12 = 1.8
ITPada = 7.6
Thus, from the calculation on the Index Tebal Perkerasan existing (ITPada) is 8 cm.
C.Determine of Thickness Overlay at Old Pavement.
Index Tebal Perkerasan exists (ITPexist) is calculated using the formula:
Based on the results of field surveys, visually level of damage to roads on Palimanan - Kramat road obtained value of the presentation: Surface layer : 65%
Base layer : 63% Sub-base layer : 60%
Coefficient visits on the table "Relative Strength coefficient" materials used on Palimanan – Kramat road is:
Surface layer:0.35.
D. Determining Index Pavement Thickness Need (ITPneed)
Index of Pavement Thickness Need (ITPneed) is calculated using the following formula:
ITPneed = ITP - ITPneed = 12-8
= 4
E. Calculation of Thick Extra Layer
Thick additional layer is calculated using the following formula:
Tmax = 𝐾𝑜𝑒𝑓 .𝑘𝑒𝑘𝑢𝑎𝑡𝑎𝑛𝑟𝑒𝑙𝑎𝑡𝑖𝑓𝐼𝑇𝑃𝑝𝑒𝑟𝑙𝑢 = 0.354 = 11,42cm = 11 cm
Thick layer from the calculation above, Palimanan – Kramat road additional pavement layers using Laston MS 590 with a thickness of AC-WC = 5 cm and AC-BASE = 6 cm.
V. CONCLUSIONS AND RECOMMENDATIONS
5.1. Conclusions
1. Based on the analysis results Palimanan – Kramat road known that the capacity of the vehicles on the road today is at 1450 pcu/h, the degree of saturation of 0.3 into the current level of service B is stable.
2. The highest capacity vehicles via this road for 378 pcu/hour. From these results roads, smoothly enough so that it can be concluded that the vehicles passing dominated by heavy vehicles with a load of overload which caused damage to the road.
3. From the calculation results can be re- layer 11cm thick.
5.2. Recommendations
1. It should be re-examined long-term improvement for several years later because analysis of urgent nature and are included in short-term increase. 2. To further note that the vehicle load
level as not to burden the structure of the pavement.
3. To overcome the sizable financing then added in thick layers can be done by way of 7 cm using the AC - Base and 4 cm using the AC - WC.
VI. REFERENCES
Badan Pusat Statistik Kabupaten Cirebon. 2014. Volume Kendaraan Cirebon.
Dinas Bina Marga Kabupaten Cirebon. 2014. Macam – macam Deformasi Pada Jalan dan Struktur Pada Perkerasan Lentur dan Kaku. Kabupaten Cirebon.
Google Maps. 2015. Peta Jalan Palimanan – Kramat. Kabupaten Cirebon.
Peraturan Pemerintah Republik Indonesia No. 34 Tahun 2006, Tentang Jalan.
Riedho, Arif. 2016. Analisis Peningkatan Ruas Jalan Jatiwangi – Jatitujuh. Cirebon:
Universitas Swadaya Gunung Jati
(UNSWAGATI).
Rohimat, Apriyanto. 2016. Analisis Peningkatan Ruas Jalan Kuningan - Banjarharja. Cirebon: Universitas Swadaya Gunung Jati (UNSWAGATI).
SKBI 2.3.26.1987 / SNI 03-1732-1989. Tata Cara Perencanaan Tebal Perkerasan Lentur Jalan Raya.
Undang – Undang Republik Indonesia No. 22 Tahun 2009. Tentang Lalu Lintas dan Angkutan Jalan.