The Effect of Profitability, Firm Size, Sales Growth and CSR Against Tax
Avoidance on Companies Listed in BEI Year 2013 – 2016
Shella Octavianaa, Kartika Hendra Titisaria, Yuli Chomsatub
a
Universitas Islam Batik Surakarta, JL. KH Agus Salim No. 10 57147, Surakarta, Indonesia b
Universitas Islam Batik Surakarta, JL. KH Agus Salim No. 10 57147, Surakarta, Indonesia e-mail: [email protected]
Abstract : This research aims to test the effect of profitability, firm size, sales growth and CSR on tax avoidance. This type of research in the research it is associative with the causal relationships. This research uses the cash effectife taxes rates as a proxy of tax avoidance. The population of this research as much as 156 companies listed at the IDX and publishes sustainability report year 2013-2016. While the sample was selected using a purposive sampling method and retrieved samples as many as 75 companies. In this study data analysis methods are used, namely multiple linear regression analysis. The data in this study in the analysis using the help of SPSS 17. The results of this research show that profitability, firm size and the CSR effect on tax avoidance. While sales growth has no effect against tax avoidance.
Keyword: Profitability; Firm Size; Sales Growth; CSR; Tax Avoidance.
1. INTRODUCTION
As a country develops, Indonesia are enterprising – his vigorous development in various sectors. The development aims to improve the welfare of society, both in terms of economic and social. Because of that, the public is asked to participate in such development. one way to do that is by paying taxes. Legal basis of taxation procedures have been set in law – Law No. 6 year 1983 and has been converted into law – Law No. 28 year 2007 which regulates the rights and obligations of
taxpayers and tax penalties. The
Government also set up several policies to increase acceptance of the tax sector. One of the policies that use is a tax amnesty. The existence of a tax amnesty this Government expects entrepreneurs who keep their funds abroad would move their funds to indonesia and become the new taxpayer who dutifully so as to improve the country's tax revenues. The
efforts made in enhancing the
Government's tax revenues turned out to be different from the interests of the taxpayers or private agency. Earlier in the
year 1984 indonesia has ever enacted a tax amnesty, but their implementation is not effective because the taxpayer's response is very less and not followed by reform of the administrative system. Taxpayer private or agency often perform a variety of ways to avoid taxes charged against his company.
Tax avoidance is the evasion effort was conducted legally and safely for the taxpayers because it does not conflict with the provisions of the taxation, where the methods and techniques used tend to
exploit weaknesses – weaknesses
contained in legislation – tax laws and regulations themselves to minimize the amount of tax payable (Zebua, 2016). One of the cases of tax evasion that occurred was done by a company engaged in the field of health affiliated in Singapore, namely PT. RNI. PT. RNI now undergoing examination by the Regional Office of the Directorate General of Taxes. The company allegedly make an effort – effort of tax evasion, but the company has significant activities in Indonesia (Kompas, 2016)
There are several factors that can affect the tax avoidance. This research aims to test the influence between profitability, firm size, sales growth and CSR against tax avoidance. In the research (Almaidah, Titisari, & Nurlaela, 2017) the profitability of the variable represented by the ROA has a negative influence against tax avoidance. The next factor that is, the size of the company, in research (Puspita & Harto, 2014) the size of the company does not have significant
influence towards corporate tax
avoidance behavior. In addition to both of these tax avoidance can also be influenced by sales growth and CSR as well. In research (Almaidah, Titisari, & Nurlaela, 2017), sales growth has no effect against tax avoidance. As for CSR, in research variable study (Septiadi, Robiansyah, & Suranta, 2015) shows
results that Corporate Social
Responsibility disclosure to tax
avoidance.
Based on previous research, the researchers tested the contradictory relationship between profitability, returns the size of the company, sales growth and CSR against tax avoidance. Doing research on companies listed in BEI year 2013 – 2016. By testing the influence profitability, Firm Size, sales growth and CSR against tax avoidance. Then the Hypothesis in this study are:
H1 : profitability effect on tax avoidance H2 : size effect on Corporate tax
sustainability report. The
population in this research
totalled 156 year 2013 – 2016. While the sampling in this study using a purposive sampling engineering criteria (1) the company publish the annual report and sustainability reports successive – join in year 2013 –
2.2.1 The Dependent Variable The dependent variable in
research uses developed
by CETR (Dyreng,
profit margin can be simplified by transforming into natural logarithm of
reflection of the success of an investment period of the past and can serve as a prediction of future the growth of the Sales growth in this study is measured
The independent variable is the last of this research the sustainability Report of the company. In this study used a dummy variable. A
variable that is kategorial who allegedly had the influence of the againts variable that is continue. A dummy variable has only two values 1 and 0. The results of the disclosure of the items of CSR in this
study were calculated
using the CSRI using the formula:
2.3 Data Analysis Method
A method of data analysis in this research use descriptive
statistical tests, classic
assumption and multiple linear regression analisiss. Descriptive statistics was used to analyze statistical data by way of describing the data that has been collected. A classic assumption test consists of a test of normality, test multicollinearity, heteroskedastisitas test and a test of autocorrelation. as for the multiple linear regression analysis consists of a feasibility
test, regression A classic
assumption test is an analysis that is conducted to assess whether a linear regression model in a there is a problem – the problem of the classical assumptions.
The equations of the regression models in this study are:
Y = a + b1X1 + b2X2 + b3X3 + b4X4 + e
Description:
Y : Tax Avoidance
a : Constants
b1X1 : Profitability b2X2 : Firm Size b3X3 : Sales Growth b4X4 : CSR
e : Error
3. RESULT AND DISCUSSION
3.1 Descriptive Statistical Tests
Descriptive statistics was used to analyze statistical data by way of describing the data
that has been collected.
Descriptive ' test in this research showed the following results:
Table 1 Descriptive Statistical Tests
Variable N Minimum Maximum Mean Std. Deviasi
Tax Avoidance 75 0.04 0.47 0.2459 0.08156
Profitability 75 0.02 1.15 0.1923 0.16176
Ffirm Size 75 7.07 13.30 9.2039 1.67517
Sales growth 75 -0.90 9.40 0.1873 1.09782
CSR 75 0.30 0.97 0.5063 0.13582
3.2 Classical Assumption 3.2.1 Test For Normality
Table 2 test for normality
Variabel Signifikansi Standar Description
Unstandardized Residual 0.149 > 0.05 Normal distributed data Table 2 above shows the
results of the variable unstadardized to the value of significant residual 0149 > 0.05. Then this can
be summed up in the research data is distributed normally.
3.2.2 Test For
Multicollinearity
Table 3 Test For Multicollinearity
Variabel VIF Std Tolerance Std Description
Profitability 1.037 <10 0.965 >0.10 No Multicollinearity Firm Size 1.022 <10 0.979 >0.10 No Multicollinearity Sales growth 1.030 <10 0.971 >0.10 No Multicollinearity CSR 1.033 <10 0.968 >0.10 No Multicollinearity
Based on the results of the test of multicollinearity on table 2 shows bring the
value of the variable
profitability of VIF, firm size, sales growth and
CSR < 10 and value tolerance > from 0.10. from the above it can be concluded that the non multicollinearity.
3.2.3 Test Heteroskedastisitas
The 2nd International Conference on Technology, Education, and Social Science 2018 (The 2nd ICTESS 2018)
heteroskedastisitas due to the point – the point
3.2.4 Test Autocorelation
Table 4 test autocorelation
Model DW dL dU 4-dU 4-dL Description
1 1.749 1.515 1.739 2.261 2.485 No autocorelation
Based on the above
autocorrelation test results it can be concluded that there is no autocorrelation because the value of the DW and DW > dU <
4-dU. 1,749 > and 1,749 1,739 < 2,261.
3.3 Multiple Linear Regression
3.3.1 Model regression
Table 5 Multiple Linear Regression Test
Variable B
Constant 0.083
Profitability -0.132
Firm Size 0.011
Sales growth -0.008
CSR 0.175 above obtained value
constants 0083,
profitability went up by 1% and the other
variables fixed then the tax avoidance will be declined by 13.2% or 0132.
c) Coefficient of variable
size enterprise of
0011. It means that if
the size of the
company went up by 1% and the other variables fixed then the tax avoidance will increase by 1.1% or 0011.
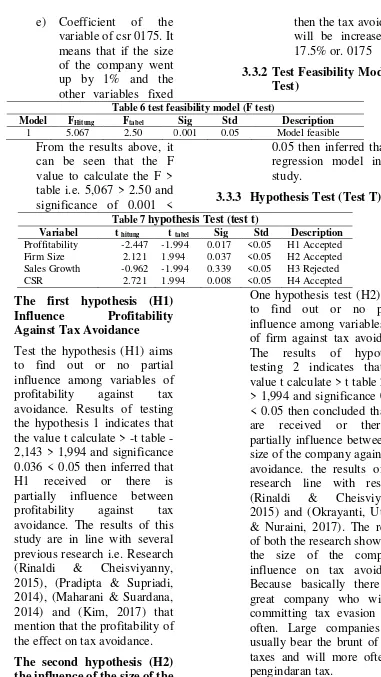
e) Coefficient of the variable of csr 0175. It means that if the size of the company went up by 1% and the other variables fixed
then the tax avoidance will be increased by 17.5% or. 0175
3.3.2 Test Feasibility Model (F Test)
Table 6 test feasibility model (F test)
Model FHitung Ftabel Sig Std Description
3.3.3 Hypothesis Test (Test T)
Table 7 hypothesis Test (test t)
Variabel t hitung t tabel Sig Std Description
Proffitability -2.447 -1.994 0.017 <0.05 H1 Accepted Firm Size 2.121 1.994 0.037 <0.05 H2 Accepted influence among variables of
profitability against tax
avoidance. Results of testing the hypothesis 1 indicates that the value t calculate > t table -2,143 > 1,994 and significance 0.036 < 0.05 then inferred that H1 received or there is partially influence between
profitability against tax
avoidance. The results of this study are in line with several previous research i.e. Research (Rinaldi & Cheisviyanny, 2015), (Pradipta & Supriadi, 2014), (Maharani & Suardana, 2014) and (Kim, 2017) that mention that the profitability of the effect on tax avoidance.
The second hypothesis (H2) the influence of the size of the
company Against Tax
Avoidance.
The third hypothesis (H3) the influence of Sales Growth Against Tax Avoidance.
One hypothesis test (H3) aims to find out or no partial
influence among variables
sales growth against tax
avoidance. The results of
testing the hypothesis 3
indicated -0.962 < 1,994 and significance 0339 > 0.05 then inferred that H3 denied or there are no partially influence between sales growth against tax avoidance. The results of this research line with research
(Swingly & Sukartha,
2015)that mention the variable sales growth has no effect on the tax avoidance and also with
research conducted by
(Almaidah, Titisari, &
Nurlaela, 2017) in the study also mentioned that sales growth has no effect against tax avoidance. However, the results of this research is different from other research
i.e. research conducted
(Budiman & Setiyono, 2012) showed that sales growth effect significantly to tax avoidance. The research is supported by other research i.e. research from (Dewinta & Setiawan, 2016) in (Almaidah, Titisari, & Nurlaela, 2017) that mention when sales growth increases
the company tends to
increasingly get the profit
anyway so that companies tend to do practice tax avoidance because of the great profit will result in a huge tax burden.
The fourth hypothesis (H4) CSR Influence Against Tax Avoidance.
One hypothesis test (H4) aims to find out or no partial
influence among variables
CSR against tax avoidance. influence between CSR against tax avoidance. The results of
this study supports other
research i.e. research
conducted by (Septiadi,
Robiansyah, & Suranta, 2015) who find the results that the CSR effect positively and significantly to tax avoidance. Other research also supports
this research is research
(Wijayanti, Wijayanti, &
Samrotun, 2016) who
mentioned that CSR is a form of commitment to the activities of business activity – to act
ethically, contribute in
economic development and improve the quality of life of employees and the community.
3.3.4 test coefficients of determination (R2)
Table 8 test coefficients of determination (R2)
Model R R2 Adjusted R2 Description
1 0.474 0.225 0.180 The Dependent variable can be explained by the independent
variable Based on the results from
table 8 can note that the value
independent variables in this research in the form of firm
size, profitability, sales
growth and CSR can only independent variable affect the dependent variable or explain.
4. CONCLUSION
This research aims to examine and analyze the influence of profitability, the size of the company, sales growth and CSR against tax avpidance on companies listed in BEI year 2013 – 2016. This research included in the associative research causal stating the relationship causal. The population in this research is a registered company in BEI and menerbitkaan sustainability report. This research using a sample as many as 76 companies year 2013 – 2016 of companies listed at the IDX and published a sustainability report. This study tested using SPSS software assistance. 17.
Based on the results of hypothesis testing 1 stating that the profitability of the effect on tax avoidance are supported by empirical evidence. Hypothesis 2 and 4 hypothesis proposed in this study which States that the size of corporations and the CSR effect on tax avoidance is also supported by empirical evidence. As for hypothesis 3 stating that sales growth effect on tax avoidance is not supported by empirical evidence.
The results of this study indicated that tax avoidance is not a new thing among the company, the company's profitability is high and the size of the
large companies that also make
companies compelled to practice tax avoidance. Disclosure of CSR company also has done does not guarantee a Karakteristik Perusahaan, Sales Growth Dan CSR Terhadap Tax
Avoidance. Seminar Nasional
IENACO ISSN : 2337 - 4349 .
Budiman, J., & Setiyono. (2012). Pengaruh Karakteristik Eksekutif Terhadap Penghindaran Pajak .
Jurnal Universitas Islam Sultan Agung .
Dyreng, S. D., Hanlon, M., & Maydew, E. L. (2010). The Effect Of Executives On Corporate Tax Avoidance. The Accounting Review
Vol.85 No.4 pp.1163-1189 .
Kasmir. (2010). Pengantar Manajemen
Keuangan . Jakarta : Kencana
Prenada Media Group.
Kim, H. J. (2017). The Study On The Effect And Determinants Of Small - And Medium - Size Entites
Conducting Tax Avoidance. The
Journal Of Applied Bussiness Research .
Kompas. (2016, April 6). Dipetik
Oktober 27, 2017, dari
www.kompas.com
Maharani, I. G., & Suardana, K. A.
(2014). Pengaruh Corporate
Governance, Profitabilitas Dan
Karakteristik Eksekutif Pada Tax Avoidance Perusahaan Manufaktur.
E-Jurnal Akuntansi Universitas
Okrayanti, T. Y., Utomo, S. W., &
Nuraini, E. (2017). Pengaruh
Karakteristik Perusahaan Dan
Corporate Governance Terhadap
Tax Avoidance. Forum Ilmiah
Pendidikan Akuntansi Vol.5 No.1
Oktober , 804-817.
Pradipta, D. H., & Supriadi. (2014).
Pengaruh Corporate Social
Responsibility, Profitabilitas,
Leverage Dan Komisaris
Independen Terhadap Praktik
Penghindaran Pajak . Jurnal
Universitas Gajah Mada .
Puspita, S. R., & Harto, P. (2014). Pengaruh Tata Kelola Perusahaan Terhadap Penghindaran Pajak .
Diponegoro Journal Of Accounting
Volume 3 Nomor 2 , 1-13.
Rinaldi, & Cheisviyanny, C. (2015). Pengaruh Profitabilitas, Ukuran Perusahaan Dan Kompensasi Rugi Fiskal Terhadap Tax Avoidance (Studi Empiris Pada Perusahaan Manufaktur Yang Terdaftar Di BEI
Tahun 2010 - 2013). Seminar
Nasional Ekonomi Manajemen Dan Akuntansi .
Septiadi, I., Robiansyah, A., & Suranta, E. (2015). Pengaruh Manajemen Laba, Corpirate Governance Dan Corporate Social Responsibility Terhadap Tax Avoidance. Jurnal
Universitas Bengkulu .
Swingly, C., & Sukartha, I. M. (2015). Pengaruh Karakteristik Eksekutif, Komite Audit, Ukuran Perusahaan, Leverage Dan Sales Growth Pada
Tax Avoidance. E-Jurnal
Akuntansi Universitas Udayana 10.1 , 47-62.
Wijayanti, A., Wijayanti, A., & Samrotun, Y. C. (2016). Pengaruh Karakteristik Perusahaan, GCG Dan CSR terhadap Penghindaran Pajak . Seminar Nasional IENACO
ISSN : 2337 -4349, 541 .
Zebua, F. K. (2016). Analisis Pengaruh Penghindaran Pajak Terhadap Nilai Perusahaan Dengan Transparansi Sebagai Variabel Moderating Pada
Perusahaan Manufaktur Yang