CHAPTER III
RESEARCH METHOD
This part discusses research design, population and samples, research instrument, data collection procedure and data analysis procedure.
A. Research Design
The design of the study was an experimental design using counterbalance
procedure. Experimental design is a plan for an experiment that specifies what independent variables would be applied, the number of levels of each, how subjects are assigned to groups, and the dependent variable. 1Counterbalanced procedure is an experimental design in which the effects of order was controlled by having all groups receive all treatments but in a different order. 2The design was appropriate since the study investigated the effects of independent variable (ICT based graphic organizer) toward the dependent variable (students’ writing score). Counterbalanced procedure was applied since the effects of order were
controlled by having all groups received all treatments but in a different order (ICT based graphic organizer versus pattern outline).In the present study, the
single group of the subjects were divided into two half that were called two treatment groups. They were Group A and Group B. The two half of student got treatment but the treatment was in different order: ICT based graphic
1
Donald Ary, Lucy Cheser Jacobs, Chris Sorensen, AsgharRazavieh. Introduction to Research in Education.(eighth edition).(United States: Wadsworth Cengage Learning, 2010). p.641.
2Ibid.
p.639.
organizerversus pattern outline. The different order of treatments functioned to
control invalidity.
B. Population and Sample
Population is the group to which a researcher would like the results of a study to be able to generalize.3 In the present study, the population of the study was all the writing III class students of the fourth semester English Education
Study Program of Palangka Raya State Islamic Institute academic year 2015/ 2016. They were class A, B, C and D. To take the sample of the population, the
researcher applied cluster sampling. Cluster sampling isa probability sampling technique that randomly selects and uses completely naturally occurring group
such as intact classrooms or entire voting as the samples (clusters).4
The class B waschosen as the sample of the study for a number of reasons. First, the average writing score of class B represented the whole writing ability of
the population. Second, class B enabled to apply graphic organizer in prewriting strategies. Third, they passed Writing II course. Fourth, the course material of Writing III covered expository essays, including comparison and contrast essay
and based on the new curriculum of English Education Study Program of Palangka Raya State Islamic Institute; it was taught at the fourth semester. The
number of the sample was 21students.
3
L.R. Gay. Educational Research: Competencies for Analysis & Application. Second Edition. (Toronto: Charles E. Merrill Publishing Company, 1981) p. 101.
C. The Research Instruments
The data of the study were collected through two research instruments, i.e.: test, and questionnaire.
1. Test
Test instrument is a measuring device built as a series of tasks to which a person is to respond. When scored, the test gives a quantification of the characteristic that the test is designed to measure.5Here, the students are assigned to write a comparison and contrast essay using ICT Based Graphic Organizers and using pattern outline on different time. The tests are used to measure the students’ writing scoreusing ICT Based Graphic Organizers and using pattern outline. The test is done three times: pretest, post test session 1 and post test session 2. Test
was the main instrument to collect the data about the students’ writing score.
2. Questionnaire
A questionnaire consists of a number of questions printed or typed in a definite order on a form or set of forms. The questionnaire is mailed to
respondents who are expected to read and understand the questions and write down the reply in the space meant for the purpose in the questionnaire itself. The respondents have to answer the questions on their own.6 To answer the research problem number 2, that was to see in what ways, ICT Based graphic organizer gave contribution to students in the writing process, the questionnaire distributed
to the students. The questionnaire consisted some aspects of students’ response related to the use of ICT based graphic organizer in writing class and the area of
5
Hopkins, Charles, D. Understanding Educational Research: An inquiry Approach. (Colombus: Charles E. Merril Publishing Company, 1980).p. 464.
6
contribution of GO in writing process.The result of the questionnaire was
analyzed using percentage.
D. Instrumentation
1. Test Type
The type of the test used to collect the data was in the form of writing test, especially comparison and contrast writing test using and without using ICT
basedgraphic organizer. The test consisted of the instructions/ directions and statements the subjects addressed in their writing and the alternative topics to be chosen. In this sense, the students were assigned to choose one of topics that
interest them. They were asked to develop the topic into an essay containing about 400 to 500 words. The allocated time was about 120 minutes.
2. Test Construction
The test construction was based on the objectives of the study. The study was aimed at finding out the effectiveness of using ICT based graphic organizerin
writing comparison and contrast essay. To investigate the effectiveness of using ICT based graphic organizerin writing comparison and contrast essay, the subjects were assigned to write comparison and contrast essay using ICT based graphic
organizerand without using ICT based graphic organizer. The results of the two tests were investigated using statistical analysis and the outcomes were compared
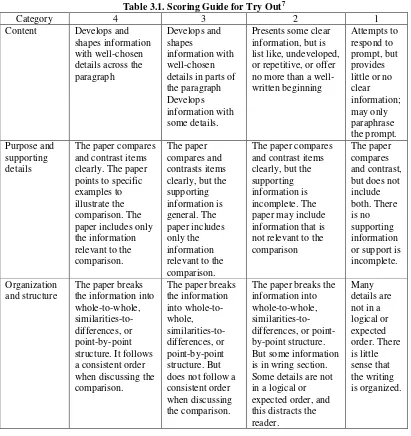
Table 3.1. Scoring Guide for Try Out7 validity. In this study, the validation of instrument is mainly directed to the face and content validity, that is, to make the test items (contents) match with what is
7
International Journal of English language Teaching Vol.3, No.1, pp.11-31, March 2015 Published by European Centre for Research Training and Development UK (www.eajournals.org)
8
supposed to measure. Related to writing test, the content validity can be checked
by examining the agreement between the objectives of the course and the test used to measure the objectives. In this case, the students were assigned to write a
comparison and contrast essay, which was matched with the syllabus of Writing III course. Then, in terms of the face validity, the test assigned the students to write a comparison and contrast essay. The topics to be selected were also familiar
to students. Next, construct validity meant that the test really measure the intended construct. 9
In this sense, there were some efforts to make the test construction and content valid (test of validity). First, the researcher made the test be true measure.
It means that the test matched with what supposed to measure. Here, the test showed agreement between the test scores and objectives. Second, the researcher determined that the test types matches with test objectives. After determining the
test types, the researcher determined the test content suitable with the test. In this sense, the primary concern was focused on the topics of the essay. The topic selection was based on the objectives of test, students’ background knowledge and
interests.
Afterwards, the writing test was constructed. It contained the directions
that the students have to do the test. Then, the test try out was done to the students having the same characteristics with the subjects of the study. It was done for the improvement and clarification of the instructions. The revision of test instruction
9
was made after having the test try out. Finally, the final form of writing test was
done to the experiment class.
In addition, reliability is the accuracy of measurement and the consistency
of results.10 It is the degree of consistency with which it measures whatever it is measuring.11Similarly, Sekaran states that reliability is the extent of consistency and stability of the measuring instrument.12 In this case, to score composition as fairly and consistently as possible, the researcher used inter-rater method (test of reliability). Inter-rater reliability is the consistency of the judgment of several
raters on how they see a phenomenon or interpret the responses of the subjects. In this case, two raters were employed to score the students’ writing. The
two raters were the researcher and the English teachers who have a lot of experience in teaching English at English Education Study Program of Palangka Raya State Islamic Institute. One important thing in using the inter rater method in
rating process is focused with the training of the raters.13 It can maximize the accuracy of the writing assessment. This makes the raters be consistent in scoring and avoid subjectivity of the raters in scoring. For this purpose, the training was done to get inter rater agreement in order to give reliable scores to students’
writing product.
10
Hellriegel. Organizational Behavior. (Ohio: South Western College Publishing, 1998) p. 631.
11
Donald Ary, Lucy Cheser Jacobs, Chris Sorensen, AsgharRazavieh. Introduction to Research in Education.(eighth edition).(United States: Wadsworth Cengage Learning, 2010). p.236.
12
Umi, Sekaran. Research Methods for Business: A Skill Building Approach. (New York: John Wiley & Sons, Inc, 1992) p. 367.
13
Relevant to this, Nunan stated that the acceptance reliability on
composition scores are possible to get through careful training of raters.14 Moreover, Latief argues that reliability on composition scoring is affected by both raters and writers of the essay. Raters’ reliability refers to the accuracy of the
raters’ judgment. Meanwhile, writers’ reliability refers to the accuracy of the
writers’ performance.15
In this study to make test item was validity and reliability, the researcher tried out the test item into Writing III in class A on Friday, March 25, 2016 in
room F.2.1.The students of class A consisted of 20 students.
b. Rater Reliability
Reliability refers to the consistency with which a test measured whatever it measured.16 Similarly, Latief states that reliability refers to the preciseness of the language skill assessment results in representing the actual level of the examinee’s
skills.17 In this study, reliability of the writing test mainly focuses on the rater reliability since the scores are obtained from the judgment of two different raters. Here, the consistency in rating scores is very important in measuring the students’
writing skill. The consistency can be achieved through rater training.
In rater reliability, there are inter-rater and intra-rater reliability. Inter-rater
reliability indicates accuracy in scoring compositions of different raters.
14
David, Nunan. Research Methods in Language Learning. (Cambridge: Cambridge University Press, 1992) p.56.
15
Adnan, M. Latief. Reliability of Language Skills Assessment Results. JurnalIlmuPendidikanVIII No 3, 214-224., 2001.
16
Hopkins, C.D. & Richard, L.A. Classroom Measurement and Evaluation. (Illinois: F.E. Peacock Publishers, Inc., 1990) p.295.
17
Meanwhile, intra-rater reliability refers to the consistency of the rater in scoring
the same paper at two different points of time.18 It points out an individual accuracy in scoring a particular composition.
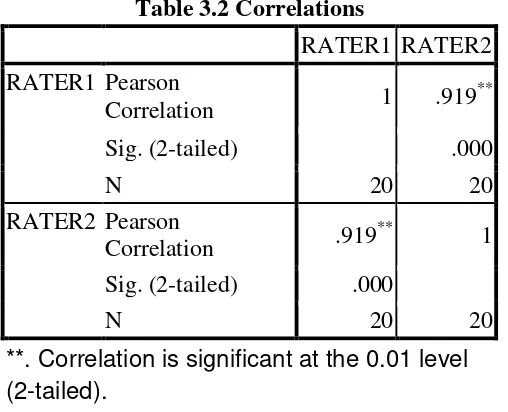
To obtain inter rater reliability; the scores of the two raters were correlated using SPSS 16 program using Product Moment Correlation calculation. Here, the students’ writing products were assessed by two raters: the researcher and the
writing lecturer. The two different writing scores were correlated using Product Moment correlation in order to see the reliability of the students’ score. The result
was in Table 3.2.
Table 3.2 Correlations
RATER1 RATER2 RATER1 Pearson
Correlation 1 .919
**
Sig. (2-tailed) .000
N 20 20
RATER2 Pearson
Correlation .919
**
1 Sig. (2-tailed) .000
N 20 20
**. Correlation is significant at the 0.01 level (2-tailed).
The obtained inter-rater reliability coefficient for scores of both raters was 0.919. It lied between .90 to 1.00 (See Appendix 8 for detail). Based on the
intrepratation of coefficient correlation, it belonged to high positive inter-rater reliability category. The obtained coefficient indicated that the students’ writing products achieved the acceptable level of reliability. It meant that the students’
18
writing product had been scored as fairly and consistency as possible. In this case,
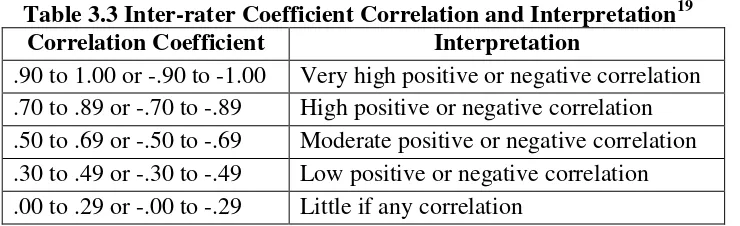
the researcher applied the coefficient correlation and the interpretation of inter-rater reliability proposed by Winkle et al as shown in Table 3.3.
Table 3.3 Inter-rater Coefficient Correlation and Interpretation19
Correlation Coefficient Interpretation
.90 to 1.00 or -.90 to -1.00 Very high positive or negative correlation .70 to .89 or -.70 to -.89 High positive or negative correlation .50 to .69 or -.50 to -.69 Moderate positive or negative correlation .30 to .49 or -.30 to -.49 Low positive or negative correlation .00 to .29 or -.00 to -.29 Little if any correlation
D. Data Collection Procedure
The study was aimed at investigating the effectiveness of using ICT
basedgraphic organizeron the quality of composition written by experimental group of students. To collect the data, the researcher employed counterbalanced procedure. In the procedure, the single group of the subjects were divided into two
half that are called two treatment groups. The two half of students got treatment but the treatment was in different order: ICT based graphic organizerversus
pattern outline. The different order of treatments functioned to control invalidity. Here, there were two sessions of test. Thetest session 1 was given to the students on Thursday, 31 March 2016 at 07.00- 09.15 in Room A2.2. The numbers of the
students were 21 of 25 students.Meanwhile, the test session 2 was given to the students on Thursday, 21April 2016 at 07.00- 09.15 in Room A2.2. The numbers
of the students were 21 of 25 students.
19
In short, the procedure to collect the data was as follows:
1. Conducting preliminary study. The preliminary study was done on on Thursday, 17 March 2016 at 07.00- 09.15 in Room A2.2. Here the researcher
observed the class that would be researched. The observation covered the syllabus of Writing III. It was about the class schedule, materials, course outline and the learning process. (see Appendix 9). This was done in order to
know the early problems in writing class and to check the material covering comparison and contrast in Writing III.
2. Determining the subject of research using cluster sampling technique. Here, there were four writing III classes. The researcher determinedone of the
classes selected to be the subject of research that representedthe average writing ability of the whole class. The students of Writing III B class were selected to be the subject of the study. The number of the subject was 21
students.
3. Giving a try out test in order to see the validity and reliability of the test.The try out test was done on 25 March 2016 in Writing III A. The test assigned
the students to write a comparison and contrast essay with various topics. (see Appendix 8). The try out was given to the students of Writing III Class A.
The number of the subject was 20 students. It was done on Friday, April 25, 2016 in room F2.1.
4. Giving treatment. Here, the researcher socialized the use of ICT based
ICT based graphic organizer in writing comparison and contrast essay. In
giving treatment, the counterbalance procedure were applied. In the procedure, the single group of the subjects were divided into two half that
were called two treatment groups (Group A and group B). The two half of students get treatment but the treatment is in different order: ICT based graphic organizer versus Pattern Outline). (see Appendix 4).
5. Giving final test. After doing the treatment, the researcher gave test in two sessionsin order to measure the effect of pattern outlining and ICT based
graphic organizer in writing comparison and contrast essay. Here, each the student was assigned to write two model of comparison and contrast essay
using ICT based graphic organizer versus pattern outline) in different period of time (see Appendix 1).
6. Analyzing data to answer the research problem number one. Here, the means
of both students’ writing scores: (ICT based graphic organizer versus outline
pattern) of Group A and Group Bwere compared in order to see effects of ICT based graphic organizer in writing comparison and contrast essay. The t
paired sample t test applied to analyze the data, since the subjects were the same.
7. Distributing questionnaire. The questionnaire was distributed to the students on Thursday, 21April 2016 at 09.30- 10.00 in Room A2.2. The numbers of the students were 21 respondents. It was done to answer the research problem
the students. The questionnaire consisted some aspects of students’ response
related to the use of ICT based graphic organizer in writing class and the area of contribution of GO in writing process. (see Appendix 6)
8. Interpreting the result. The result of the t test from manual calculation was interpreted. If the t observed was higher than t table, the Ha stating that the students who taught using ICT based graphic organizer get better
achievement than those who taught without using ICT based graphic organizer was accepted, and the Ho stating that the students who taught using
ICT based graphic organizer do not get better achievement than those who taught without ICT based using graphic organizer was rejected. Meanwhile, if
the t observed was smaller than t table, the Ha was rejected and the Ho was accepted. Meanwhile, the result of Sig from SPSS 16 program was identified, If the Sig was smaller than 0.05, the Ha was accepted and Ho was rejected.
On the contrary, if the Sig was higher than 0.05, the Ha was rejected and Ho was accepted.
9. Making discussion and conclusion. The discussion was made to clarify the
research finding. Here, the researcherquoted some experts’ theory to support the research finding.
The procedure to collect the data was described as the following steps. After given short explanation on the purpose of the study and the way to carry out, the students were divided into two halves of treatment groups. Each treatment
The essay writing both using ICT based graphic organizer pattern
outlinestarted at the different time. Before starting to write, the ICT based graphic organizer group made graphic organizerof the topic selected. On the contrary, the
non- ICT based organizer group started to write an essay with outline pattern. The data were collected in two meetings during the proposed semester.
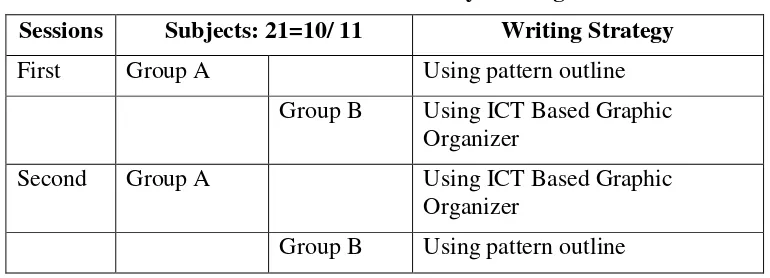
To sum up, the data collection was in two sessions. In the first session, the
two groups of subjects were assigned to write a comparison and contrast essay. Group A wrote a comparison and contrast essay using a pattern outline.
Meanwhile, Group B wrote a comparison and contrast essay using ICT Based Graphic Organizer. In the second session, the two groups of subjects were
assigned to write a comparison and contrast essay. Group A wrote a comparison and contrast essay using ICT Based Graphic Organizer. Group B wrote a comparison and contrast essay using a pattern outline.
The data were collected in two meetings during the proposed semester. In order to have better understanding on the procedure in essay writing with counterbalance procedure, it could be seen in Table 3.4.
Table 3.4The Procedure of Essay Writing Test
Sessions Subjects: 21=10/ 11 Writing Strategy
First Group A Using pattern outline
Group B Using ICT Based Graphic Organizer
Second Group A Using ICT Based Graphic
Organizer
The method of data collection used in the present study and how the
research problems would be answered were summarized in Table 3.5.
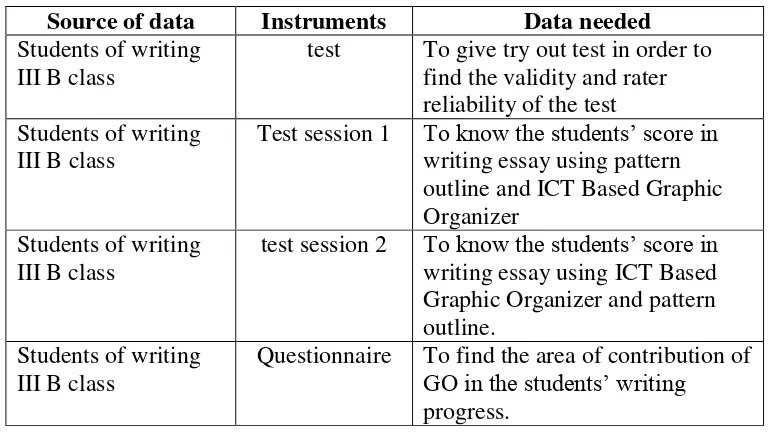
Table 3.5 The Source of data, instruments, and data needed
Source of data Instruments Data needed
Students of writing
Test session 1 To know the students’ score in writing essay using pattern outline and ICT Based Graphic Organizer
Students of writing III B class
test session 2 To know the students’ score in writing essay using ICT Based Graphic Organizer and pattern outline.
Students of writing III B class
Questionnaire To find the area of contribution of GO in the students’ writing
research problem. In this case, the researcher applies T-test for paired samples to examine the difference score between the students who use graphic organizerand
those who do not use ICT based graphic organizerin writing comparison and contrast essay. T-test for correlated samples is a statistical test that establishes a
significant mean difference in a variable between two groups.20 In this design the subjects were exposed to a combination of treatments.
In order to analyze the data, the researcher did some procedures:
20
1. Collecting the score of the students’ writing product (students’ worksheet using
ICT based graphic organizer and pattern outline, portfolios covering the
students’ composition, and revising checklists using peer correction).
2. The researcher measured normality of score in order to know the normality of the data that is needed to test the hypothesis. Here, the Kolmogorov-Smirnova test was applied to find the normality. Based on the Kolmogorov-Smirnovatest, it was shown that the value of Sig. was 0.162. Since it was higher than 0.05, the data was said to be normally distributed.
3. The researcher measured homogeneity. It was used to know relatively same variant or not of the data. Here, the levene’s test was applied to see the
homogeneity. Based on the Levene’stest, it was shown that the value of Sig. was 0.142. Since it was higher than 0.05, the data was not violated the homogeneity.
4. Tabulating the data into the table of difference sore, then find out the mean of
students’ score, standard deviation of variable by using the formulas bellow:
a. Mean
M =𝑁𝐹𝑋
Where: M = Mean F = Frequency X= The scores
First, Calculating the difference scores and the intermediate numbers for the
SS formula:
M =𝐹𝑋 𝑁
M
=𝐹𝑋 𝑁
𝐷 𝑑 𝑑2
Where:
M = means of X, D= difference score, d= difference score – means of D, d2 = result of d squared.
Second, measuring correlated sample t-test. In the beginning, measure
the mean in each group or 𝑋 = Mean of X. 𝑋 1 is mean of writing score
using GO.𝑋 2 is mean of writing score using Pattern Outline. 𝑑2= Total of
deviation is squared from different mean between X1(GO) and X2 (Pattern Outline). n is Number of Students, consisted of 21 of 25 students.
Third, measured correlated sample t-test. Here, the formula of 𝑡1−2 in correlated sample t-test:
𝑡1−2 =
𝑋1
− 𝑋 2
𝑑2
𝑛 (𝑛 −1)
Where:
𝑋 1 = Means of X
𝑑2 = Total of deviation from different mean between X
1-X2 n = Number of Students.
Fifth, interpreting the result of statistical calculation by comparing the t
observed with t table with the criteria:
If t observed ≥ ttable, Ha is accepted and Ho is rejected If ttest ≤ ttable, Ha is rejected and Ho is accepted
5. In addition, the researcher used SPSS 21.0 program to compare the result with the manual one. The result of Sig from SPSS 16 program was identified. If the
Sig was smaller than 0.05, the Ha was accepted and Ho was rejected. On the contrary, if the Sig was higher than 0.05, the Ha was rejected and Ho was
accepted.
To sum up, the steps in collecting, analyzing, and hypothesis testing can
be described below. In the earlier step, the subjects selected a topic for comparison and contrast essay. They were assigned to write comparison and contrast essay using ICT based graphic organizer and without using ICT based
graphic organizer. Then, the subjects’ writing both using ICT based graphic organizer and without using ICT based graphic organizer was scored by two raters. To analyze the data of writing scores, a t test for paired samples was
employed. T test for paired samples is a statistical computation used to test significant difference between two mean from two distributions. Then, the
research hypothesis will be tested to answer the research problem no. 1. Then, to answer the research problem no. 2, the researcher distributed the questionnaire to the students. The questionnaire covered some aspects of students’ response related
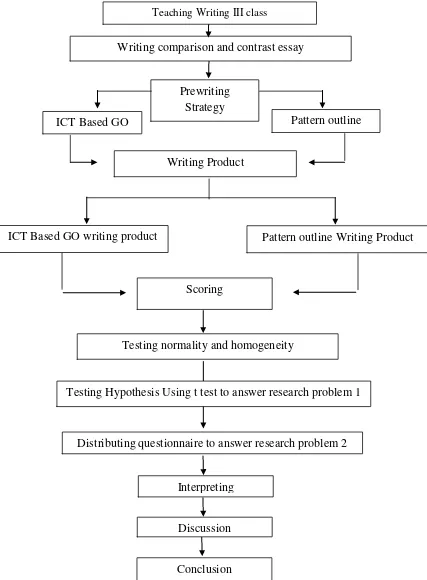
Figure 3.1 Steps in Collecting and Analyzing Data, and Testing Hypothesis
Prewriting Strategy
Pattern outline Writing Product Writing Product
Scoring
Testing normality and homogeneity ICT Based GO writing product
Pattern outline Writing comparison and contrast essay
Teaching Writing III class
ICT Based GO
Testing Hypothesis Using t test to answer research problem 1
Distributing questionnaire to answer research problem 2
Discussion Interpreting
F. Summary
This experiment study attempted to answer the two research problems: 1. whether there is a significant difference or not between writing with ICT
basedgraphic organizerand writing without using it on the students’ writing achievement; 2. In what ways, ICT based graphic organizer give contribution to students in the writing process at the fourth semester English Education Study
Program students of Palangka Raya State Islamic Institute 2015/2016 academic years. To answer the research problem, the study assigned the subjects to choose
an appropriate ICT based graphic organizer, before writing comparison and contrast essay. To see the effects of using ICT based graphic organizerthe subjects
were also assigned to write comparison and contrast essay without using ICT based graphic organizer. Here, they are directed to write comparison and contrast essay using pattern outline. Counterbalanced procedure wasemployed to control
the order effect of the two different treatments. Then, to answer the research problem number 2, the researcher distributed the questionnaire to the students. The questionnaire covered some aspects of students’ response related to the use of
ICT based graphic organizer in writing class. Such as: visualizing idea, maintaining grammar, building sentences, and generating idea.
Then, the two raters were involved in scoring the students’ writing products. Here, the raters were given training before rating the composition in order that they had better understanding on scoring criteria. The study focused on the
developed and organized the main idea of an essay. The data of the study