The need of representation approach to provide prospective physics teacher
with better reasoning ability and conceptual understanding
Sutopo1)
, Liliasari2), Bruce Waldrip3), Dadi Rusdiana4)
1)
Physics Depart ment , St at e Universit y of Malang, Indonesia e-mail: sut [email protected]
1)
Science Educat ion Program of Graduat e School Indonesia Universit y of Educat ion e-mail: [email protected]
3) Facult y of Educat ion, Monash Universit y, Churchill 3842
e-mail: bruce.w [email protected] 4)
Physics Educat ion Depart ment , Indonesia Universit y of Educat ion e-mail: [email protected]
Abstract
This article reports an explanatory QUAN-qual mixed method to assess students’ conceptual
understanding on mechanics and reasoning ability of the prospective physics teacher students (PPTS) in a public university in Indonesia. Quantitative data, i.e. PPTS’s conceptual understanding on
mechanics, was gathered using Mechanics Baseline Test (MBT) developed from the work of Hestenes and Wells (1992); whereas the qualitative data was gathered using rubrics to asses PPTS’s reasoning ability that includes both technical and conceptual validity, based on students’ open explanation on MBT. Subject of study consisted of 35 students who had taken Introductory Physics courses plus 24 students who had taken both Introductory Physics and Mechanics courses. This study shows: (1) PPTS’s MBT score was quite low (mean = 7.41 (max = 22), SD = 3.95), (2) most PPTS’s reasoning laid down on Level 1 (i.e. one level above the lowest level) for both technical (42%) and conceptual validity (about 45%), and (3) there are strong correlations among scores of MBT, technical aspect of reasoning, and conceptual validity aspect of reasoning. This study suggests the need of
representation approach to provide PPTS with better reasoning ability and conceptual understanding.
Keywords: representation approach, MBT, reasoning ability
INTRODUCTION
This paper is guided by a vision that future physics teachers should have deep content
knowledge and able to prepare their students for becoming scientifically literate citizens.
Scientifically literate person is one who able to use scientific processes in making personal
decision and to participate in discussion of scientific issues that affect society (NRC, 1996). In
line with this vision, National Science Education Standard (NRC, 1996) emphasizes the
importance of having students combine processes and scientific knowledge as they use
scientific explanation and critical thinking to develop their understanding of science. Therefore,
the prospective physics teachers need to have deep science knowledge and good reasoning
Physics teachers need to have strong content knowledge. If a teacher themselves does
not understand the nuances of a concept, the deep relationships between this particular concept
and other concepts, and the ways through which this concept was constructed by the physics
community, then translating these nuances into student understanding is impossible (Etkina,
2010). Physics teacher should have well-organized conceptual knowledge, not only within a
particular branch of physics (e.g. mechanics, electrodynamics, etc), but also across branches of
physics (e.g. mechanics and thermodynamics). In addition, teachers must understand the
processes used to establish new knowledge and determine the validity of claims (Eylon and
Bagno, 2006). Teachers also need to be able to communicate and clarify scientific ideas
effectively to students. It implies that, in describing scientific ideas, teachers need to be able to
use multiple modes of representation that lead to the opportunity to exchange and clarify
meanings (Ainswoth et al., 2011).
Reasoning ability is a prerequisite for producing better scientific explanation. Scientific
explanation includes a claim -a statement or conclusion that addresses the question or problem,
evidence -data that supports the claim, and reasoning -reasons that justifies the connections
between evidence and claim (McNeill and Krajcik, 2008). Constructing scientific explanations in
which students support their claims with appropriate evidence and reasoning is an important
element of scientific inquiry (NRC, 1996). Engaging in explanation can also help students
develop a deeper understanding of the science content. Accordingly, Waldrip et al. (2010)
conceptualized the science learning as the process and outcomes whereby students come to
understand how to interpret and construct scientific explanations using the conventions of the
subject.
The recent researches in science education argue that to learn science effectively,
students need to understand the different representations of science concepts and processes,
be able to translate a representation into one another, and understand their coordinated use in
representing scientific knowledge (Hubber et al., 2010). There are also various studies that
investigate the value of student-generated representations to promote understanding in science
(Waldrip et al., 2010). According to those studies, students participation only in teacher-design
activities may constrain opportunity for students’ learning. It implies the need of learners to use
their own representations. diSessa (2004) argued that students can productively design new
representations, if be given enough time and support, even approaching qualities of scientific
representation: precision (clear or unambiguous), conciseness (give minimal but sufficient
reminded that students need guidance in making links between their own representations and
authorized ones from the science community.
This paper reports a preliminary study that explored reasoning ability and conceptual
understanding in mechanics of the prospective physics teacher students (PPTS) in a public
university in Indonesia. PPTS’s conceptual understanding was assessed using Mechanical
Baseline Test (MBT), and reasoning ability was assessed using rubrics to code students’ written
explanation on MBT. Research questions included: (1) What is the PPTS’s score of MBT? (2)
What is the PPTS’s reasoning ability (both in aspect of technical and conceptual validity)? (3)
What is the relationship among PPTS’s scores of MBT, technical reasoning, and conceptual
validity? Based on the result of this study, we argue the importance to implement an alternative
approach to provide PPTS with the opportunities to improve their reasoning ability and acquire
better conceptual understanding. The approach is representation approach in which students
being able to state claims, reflect on what is appropriate evidence, as well as critique, modify,
and then refine their reasoning representations.
METHODOLOGY
Subject and time
This study was conducted on September 2011. Subject of study consisted of 59 students. They
were the undergraduate students of physics education program in one public university in
Indonesia. All of them had taken Introductory Physics courses and 24 of them had taken
Mechanics as well. Introductory Physics courses implement an approach that combines
calculus and non-calculus base, whereas mechanics course uses more calculus and analytical
approach. A representational approach has not been exposed in those courses.
Research design
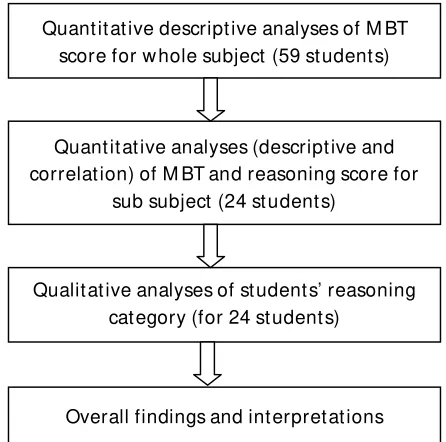
Research design was explanatory mixed method (Creswell and Clark, 2007). The research
started with collecting quantitative data of students’ score on MBT. Subject of study covered all
of 59 students. A descriptive analysis was implemented to get information about min, max, first
to third quartile, and mean of MBT score distribution. The second step was gathering qualitative
data of students’ reasoning ability based on students’ explanation written on MBT answer sheet.
Subjects of qualitative study consisted of 24 students who had taken both Introductory Physics
and Mechanics courses. The qualitative data was also quantified using scoring rubrics and then
described using descriptive analysis of students’ score on reasoning ability (both technical and
of MBT, technical reasoning ability, and conceptual validity used in reasoning. The final step
was formulating the overall findings and interpretations. Figure 1 shows the research design in a
brief.
Figure 1. QUAN-qual mixed method used in this study
Instruments
The instrument of MBT consists of 22 items extracted from the 25 original items adopted
from the work of Hestenes and Wells (1992); three of 25 items were dropped based on the pilot
study conducted in the middle of August 2011. The coefficient of Pearson’ product moment
correlation between item score with total score varies from r (52) = 0.32 (p < 0.05) to r (52) =
0.62 (p < 0.01). Three items have correlation coefficient that significant on p < 0.05 and the rest
are on p < 0.01. The instrument has Cronbach’s Alpha of 0.81. It means that the instrument has
“very good” internal consistency (Everitt and Skrondal, 2010) and provides good support for
internal consistency reliability (Morgan et al., 2004). The discrimination index of items varies
from 0.29 (moderate) to 0.86 (very high) and index of easiness varies from 0.12 (difficult) to 0.63
(moderate).There were two types of direction to response the test. The Introductory Physics sub
group (N = 35) chose one option that best represented their response whereas, for the others
students, i.e. introductory-mechanics group (N = 24), they were asked to give open explanation
in addition to choosing one best option. This different direction might influence student’s score
on MBT. It was a shortcoming of this method. The main purpose of the extra requirement was to
gather qualitative data needed for further analysis as shown in Figure 1. Quant it at ive descript ive analyses of M BT score for w hole subject (59 st udent s)
Quant it at ive analyses (descript ive and correlat ion) of M BT and reasoning score for
sub subject (24 st udent s)
Qualit at ive analyses of st udent s’ reasoning cat egory (for 24 st udent s)
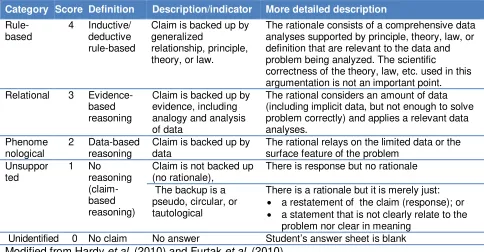
To assess students’ reasoning ability, two kinds of rubric shown in Table 1 and 2 were
implemented to code students’ open explanation. The rubrics were resulted from revision of
former version based on the pilot study. For checking the coding reliability, 25% of reasoning
units (follows the works of Hardy et al; 2010) on each data set had been coded by primary coder
(researcher) and one secondary independent coder. There were 22 × 24 = 528 units of
reasoning in total for each data set. The percentage agreements of two coders were 90% for
technical reasoning and 95% for conceptual validity. The codes of the primary coder were used
for further analyses.
Table 1. Rubric to code student’s reasoning quality (technical aspect)
Category Score Definition Description/indicator More detailed description
Rule-The rationale consists of a comprehensive data analyses supported by principle, theory, law, or definition that are relevant to the data and problem being analyzed. The scientific
correctness of the theory, law, etc. used in this argumentation is not an important point.
Relational 3
Evidence-based
The rational considers an amount of data (including implicit data, but not enough to solve problem correctly) and applies a relevant data analyses.
The rational relays on the limited data or the surface feature of the problem
Unsuppor
Claim is not backed up (no rationale),
There is response but no rationale
The backup is a pseudo, circular, or tautological
There is a rationale but it is merely just:
a restatement of the claim (response); or
a statement that is not clearly relate to the
problem nor clear in meaning
Unidentified 0 No claim No answer Student’s answer sheet is blank
Modified from Hardy et al. (2010) and Furtak et al. (2010)
Table 2. Rubric to code student’s reasoning quality (conceptual validity)
Category Score Definition Schema claim-rationale
Claim Rationale
Fully valid
3 Claim is correct and follows from the appropriate (relevant
and correct) backup
Ok Fully correct and
relevant
Partially valid
2 Claim is correct but the backup is not fully appropriate
(the backup is true but irrelevant or incomplete), or
Claim is incorrect since it follows from inappropriate (true
but irrelevant or incomplete) backup
Ok/ false
True but irrelevant or incomplete
Invalid 1 Claim is incorrect since:
It does not logically follow from backup, or
It follows a fully incorrect backup
Claim is correct BUT fully follows incorrect backup
False
0 No rationale, or the rational is tautological Ok/
false
RESULT AND DISCUSSION
MBT score
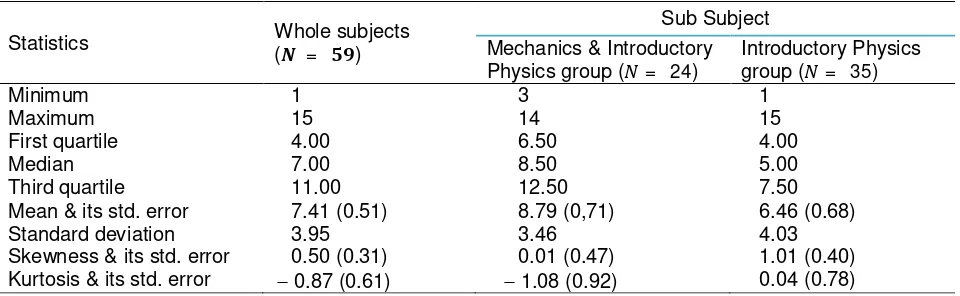
Table 3 shows the descriptive statistics of MBT score for whole subject (59 students who had
taken Mechanics and/or Introductory Physics courses) and for sub subject (group of 24 students
who had taken both Mechanics and Introductory Physics courses and of 35 students who had
not yet taken Mechanics).
Table 3. Descriptive statistics of MBT score, grouped by whole subjects and sub subjects
Statistics Whole subjects
( = )
Sub Subject Mechanics & Introductory
Physics group ( = 24)
Introductory Physics
group ( = 35)
Minimum 1 3 1
Maximum 15 14 15
First quartile 4.00 6.50 4.00
Median 7.00 8.50 5.00
Third quartile 11.00 12.50 7.50
Mean & its std. error 7.41 (0.51) 8.79 (0,71) 6.46 (0.68)
Standard deviation 3.95 3.46 4.03
Skewness & its std. error 0.50 (0.31) 0.01 (0.47) 1.01 (0.40)
Kurtosis & its std. error 0.87 (0.61) 1.08 (0.92) 0.04 (0.78)
Data on Table 3 show that students’ MBT score was quite low. The maximum score was
15 or about 68% of the expected maximum score (22), and more surprisingly, it was achieved
by students who had not yet taken Mechanics. The median (in whole subjects) shows that 50%
of students got score less than or equal to 7.00, and the value of third quartile shows that 75%
of students got score less than or equal to 11.00 or 50% of the expected maximum score.
However, the lowness of students’ achievement in MBT is likely also occurs in other country
than Indonesia. For example, Potgieter et al. (2010) reported that fresh students of South
African University achieved average score of 11.36 (max = 20) on mechanics test constructed
from MBT and FCI.
The means difference between sub subjects, i.e. 8.79 6.46 = 2.33, is significant at
= 0.05(2-tails). The result of Mann-Whitney U test yields =
−
2.51 and = 0.012 < 0.05.Therefore, it can be concluded that Mechanics-Introductory physics group achieved higher MBT
score than that of Introductory physics group. The d-effect size of this difference is about 0.61 in
the unit of pooled standard deviation. It is calculated using formula d = (MAMB)/SDpooled
(Morgan et al; 2004: 90), where SDpooled is =
( ) ( )
= 3.81.
Reasoning quality
Students’ reasoning quality was assessed using rubrics (Table 1 and 2) based on
students’ open explanation on MBT. Subjects of study included only group of students who had
taken both Mechanics and Introductory Physics course. Therefore, it is important to look at first
the similarity of sub subjects and whole subjects.
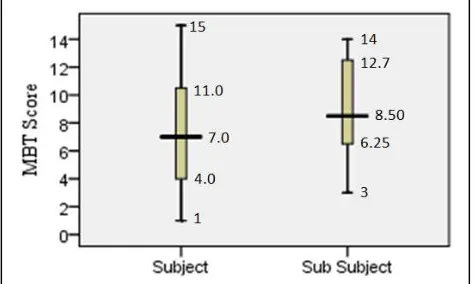
Table 3 shows that the skewness of the two data sets are within the interval of 1.0. It
means that they are normally distributed or at least approximately normal (Morgan et al., 2004).
Therefore, it is possible to use t-test for checking the difference between their means. Using
SPSS 16.0, the t-test values are = 1.50
,
= 81, and = 0.14 (2-tails). Since > 0.05then the difference between those means is not significant for = 0.05 (2-tails). The boxplots
of descriptive statistics of those data sets are shown in Figure 2. This statistical conclusion
allows us to perform further analysis based on the data sets drawing from sub subject of 24
students.
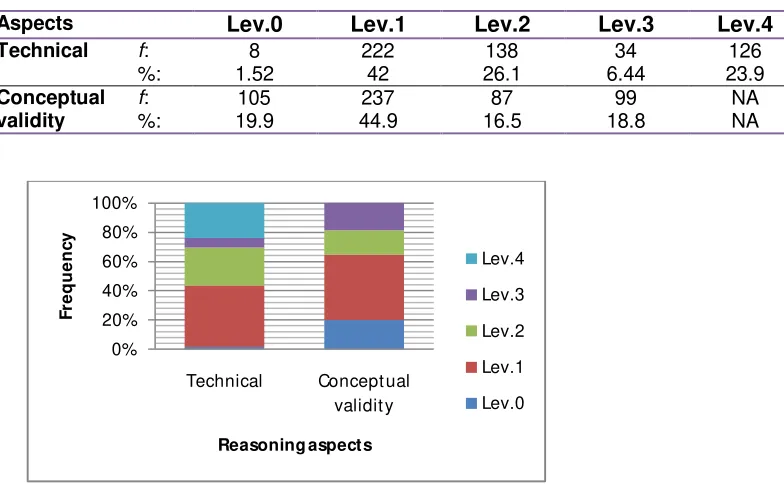
The coding results of students’ reasoning ability are summarized in Table 4 and Figure 3.
It is clear that most students’ reasoning laid down on Level 1 (i.e. one level above the lowest
level) for both technical (42%) and conceptual validity (about 45%). It means that in performing
reasoning, most students tend to make a claim without adequate backup. Their claims were not
mostly backed up, or the back up were pseudo, circular, or tautological. On the other hands, the
validity of their conceptual understanding employed in reasoning were also mostly invalid. Their
incorrect claims might caused by incorrectness of their understanding of physics concepts
underlining the problems, or by misleading in drawing conclusion.
Table 4. Frequency distribution of reasoning level, grouped by technical and conceptual validity. Figure 2. Boxplot s of M BT Score by w hole subject s (N = 59)
Aspects Lev.0 Lev.1 Lev.2 Lev.3 Lev.4 Total
Figure 3. Levels of reasoning ability by technical and conceptual validity
There were also many students who made correct claim but wrote an incorrect reason.
For example is students’ response on the problem shown in Figure 4. The correct answer is C.
Figure 4. An example of a problem that most students incorrectly answered.
Unfortunately, their reasons did not justify their response. Most students (12 of 16
students who chose option C in sub group of 24 students) wrote reason based on (incorrect)
principle: “the direction of acceleration is (always) in the direction of motion, or same as the
direction of velocity”. Although such reason has successfully brought students to the correct
answer, especially in this particular problem, the reason is clearly inappropriate. Such reason
should bring students to a claim that the acceleration in position II, for instance, is in the
direction of arrow 3; a claim which clearly incorrect. Students did not notice, for example, how
velocity changes from a point just before to a point just after position I. It meant that students did
not apply a very definition of acceleration: a= v or lim∆ → ∆
A block is sliding along a frict ionless ramp as show n in t he figure. What is the arrow t hat best represent s t he acceleration of the block w hen t he block is in the posit ion of I?
(A) 1 (B) 2 (C) 4 (D) 5
(E) None of t he arrow s; the accelerat ion is zero.
Correlation among scores of MBT, technical reasoning, and conceptual validity
Scoring students’ reasoning using rubrics shown in Table 1 and 2 yields descriptive
statistics shown in Table 5. It is clear that both data sets are normally distributed. Therefore, it is
possible to calculate correlation coeficients among data sets of MBT and reasoning scores
using Pearson’s product moment correlation. Figure 5 shows the resulted matrix correlations
among the three data sets.
Table 5. Descriptive statistics of students’ average reasoning score
Aspect Min Max Mean SD Skewness Kurtosis
Technical (max=4) 1.32 3.00 2.09 0.41 0.26 -0.51
Conceptual validity (max=3) 0.68 2.14 1.34 0.41 0.12 -1.04
MBT Technical reasoning Conceptual validity
MBT 1 r = 0.68, p < 0.01 r = 0.79, p < 0.01
Technical reasoning 1 r = 0.81, p < 0.01
Conceptual validity 1
Figure 5. Matrix correlation among scores of MBT and reasoning aspects (N = 24).
Figure 6 shows that there are strong correlation among scores of MBT, technical aspect of
reasoning, and conceptual validity aspect of reasoning. Therefore, it is critical to find out a new
learning approach that allows students (PPTS) to acquire better reasoning ability and deeper
conceptual understanding, especially concerning on physics topics that they will teach to their
future students. A representational approach to learning in which students being able to state
claims, reflect on what is appropriate evidence, as well as critique and modify the representation
and then refine both the reasoning process and the initial representation, is assumed to be
appropriate to provide students with those abilities.
Representation approach in science teaching is an argument-based inquiry in which
students negotiate their understanding of science concepts by engaging in the practices of
science. The core activity is “reasoning through representing”. Students both construct and
critique science knowledge through processes that include the posing of questions, the
construction of claims and the communication of evidence to support these claims (Waldrip et
al., 2010). Students not only respond to sanctioned representations, i.e. the representations
developed by experts and typically presented in physics textbooks, but also develop their own
representations. The approach encourages students to think critically and reason logically as
they negotiate understanding through talking, reading, and writing. Therefore, the prospective
physics teachers need such learning experiences that potentially give them the opportunities to
CONCLUSION
1. The MBT score of prospective physics teachers involved in this research was quite low. Its
mean was 7.41 (max = 22) with SD of 3.95.
2. The reasoning quality was also quite low. Its mean was about 2.1 (max = 4) for technical
aspect and about 1.3 (max = 3) for conceptual validity. Most reasoning levels laid down on
Level 1 (i.e. one level above the lowest level) for both technical (42%) and conceptual validity
(about 45%).
3. There are strong correlations among scores of MBT, technical aspect of reasoning, and
conceptual validity aspect of reasoning. The corresponding correlation coefficients varies
from r (24) = 0.68 to r (24) = 0.81, p < 0.01. This finding suggests the need of new approach
for giving students (PPTS) with much more opportunities to both develop their reason ability
and acquire better conceptual understanding.
4. A representation approach in which students (PPTS) being able to state claims, reflect on
what is appropriate evidence, as well as critique and modify the representation and then
refine both the reasoning process and the their representations, is assumed to be
appropriate to provide students with those abilities. However, it needs further study to find out
the adequate evidences as well as the possible strategies for implementing the approach.
REFERENCES
Ainsworth, S., Parin, V., and Tytler, R. (2011). Drawing to learn in science. Science,333: 1096-1097. Downloaded from www.sciencemag.org. on September 1, 2011.
Carolan, J., Prain,V. and Waldrip, B. (2008). Using representation for teaching and learning in Science. Teaching Science. 54(1), 18-23.
Creswell, J.W. and Clark, V.L.P. (2007). Designing and conducting mixed methods research.
Thousand Oaks, California: Sage Publications.
diSessa, A.A. (2004). Metarepresentation: native competence and targets for instruction.
Cognition and instruction. 22 (3), 293-331
Etkina, E. (2010). Pedagogical content knowledge and preparation of high school physics
teachers.
Phys. Rev. ST Phys. Educ. Res
.
6
, 020110
Eylon, B. and Bagno, E. (2006). Research-design model for professional development of teachers: designing lessons with physics education research. Phys. Rev. ST Phys. Educ. Res. 2, 020106
Furtak, E.M. et al. (2010). A framework for analyzing Evidence-Based Reasoning in science classroom discourse. Educational Assessment. 15 (3), 175-196
Hardy, I. et al. (2010). The analysis of classroom discourse: elementary school science curricula advancing reasoning with evidence. Educational Assessment. 15 (3), 197-221
Hestenes, D. and Wells, M. (1992). A Mechanics Baseline Test. The Physics Teacher 30, 159-166.
Hubber, P., Tytler, R, and Haslam, F. (2010). Teaching and learning about force with a representational focus: pedagogy and teacher change. Research in Science Education.
40,5–28
McNeill, K. L. and Krajcik, J. (2008). “Inquiry and scientific explanations: helping
students use evidence and reasoning”. In Luft, J. R., Bell, L. and Gess-Newsome, J. (Eds.): Science as Inquiry in the Secondary Setting, 121-133. Arlington, VA: NSTA Press.
Morgan, G.A et.al. (2004). SPSS for introductory statistics: use and interpretation 2ed. New Jersey: Lawrence Erlbaum Associates, Inc.
NRC: National Research Council. (1996). National science education standards. Washington DC: National Academy Press.
Potgieter, M. et al. (2010). Confidence versus Performance as an Indicator of the Presence of Alternative Conceptions and Inadequate Problem-Solving Skills in Mechanics.
International Journal of Science Education. 32 (11), 1407–1429.