Transporter Selection Based on Supply Chain
Management (SCM) Criteria
Using Analytical Hierarchy Process (AHP)
Irwan Chairuddin
STMT Trisakti [email protected] [email protected]
Hanifah
STMT Trisakti [email protected]
ABSTRACT
A company manager should be able to decide which transporter could be used and make sure the product arrives in time to the consumer’s address. It is expected that the manager could choose the transporter based on desired criteria using the method of AHP.
Keywords: criteria scm, application of AHP, transporter selection.
Introduction
Literally, supply chain means companies network which work together to create and deliver a product to end users. It consists of all parties involved, directly or indirectly, in fulfilling customers’ request. In this article, it means that companies as one party build networking to cooperate creating a delivery system that deliver products effectively and safely to the costumers. The supply chain not only includes the manufacturer and suppliers, but also transporters, warehouses, retailers, and customers themselves.
Based on the explanation above, the companies are required to have a reliable transportation system such as freight forwarding and logistics services companies which transporters deliver products from factory to distributors – from distributors to retailers – and of course from upstream to downstream. The companies have to choose and decide which transportation services
(this article will use term ‘transporter companies’) should be used based on the criteria of supply chains.
The companies’ constraints in making decision stem from uncertain or imperfect information they get. They also have to consider every choice they have. Analytical Hierarchy Process (AHP) which was introduced by Thomas L. Saaty (1994), is expected to solve the companies problem in selecting transporter companies.
From this study, the writer would like to see whether the AHP could lessen the difficulties faced by the companies to choose the appropriate transporter companies based on criteria of SCM.
Definition of AHP (Analytical Hierarchy Process)
multi-criteria into a hierarchy. According to Saaty (1994), hierarchy is defined as a representation of a complex problem in a multi-level structure that surrounds the first level; goals, and followed-level factors, criteria, sub-criteria, and so on down to the last level; alternative form. With the hierarchy, a complex problem can be decomposed into their groups, arranged into a hierarchy so that the form of the problem would seem more structured and systematic.
Transporter Criteria
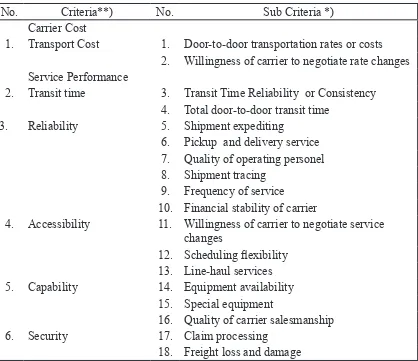
AHP is a tool of analysis called “decision support models” which will outline the multi-factor complex problem into a hierarchy. In this exposure, the writer points out that the company management is expected to choose 3 transporter companies that can fulfill the criteria of SCM and interests of the company. The transporter companies’ criteria and sub criteria based on Langley (2009) can be seen on Table 1.
AHP application to select the transporter companies
According to Mulyono (2000), to solve transporter problem using AHP, one must understand some principles, which are;
1. Decomposition
Decomposition means breaking up the whole issue into its elements. If you want to get the accurate results, the solution is breaking the whole issue to get the real problem which can be solved. Based on the definition above, the process of analysis is called hierarchy that is divided into two types: the complete and incomplete hierarchy. The complete hierarchy means all the elements in one level has all the elements for the next level. If there is a
missing element, then it is an incomplete hierarchy.
2. Comparative Judgment
It is the essential principle in applying AHP which will affect the elements. To obtain a good scale when comparing elements, it is needed to understand all the elements’ performance and purpose. The writer uses qualitative data to arrange the scale preferences in a matrix called “Pairwise Comparisons” according to Mulyono (2000) (see Table 2).
In assessing two preferences elements, reciprocal axiom applied; if object i is rated 3 times more important than j, object j must be equal to 1/3 times compared to the importance of the object i. Comparing two equal elements will generate number 1, which has the same important preferences. In fact, two unequal elements can be assessed equally important. If there is object n, the matrix of Pairwise Comparisons will be n x n. To get the matrix done, some preferences elements need to be assessed using n(n-1)
2 due to reciprocal
matrix and diagonal elements is equal to 1.
3. Synthesis of Priority
To get Local Priority, one needs to find eigenvector from the matrix of Pairwise Comparisons. But, it is not as easy as it seems because the matrix is on every level. In order to get the Global Priority for all levels, the Local Priority should be synthesized which has different procedure for each level. Based on that, the elements assessment of scale preferences by synthesizing is named Priority Setting.
4. Logical Consistency
article; first, similar objects can be identified based on the similarity and relevance, second, the objects has level of relation based on certain criteria.
In general, a hierarchical model of social problems starts from overall goal to criteria, sub-criteria, and alternatives to be chosen. In figure 1, there is an example of companies’ management has some chosen transporter companies which are transporter A, B, and C based on some criteria and companies interest.
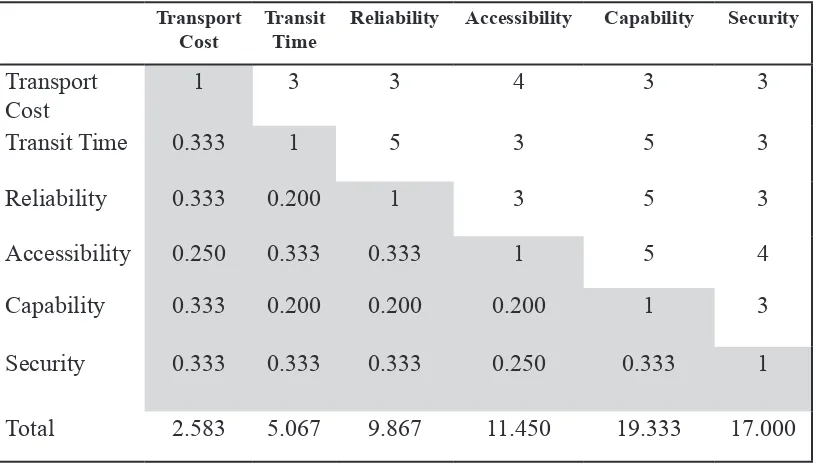
After finishing the complete hierarchy of selecting transporter, the next step is to create a matrix of Pairwise Comparisons which will be used to answer questions. A question for the main criteria for example is “how many times the value of the transport costs is more important than the transit time?” The answer can be found in the matrix element at position (1,2). As seen on Table 3 & 4, transport cost is less important (see Table 2) than transit time. It means the number 3 will be in the position (1,2) and based on the axiom of reciprocal figure, 1/3 will be placed in the transpose position which is position (2,1).
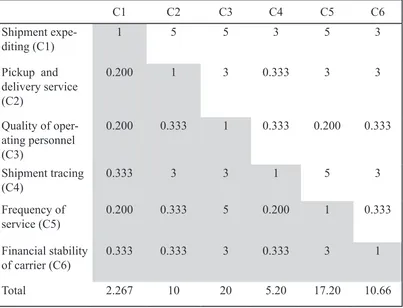
Each of these sub-criteria with its main criteria should also be assessed using Pairwise Comparisons and given weight. To get the actual weight, the result of sub-criteria is multiplied by the main weight. Examples of weighting sub-criteria from number 5 to number 10 with their main criteria; Reliability can be seen on Table 5 & 6.
The third step is to evaluate the transporter companies; A, B, and C from each sub criteria. Here is an example of sub Shipment Expediting (see Table 7 & 8).
The final step is calculating the
Pairwise Comparisons for three transporter companies as can be seen in the matrix below (see Table 9).
Estimation of the Consistency Ratio
AHP does not require an assessment of perfect consistency since AHP is completed with an index to measure the consistency of each matrix and for the entire hierarchy that enable to find inconsistency. In other words, although it is not necessary, the policy makers can change it due to the purpose of consistency in AHP which is not looking for perfection but accuracy. (Estimate the Consistency Ratio-my. safaribooksonline.com)
In some literature, the writer found that ‘if the consistency ratio is more than 10%, hence, the pairwise comparisons should be re-assessed’. The formula to find the consistency ratio is (see Table 10);
ʎ
max - n n - 1 CI =CR = Consistency ratio CI = Consistency Index
RI = Random Consistency Index
n 1 2 3 4 5 6 7 8 9 10 RI 0 0 0.58 0.9 1.12 1.24 1.32 1.41 1.45 1.49
Random Consistency Index (R1)
CI
RI CR =
matrices x weight/piority). When we are calculating the consistency ratio for the main criteria of the example above, this
The findings show that the Consis-tency Ratio is more than 10%. It is suggested that the pairwise should be revised to get the expected Consistency Ratio less than 10% if possible.
Conclusion
The selection of appropriate transporter companies can produce competitive advantage in business. To select best transporter companies, the company could use Analytical Hierarchy Process (AHP) which is a common model used for supporting management decision. Expert Choice version 11 is the suggested software to assess a good and perfect selection of coefficients.
The study suggests that empirical
data may be used to support the findings from AHP analysis of each transporter to lessen the subjectivity made by the decision makers.
References
Consistency Index and Consistency Ratio-Kardi Teknomo’s Tutorial. people. revoledu. com/kardi/.../Consistency. htm [ 5 August 2013 ]
Estimate the Consistency Ratio. my.safaribooksonline.com [ 5 August 2013].
Langley, CJ. et all. 2009. Managing Supply Chains A Logistics Approach. Edisi VIII. Canada: South – Western Cengage Learning.
Yanitha, M. 2011. Evaluasi Transporter Group C Dengan Menggunakan Metode Analitical Hierarchy Process (AHP) pada PT. YCH Indonesia Tahun 2010. [Skripsi]. Sekolah Tinggi Manajemen Transpor Trisakti.
Mulyono, S. 2002. Riset Operasi. Jakarta: Lembaga Penerbit Fakultas Ekonomi. Universitas Indonesia.
Pujawan, IN. 2005. Supply Chain Management. Edisi Pertama Cetakan Pertama. Surabaya: Penerbit Guna Widya.
Appendixs
No. Criteria**) No. Sub Criteria *)
Carrier Cost
1. Transport Cost 1. Door-to-door transportation rates or costs 2. Willingness of carrier to negotiate rate changes Service Performance
2. Transit time 3. Transit Time Reliability or Consistency 4. Total door-to-door transit time
3. Reliability 5. Shipment expediting
6. Pickup and delivery service 7. Quality of operating personel 8. Shipment tracing
9. Frequency of service 10. Financial stability of carrier
4. Accessibility 11. Willingness of carrier to negotiate service changes
12. Scheduling flexibility 13. Line-haul services 5. Capability 14. Equipment availability
15. Special equipment
16. Quality of carrier salesmanship
6. Security 17. Claim processing
18. Freight loss and damage
Table 1 Transporter Criteria and sub-criteria
Source: ** Langley, et all (2009)
* Edward J. Bardi, et all in Langley at all (2009:277)
Table 2 Interpretation of Pairwise Comparison on AHP
Description A B B/A
A is less important than B 1 1 1/1
A is as important as B 3 1 1/3
A is more important than B 5 1 1/5
A is significantly more important than B 7 1 1/7
Figure 1 Complete Hierarchy of Selecting Transporter
(*) Transporter A is rated by all sub-criteria (18 items) --- to simplify the picture above, the eighteenth arrow of sub-criteria is not made, as well as transporter B and C. It will be much more faster using Expert Choice version 11 to operate AHP with many criteria and sub criteria.
Transport Cost
Transit Time
Reliability Accessibility Capability Security
Transport Cost
1 3 3 4 3 3
Transit Time 0.333 1 5 3 5 3
Reliability 0.333 0.200 1 3 5 3
Accessibility 0.250 0.333 0.333 1 5 4
Capability 0.333 0.200 0.200 0.200 1 3
Security 0.333 0.333 0.333 0.250 0.333 1
Total 2.583 5.067 9.867 11.450 19.333 17.000
Table 3 A matrix of Pairwise Comparisons of the Main Criteria
Tingkat 1:
Fokus
Tingkat 2: Kriteria
Transport Cost
Transit time
Relia-bility
Accessi- bility
Capa-bility
Secu-rity
Sub riteria 1 2 3 4 5 6 7 8 9 10 11 12 13 14 15 16 17 18
Tingkat 3:
Alternatif
Peng-ankut
A(*)
Pengangkut
B(*)
Peng-angkut
C(*)
Selecting
Transport Cost
Transit
Time Reliability
Accessi-bility Capability Security Weights**)
Transport Cost
0.387 0.592 0.304 0.349 0.155 0.176 0.327
Transit Time 0.129 *) 0.197 0.507 0.262 0.259 0.176 0.255
Reliability 0.129 0.039 0.101 0.262 0.259 0.176 0.161
Accessibility 0.097 0.066 0.034 0.087 0.259 0.235 0.130
Capability 0.129 0.039 0.020 0.017 0.052 0.176 0.072
Security 0.129 0.066 0.034 0.022 0.017 0.059 0.054
C1 C2 C3 C4 C5 C6
Shipment expe-diting (C1)
1 5 5 3 5 3
Pickup and delivery service (C2)
0.200 1 3 0.333 3 3
Quality of oper-ating personnel (C3)
0.200 0.333 1 0.333 0.200 0.333
Shipment tracing (C4)
0.333 3 3 1 5 3
Frequency of service (C5)
0.200 0.333 5 0.200 1 0.333
Financial stability of carrier (C6)
0.333 0.333 3 0.333 3 1
Total 2.267 10 20 5.20 17.20 10.66
Table 5 A matrix of Pairwise Comparison for sub criteria number 5 to 10 with the main criteria; Reliability
Table 4 Weights for Each Major Criteria
*) Retrieved from 0.333/2.583
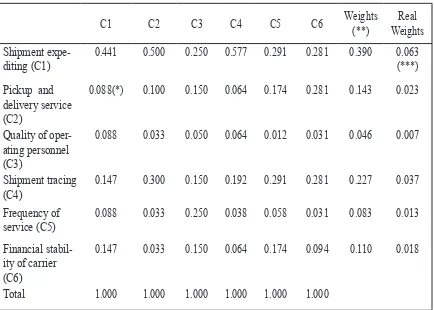
C1 C2 C3 C4 C5 C6 Weights (**)
Real Weights Shipment
expe-diting (C1)
0.441 0.500 0.250 0.577 0.291 0.281 0.390 0.063 (***) Pickup and
delivery service (C2)
0.088(*) 0.100 0.150 0.064 0.174 0.281 0.143 0.023
Quality of oper-ating personnel (C3)
0.088 0.033 0.050 0.064 0.012 0.031 0.046 0.007
Shipment tracing (C4)
0.147 0.300 0.150 0.192 0.291 0.281 0.227 0.037 Frequency of
service (C5)
0.088 0.033 0.250 0.038 0.058 0.031 0.083 0.013
Financial stabil-ity of carrier (C6)
0.147 0.033 0.150 0.064 0.174 0.094 0.110 0.018
Total 1.000 1.000 1.000 1.000 1.000 1.000
Transporter A Transporter B Transporter C
Transporter A 1. 3 5
Transporter B 0.333 1 3
Transporter C 0.200 0.333 1
Total 1.533 4.333 9
Transporter A Transporter B Transporter C Weights
Transporter A 0.652 0.692 0.556 0.633
Transporter B 0.217 0.231 0.333 0.260
Transporter C 0.130 0.077 0.111 0.106
Total 1 1 1
Table 6 Weights for each sub-criterion number 5 to 10 with main criteria; Reliability
Table 7 Transporter Companies Evaluation of Sub Criteria for Expediting Shipment
Table 8 Weights for Transporter Companies Evaluation of Sub Criteria for Expediting Shipment
(*) Obtained from 0.2/2.267 (**) Obtained from the average laterally
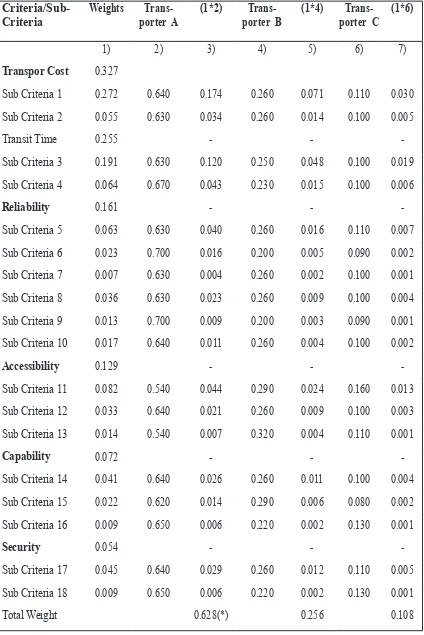
Criteria/Sub-Criteria
Weights
Trans-porter A
(1*2)
Trans-porter B
(1*4)
Trans-porter C
(1*6)
1) 2) 3) 4) 5) 6) 7)
Transpor Cost 0.327
Sub Criteria 1 0.272 0.640 0.174 0.260 0.071 0.110 0.030 Sub Criteria 2 0.055 0.630 0.034 0.260 0.014 0.100 0.005
Transit Time 0.255 - -
-Sub Criteria 3 0.191 0.630 0.120 0.250 0.048 0.100 0.019 Sub Criteria 4 0.064 0.670 0.043 0.230 0.015 0.100 0.006
Reliability 0.161 - -
-Sub Criteria 5 0.063 0.630 0.040 0.260 0.016 0.110 0.007 Sub Criteria 6 0.023 0.700 0.016 0.200 0.005 0.090 0.002 Sub Criteria 7 0.007 0.630 0.004 0.260 0.002 0.100 0.001 Sub Criteria 8 0.036 0.630 0.023 0.260 0.009 0.100 0.004 Sub Criteria 9 0.013 0.700 0.009 0.200 0.003 0.090 0.001 Sub Criteria 10 0.017 0.640 0.011 0.260 0.004 0.100 0.002
Accessibility 0.129 - -
-Sub Criteria 11 0.082 0.540 0.044 0.290 0.024 0.160 0.013 Sub Criteria 12 0.033 0.640 0.021 0.260 0.009 0.100 0.003 Sub Criteria 13 0.014 0.540 0.007 0.320 0.004 0.110 0.001
Capability 0.072 - -
-Sub Criteria 14 0.041 0.640 0.026 0.260 0.011 0.100 0.004 Sub Criteria 15 0.022 0.620 0.014 0.290 0.006 0.080 0.002 Sub Criteria 16 0.009 0.650 0.006 0.220 0.002 0.130 0.001
Security 0.054 - -
-Sub Criteria 17 0.045 0.640 0.029 0.260 0.012 0.110 0.005 Sub Criteria 18 0.009 0.650 0.006 0.220 0.002 0.130 0.001
Total Weight 0.628(*) 0.256 0.108
Table 9 Recap of Weight Criteria, Sub-Criteria and Transporters
(*) Obtained from (0.272 x 0.640 0.055 x 0.63 0.191 x 0.009 x 0.630 ... 0.650)