Distribution, Abundance and Biological Studies of Economically Important Fishes in
the South China Sea, Area II: Sarawak, Sabah and Brunei Darussalam Waters.
Richard Rumpet, Daud Awang, Jamil Musel and Rooney Biusing*
Fisheries Research Institute, Sarawak Branch, Department of Fisheries Malaysia, P.O. Box 2243, 93744 Kuching, Sarawak, Malaysia.
* Fisheries Research Center, 89400 Likas, Kota Kinabalu, Sabah, Malaysia.
ABSTRACT
The studies were carried out between 9th July and 3rd August 1996 (3rd cruise) and 30th April and
30th May, 1997 (4th cruise) in the Exclusive Economic Zone of Sarawak and the western part of Sabah.
The species distribution, abundance, composition and length-weight relationships of some commer-cially important fish were investigated and compared for both cruises. The results indicates that the overall catch rate ranged from 3.5 to 194 kg/hr and averaged at 55.9 kg/hr during the 3rd cruise. For
the 4th cruise, it ranged from 10.9 to 90.5 kg/hr and averaged at 50.2 kg/hr. During the 3rd cruise,
46.9% of the catch were dominated by demersal fish followed by 41.6% trash fish, 7.8% pelagic fish and 3.1% cephalopod. Priacanthidae was the most dominant family, which made up of 14.1% of the catch followed by Nemipteridae (10.8%), Carangidae (5.0%), Lutjanidae (3.7%) and Mullidae (2.1%). The ten most dominant species found during the 3rd cruise were 1. Priacanthus macracanthus (13.2%),
2. Nemipterus bathybius (3.3%), 3. Abalistes stellaris (2.8%), 4. Arius spp.(2.5%), 5. N. nematophorus
(2.2%), 6. Gymnocranius griseus (1.9%), 7. N. marginatus (1.7%), 8. Sepia spp. (1.7%),9. Decapterus spp. (1.6%) and 10. Carcharhinus spp (1.3%). During the 4th cruise, the family Nemipteridae (12.7%)
formed the most dominant fish family followed by Carangidae (8.7%), Mullidae (7.1%), Lutjanidae (4.9%) and Priacanthidae (2.2%). The ten most dominant species were: 1. Loligo spp. (5.7%), 2. Nemipterus bathybius (4.2%), 3. Abalistes stellaris (4.0%), 4. Upeneus moluccensi (3.8%), 5. Nemipterus nemurus (3.8%), 6. Gymnocranius griseus (3.2%), 7. Carangoides malabaricus (3.2%), 8. Plectorhynchus pictus (3.1%), 9. Upeneus bensasi (2.4%) and 10. Arius spp. (1.8%). The morpho-metric study shows that the population of fish are normally distributed.
Key words: Distribution, abundance, biological, fish, Sarawak, Sabah, Brunei Darussalam
Introduction
In 1995, a total of 1,108,436 m.t. of marine fish was landed in Malaysia and valued at RM2.71 billion. Out of this total landings, 99,255 m.t. were landed in Sarawak and 166,462 m.t. in Sabah (Anon., 1995). Demersal fish was considered as one of the important fish resources in Sarawak and Sabah. The total landings by trawl net (which consisted mainly of demersal fish) were estimated at 61,958 m.t in Sarawak and 49,106 m.t. in Sabah. Pelagic fish production in Sarawak was very low (about 1,313 m.t. only) as compared to the landings in Sabah i.e. 28,875 m.t.
Materials and Methods
Two surveys were conducted using KK MANCHONG, a research vessel of the Fisheries Re-search Institute (FRI), Sarawak Branch, Department of Fisheries, Malaysia on 9th July until 3rd August
1996 (3rd cruise) and 30th April until 30th May 1997 (4th cruise) respectively. The principal
character-istics of KK MANCHONG are given as follows:
Type/Hull : Fibre Reinforced Plastic (FRP)
Length : 27.50 m
Breadth : 6.40 m
Depth : 3.00 m
Draft : 2.20 m
Gross tonnage : 150 tons Registered tonnage : 45 tons
Main engine : 900 hp Yanmar diesel engine Speed (trial max.): 12.48 knots
Complement (crew and scientists): 22 persons
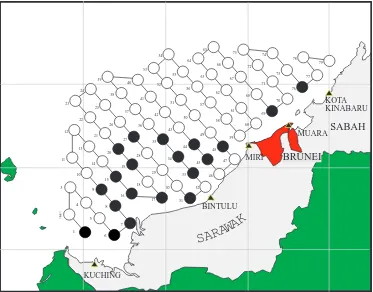
The sampling gear used in these studies was a high opening otter trawl net as shown in Figure 1 with a horizontal net opening of 20.5 m and a cod-end mesh size of 38 m. A diagrammatic presen-tation of the net is shown in Figure 1. The net was towed at 3.5 knots for a one-hour duration at a specific station which coincides with its acoustic station (Figure 2).
During the surveys the total catch of each haul was sorted out according to commercial fish and trash fish without considering size categories. Subsequently the commercial fish species were sorted ac-cording to demersal fish, pelagic fish, cephalopods, shrimps, crabs, shells and true trash fish i.e. those which have no commercial values.
The dominant fish species from each sampling station were kept frozen and brought back to the laboratory of the FRI, Sarawak Branch for further biological examinations. The measurements on total length (L)an total body weight (W) of individual fish to the nearest millimeter and gram respec-tively were made in the laboratory.
The frequency distribution patterns for a number of fish species in the combined samples from entire samplings stations were examined. Length-weight relationships were determined separately for each fish species. Equation of the form W=aLb, where a and b are constants of regression, were fitted by transforming the data into logarithms and deriving the regression line by the least square method (Sparre and Venema, 1992).
Results
Overall catch rate
Altogether 17 stations were sampled successfully with one haul per station during the 3rd cruise.
During the 4th cruise, only 12 stations were successfully trawled. Appendix 1 and 2 shows the overall
catch rate of the various species caught from individual stations of the two cruises. The total catch (inclusive of both commercial and trash fish) from individual stations ranged from 3.5 kg to 194.0 kg for the 3rd cruise and 10.9 to 90.5 kg for the 4th cruise. The overall average catch rate for 3rd cruise was
55.9 kg/hr. Of this, 32.6 kg (58.3%) were commercial fish and 23.3 kg (41.7%) trash fish (Table 1). During the 4th cruise, the overall average catch rate was 50.2 kg/hr. It comprised of about 34.4 kg
238
313 238313
57
319 213319
Species composition
Catch percentage by weight of each species and family caught during both cruises were shown in Table 1 and 2 respectively. During the 3rd cruise, commercial fish formed 58.5% of the total catch
while the remaining 41.5% made up of trash fish. Among the commercial fish, demersal fish group was the most dominant category making up 46.9% of the total catch followed by pelagic fish, 7.8% and cephalopods, 3.1%.
During the 4th cruise, commercial fish made up of 68.7% of the total catch and the remaining 31.4%
was trash fish. The most dominant commercial fish group was demersal fish (44.6%), followed by cephalopods (11.3%) and pelagic fish (10.8%). Table 3 below shows the summarized catch composi-tion of the major fishery group from the entire sampling stacomposi-tions of the cruises.
Numerous species, genera and families of fish were caught during the surveys. Some of these were much more dominant than the others in terms of catch percentage by weight. During the 3rd
cruise (Table 1), the family Priacanthidae appeared to be the most dominant fish family (14.1%), followed by Nemipteridae (10.8%), Carangidae (5.0%), Lutjanidae (3.7%), and Mullidae (2.1%). On the other hand, the family Nemipteridae (12.7%) formed the most dominant fish family during the 4th
cruise (Table 2) followed by Carangidae (8.7%), Mullidae (7.1%), Lutjanidae (4.9%) and Priacanthidae (2.2%).
Ten most dominant species caught during the 3rd cruise were: 1. Priacanthus macracanthus
(13.2%), 2. Nemipterus bathybius (3.3%), 3. Abalistes stellaris (2.8%), 4. Arius spp. (2.5%), 5.
Nemipterus nematophorus (2.2%), 6. Gymnocranius griseus (1.9%), 7. Nemipterus marginatus (1.7%), 8. Sepia spp. (1.7%), 9. Decapterus spp. (1.6%) and 10. Carcharhinus spp. (1.3%).
During the 4th cruise, the ten most dominant species were: 1. Loligo spp. (5.7%), 2. Nemipterus
bathybius (4.2%), 3. Abalistes stellaris (4.0%), 4. Upeneus moluccensi (3.8%), 5. Nemipterus nemurus
(3.8%), 6. Gymnocranius griseus (3.2%), 7. Carangoides malabaricus (3.2%), 8. Plectorhynchus pictus (3.1%), 9. Upeneus bensasi (2.4%) and 10. Arius spp. (1.8%).
Abundance
The highest overall catch rate during the 3rd cruise was recorded at station 44 (193.7 kg/hr) and
station 33 (160.2 kg/hr). The lowest catch rate was at station 35 (3.5 kg/hr) and station 10 (9.7 kg/hr). During the 4th cruise, the highest overall catch rate was attained at station 31 (90.46 kg/hr) and station
7 (82.0 kg/hr). Meanwhile, the lowest overall catch rate was registered at station 16 (12.5 kg/hr) and station 9 (22.4 kg/hr).
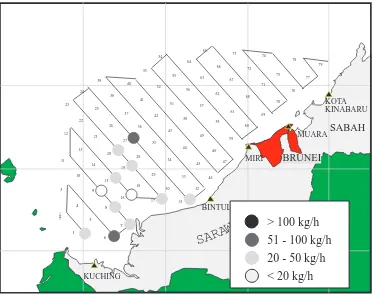
Commercial fish have an average catch rate of 32.6 kg/hr during the 3rd cruise. The highest
catch rate was at station 44, (119.3 kg/hr) and station 33 (94.2 kg/hr) as shown in Figure 3. Demersal fish which was the most dominant among the fish group registered an average catch rate of 26.1 kg/hr and appeared to be most abundant at station 44 with catch rate of 106.7 kg/hr and station 33 (75.6 kg/ hr). Pelagic fish which have an average catch rate of 4.4 kg/hr was more abundant at station 33 and 44 with catch rate of 16.1 kg/hr and 11.0 kg/hr respectively. Cephalopods attained an average catch rate of 1.7 kg/hr and were more abundant at station 69 with catch rate of 10.2 kg/hr.
During the 4th cruise, commercial fish registered an average catch rate of 34.4 kg/hr. The
high-est catch rate was at station 27, (62.9 kg/hr) and station 6, (51.0 kg/hr) as shown in Figure 4. Demersal fish attained an average catch rate of 22.4 kg/hr and the highest catch rate was at station 27 (57.5 kg/ hr). Pelagic fish have an average catch rate of 5.4 kg/hr and was most abundant at station 7 and 6 with catch rate of 16.5 kg/hr 13.9 kg/hr. Cephalopods have an average catch rate of 5.6 kg/hr and were more abundant at station 6 (16.6 kg/hr).
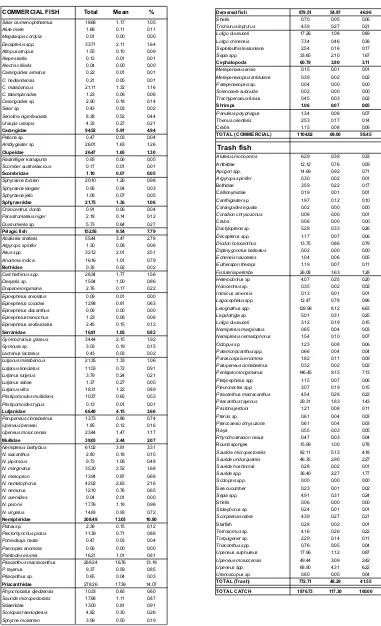
Table 1 Average catch rate (kg/hr) and percentage composition from entire sampling stations (3rd Cruise )
COMMERCIAL FISH Total Mean %
Selar crumenophthalmus 18.68 1.17 1.05
Atule mate 1.68 0.11 0.11
Megalaspis cordyla 0.01 0.00 0.00
Decapterus spp. 33.71 2.11 1.64
Atropus atropus 1.55 0.10 0.09
Alepes kalla 0.12 0.01 0.01
Alectis cilliaris 0.04 0.00 0.00
Carangoides armatus 0.22 0.01 0.01
C. hedlandensis 0.21 0.05 0.01
C. malabaricus 21.11 1.32 1.16
C. talamparoides 1.23 0.08 0.06
Carangoides sp. 2.90 0.18 0.14
Selar sp. 0.43 0.03 0.02
Seriolina nigrofasciata 8.38 0.52 0.44
Uraspis uraspis 4.33 0.27 0.21
Carangidae 94.52 5.91 4.94
Pellona sp. 0.47 0.03 0.04
Amblygaster sp. 26.01 1.63 1.26
Clupeidae 26.47 1.65 1.30
Rastrelliger kanagurta 0.93 0.06 0.05
Scomber australascicus 0.17 0.01 0.01
Scombridae 1.10 0.07 0.05
Sphyraena forsteri 20.10 1.26 0.98
Sphyraena langsar 0.56 0.04 0.03
Sphyraena jello 1.08 0.07 0.05
Sphyraenidae 21.75 1.36 1.06
Chirocentrus dorab 0.91 0.06 0.04
Parastromateus niger 2.18 0.14 0.12
Dussumieria sp. 5.73 0.64 0.27
Pelagic fish 152.56 9.54 7.79
Abalistes stellaris 55.44 3.47 2.78
Argyrops spinifer 1.30 0.08 0.06
Arius spp. 32.12 2.01 2.51
Ariomma indica 16.16 1.01 0.79
Bothidae 0.35 0.02 0.02
Carcharhinus spp. 28.34 1.77 1.56
Dasyatis sp. 15.94 1.00 0.86
Drepane longimana 2.76 0.17 0.22
Epinephelus areolatus 0.09 0.01 0.00
Epinephelus coioides 12.98 0.81 0.63
Epinephelus diacanthus 0.06 0.00 0.00
Epinephelus heniochus 1.23 0.08 0.06
Epinephelus sexfasciatus 2.45 0.15 0.12
Serranidae 16.81 1.05 0.82
Gymnocranius griseus 34.44 2.15 1.92
Gymnura sp. 3.03 0.19 0.15
Lactarius lactarius 0.43 0.03 0.02
Lutjanus malabaricus 21.35 1.33 1.06
Lutjanus lineolatus 11.53 0.72 0.91
Lutjanus lutjanus 3.79 0.24 0.21
Lutjanus sebae 1.37 0.27 0.05
Lutjanus vitta 18.31 1.22 0.89
Pristipomoides multidens 10.37 0.65 0.53
Pristipomoides typus 0.13 0.01 0.01
Lutjanidae 66.40 4.15 3.66
Parupeneus cinnabarinus 13.73 0.86 0.74
Upeneus bensasi 1.85 0.12 0.16
Upeneus moluccensis 23.44 1.47 1.17
Mullidae 39.03 2.44 2.07
Nemipterus bathybius 61.02 3.81 3.31
N. isacanthus 2.80 0.18 0.15
N. japonicus 9.73 1.08 0.48
N. marginatus 35.30 2.52 1.68
N. mesoprion 13.94 0.87 0.68
N. nematophorus 42.02 2.63 2.16
N. nemurus 12.10 0.76 0.65
N. oveniides 0.04 0.01 0.00
N. peronii 17.76 1.18 0.96
N. virgatus 14.83 0.93 0.72
Nemipteridae 208.48 13.03 10.80
Platax sp. 2.38 0.15 0.12
Plectorhynchus pictus 11.39 0.71 0.86
Pomadasys hasta 0.47 0.03 0.04
Psenopsis anomala 0.06 0.00 0.00
Psettodes erumei 16.21 1.01 0.81
Priacanthus macracanthus 268.24 16.76 13.19
P. tayenus 9.37 0.59 0.85
Priacanthus sp. 0.65 0.04 0.03
Priacanthidae 278.26 17.39 14.07
Rhynchobatus djeddensis 10.33 0.65 0.60
Saurida micropectoralis 17.68 1.11 0.87 Sciaenidae 13.00 0.81 0.91
Scolopsis taeniopterus 4.82 0.30 0.26
Sphyrna mokarran 3.99 0.50 0.19
Demersal fish 879.51 54.97 46.96
Shells 0.70 0.05 0.06
Trichiurus lepturus 4.39 0.27 0.21
Loligo duvauceli 17.26 1.08 0.89
Loligo chinensis 7.34 0.46 0.38
Sepioteuthis lessoniana 2.54 0.16 0.17
Sepia spp. 33.65 2.10 1.67
Cephalopods 60.79 3.80 3.11
Metapenaeus ensis 0.15 0.01 0.01
Metapenaeopsis stridulans 0.39 0.02 0.02
Parapenaeopsis sp. 0.04 0.00 0.00
Solenocera subnuda 0.02 0.00 0.00
Trachypenaeus fulvus 0.45 0.03 0.02
Shrimps 1.06 0.07 0.05
Panulirus polyphagus 1.34 0.08 0.07
Thenus orientalis 2.53 0.17 0.14 Crabs 1.15 0.08 0.06
TOTAL (COMMERCIAL) 1104.02 69.00 58.45
Trash fish
Aluterus monoceros 6.29 0.39 0.33 Anthiidae 12.12 0.76 0.59
Apogon spp. 14.69 0.92 0.71
Argyrops spinifer 0.30 0.02 0.01 Bothidae 3.59 0.22 0.17 Callionymidae 0.19 0.01 0.01
Canthigaster sp. 1.97 0.12 0.10
Carangoides equala 0.02 0.00 0.00
Coradion chrysozonus 0.06 0.00 0.01 Crabs 0.06 0.00 0.00
Dactyloptena sp. 5.28 0.33 0.26
Decapterus spp. 1.17 0.07 0.06
Diodon holocanthus 13.75 0.86 0.79
Dipterygonotus balteatus 0.02 0.00 0.00
Echeneis naucrates 1.04 0.06 0.05
Eutherapon theraps 1.19 0.07 0.11
Fistularia petimba 26.08 1.63 1.28
Heterodontus sp. 4.07 0.25 0.20
Holocentrus sp. 0.35 0.02 0.02
Inimicus sinensis 0.13 0.01 0.01
Lagocephalus spp. 12.47 0.78 0.86
Leiognathus spp. 129.98 8.12 6.63
Lepidotrigla sp. 5.01 0.31 0.25
Loligo duvauceli 3.12 0.19 0.15
Nemipterus marginatus 0.65 0.04 0.03
Nemipterus nematophorus 1.54 0.10 0.07
Octopus sp. 1.23 0.08 0.06
Paramonacanthus spp. 0.66 0.04 0.04
Parascolpsis eriomma 1.82 0.11 0.09
Parupeneus cinnabarinus 0.32 0.02 0.02
Pentaprion longimanus 146.45 9.15 7.13
Platycephalus spp. 1.15 0.07 0.06
Pleuronectes spp. 3.07 0.19 0.15
Priacanthus macracanthus 4.54 0.28 0.22
Priacanthus tayenus 29.31 1.83 1.43
Pristotis jerdoni 1.21 0.08 0.11
Pterois sp. 0.61 0.04 0.03
Pterocaesio chrysozona 0.61 0.04 0.03 Rays 0.55 0.03 0.05
Rhynchostracion nasus 0.47 0.03 0.04 Round sponges 15.99 1.00 0.78
Saurida micropectoralis 82.11 5.13 4.18
Saurida undosquamis 46.35 2.90 2.27
Saurida hoshinonis 0.28 0.02 0.01
Saurida spp. 36.40 2.27 1.77
Scolopsis spp. 0.00 0.00 0.00 Sea cucumber 0.23 0.01 0.02
Sepia spp. 4.91 0.31 0.24
Shells 0.06 0.00 0.00
Stolephorus sp. 0.24 0.01 0.01
Scorpaena scabra 4.39 0.27 0.21 Starfish 0.28 0.02 0.01
Tetrosomus sp. 4.16 0.26 0.22
Torquigener sp. 2.29 0.14 0.11
Triacanthus spp. 0.76 0.05 0.04
Upeneus sulphureus 17.96 1.12 0.87
Upeneus moluccensis 49.44 3.09 2.42
Upeneus spp. 68.90 4.31 6.22
Uranoscopus sp. 0.80 0.05 0.04
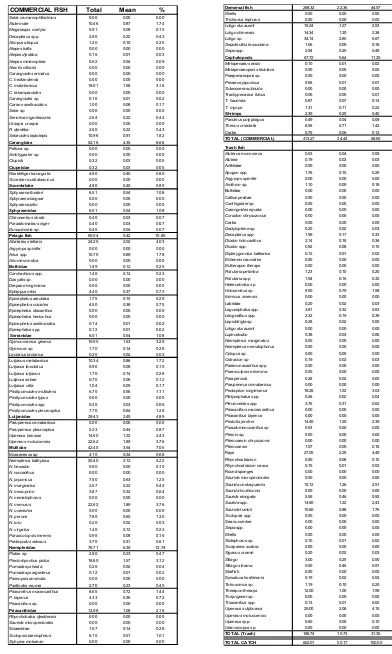
Table 2 Average catch rate (kg/hr) and percentage composition from entire sampling stations (4th Cruise )
COMMERCIAL FISH Total Mean %
Selar crumenophthalmus 0.00 0.00 0.00
Atule mate 10.46 0.87 1.74
Megalaspis cordyla 0.91 0.08 0.15
Decapterus spp. 2.60 0.22 0.43
Atropus atropus 1.20 0.10 0.20
Alepes kalla 0.00 0.00 0.00
Alepes djedaba 0.16 0.01 0.03
Alepes melanoptera 0.52 0.04 0.09
Alectis cilliaris 0.00 0.00 0.00
Carangoides armatus 0.00 0.00 0.00
C. hedlandensis 0.00 0.00 0.00
C. malabaricus 19.01 1.58 3.16
C. talamparoides 0.00 0.00 0.00
Carangoides sp. 0.10 0.01 0.02
Caranx sexfasciatus 1.00 0.08 0.17
Selar sp. 0.00 0.00 0.00
Seriolina nigrofasciata 2.64 0.22 0.44
Uraspis uraspis 0.00 0.00 0.00
R. djedeba 2.60 0.22 0.43
Selaroides leptolepis 10.96 0.91 1.82 Carangidae 52.16 4.35 8.66
Pellona sp. 0.00 0.00 0.00
Amblygaster sp. 0.00 0.00 0.00
Clupids 0.32 0.03 0.05
Clupeidae 0.32 0.03 0.05
Rastrelliger kanagurta 4.80 0.40 0.80
Scomber australascicus 0.00 0.00 0.00 Scombridae 4.80 0.40 0.80
Sphyraena forsteri 6.51 0.54 1.08
Sphyraena langsar 0.00 0.00 0.00
Sphyraena jello 0.00 0.00 0.00 Sphyraenidae 6.51 0.54 1.08
Chirocentrus dorab 0.40 0.03 0.07
Parastromateus niger 0.40 0.03 0.07
Dussumieria sp. 0.45 0.04 0.07 Pelagic fish 65.04 5.42 10.80
Abalistes stellaris 24.25 2.02 4.03
Argyrops spinifer 0.00 0.00 0.00
Arius spp. 10.70 0.89 1.78
Ariomma indica 0.00 0.00 0.00
Bothidae 1.49 0.12 0.25
Carcharhinus spp. 1.40 0.12 0.23
Dasyatis sp. 0.00 0.00 0.00
Drepane longimana 0.00 0.00 0.00
Ephippus orbis 4.40 0.37 0.73
Epinephelus areolatus 1.75 0.15 0.29
Epinephelus coioides 4.50 0.38 0.75
Epinephelus diacanthus 0.00 0.00 0.00
Epinephelus heniochus 0.00 0.00 0.00
Epinephelus sexfasciatus 0.14 0.01 0.02
Epinephelus spp. 0.12 0.01 0.02 Serranidae 6.51 0.54 1.08
Gymnocranius griseus 19.55 1.63 3.25
Gymnura sp. 1.70 0.14 0.28
Lactarius lactarius 0.20 0.02 0.03
Lutjanus malabaricus 10.34 0.86 1.72
Lutjanus lineolatus 0.90 0.08 0.15
Lutjanus lutjanus 1.70 0.14 0.28
Lutjanus sebae 0.70 0.06 0.12
Lutjanus vitta 1.04 0.09 0.17
Pristipomoides multidens 6.70 0.56 1.11
Pristipomoides typus 0.00 0.00 0.00
Pristipomoides spp 0.35 0.03 0.06
Pristipomoides pleurospilus 7.70 0.64 1.28 Lutjanidae 29.43 2.45 4.89
Parupeneus cinnabarinus 0.00 0.00 0.00
Parupeneus pleurospilus 5.23 0.44 0.87
Upeneus bensasi 14.60 1.22 2.43
Upeneus moluccensis 22.62 1.89 3.76 Mullidae 42.45 3.54 7.05 Muraenesox sp 4.10 0.34 0.68
Nemipterus bathybius 25.40 2.12 4.22
N. hexadon 0.60 0.05 0.10
N. isacanthus 0.00 0.00 0.00
N. japonicus 7.50 0.63 1.25
N. marginatus 2.67 0.22 0.44
N. mesoprion 3.87 0.32 0.64
N. nematophorus 0.00 0.00 0.00
N. nemurus 22.62 1.89 3.76
N. oveniides 0.00 0.00 0.00
N. peronii 7.80 0.65 1.30
N. tolu 0.20 0.02 0.03
N. virgatus 1.40 0.12 0.23
Parascolopsis inermis 0.95 0.08 0.16
Pentapodus setosus 3.70 0.31 0.61 Nemipteridae 76.71 6.39 12.74
Platax sp. 2.80 0.23 0.47
Plectorhynchus pictus 18.80 1.57 3.12
Pomadasys hasta 0.26 0.02 0.04
Pomadasys argenteus 0.12 0.01 0.02
Psenopsis anomala 0.00 0.00 0.00
Psettodes erumei 2.70 0.23 0.45
Priacanthus macracanthus 8.65 0.72 1.44
P. tayenus 4.33 0.36 0.72
Priacanthus sp. 0.00 0.00 0.00 Priacanthidae 12.98 1.08 2.16
Rhynchobatus djeddensis 0.00 0.00 0.00
Saurida micropectoralis 0.00 0.00 0.00 Sciaenidae 1.67 0.14 0.28
Scolopsis taeniopterus 6.10 0.51 1.01
Demersal fish 268.32 22.36 44.57 Shells 0.00 0.00 0.00
Trichiurus lepturus 0.00 0.00 0.00
Loligo duvauceli 15.24 1.27 2.53
Loligo chinensis 14.34 1.20 2.38
Loligo sp 34.14 2.85 5.67
Sepioteuthis lessoniana 1.06 0.09 0.18
Sepia spp. 2.94 0.25 0.49
Cephalopods 67.72 5.64 11.25
Metapenaeus ensis 0.10 0.01 0.02
Metapenaeopsis stridulans 0.00 0.00 0.00
Parapenaeopsis sp. 0.00 0.00 0.00
Penaeus japonicus 0.06 0.01 0.01
Solenocera subnuda 0.00 0.00 0.00
Trachypenaeus fulvus 0.05 0.00 0.01
T. haumela 0.87 0.07 0.14
T. myops 1.31 0.11 0.22
Shrimps 2.39 0.20 0.40
Panulirus polyphagus 0.49 0.04 0.08
Thenus orientalis 8.56 0.71 1.42 Crabs 0.75 0.06 0.12 TOTAL (COMMERCIAL) 413.27 34.44 68.65 Trash fish
Aluterus monoceros 0.53 0.04 0.09
Alutera 0.19 0.02 0.03
Anthiidae 0.00 0.00 0.00
Apogon spp. 1.76 0.15 0.29
Argyrops spinifer 0.00 0.00 0.00
Arothron sp. 1.10 0.09 0.18
Bothidae 0.00 0.00 0.00 Callionymidae 0.00 0.00 0.00
Canthigaster sp. 0.00 0.00 0.00
Carangoides equala 0.00 0.00 0.00
Coradion chrysozonus 0.00 0.00 0.00 Crabs 0.00 0.00 0.00
Dactyloptena sp. 0.20 0.02 0.03
Decapterus spp. 1.99 0.17 0.33
Diodon holocanthus 2.14 0.18 0.36
Diodon spp. 0.92 0.08 0.15
Dipterygonotus balteatus 0.12 0.01 0.02
Echeneis naucrates 0.00 0.00 0.00
Eutherapon theraps 0.00 0.00 0.00
Fistularia petimba 1.23 0.10 0.20
Fistularia spp 1.94 0.16 0.32
Heterodontus sp. 0.00 0.00 0.00
Holocentrus sp. 9.50 0.79 1.58
Inimicus sinensis 0.00 0.00 0.00 Labridae 0.20 0.02 0.03
Lagocephalus spp. 3.81 0.32 0.63
Leiognathus spp. 2.32 0.19 0.39
Lepidotrigla sp. 0.28 0.02 0.05
Loligo duvauceli 0.00 0.00 0.00
Lophodiodon 0.38 0.03 0.06
Nemipterus marginatus 0.00 0.00 0.00
Nemipterus nematophorus 0.00 0.00 0.00
Octopus sp. 0.00 0.00 0.00
Ostracion sp 0.19 0.02 0.03
Paramonacanthus spp. 0.00 0.00 0.00
Parascolpsis eriomma 0.00 0.00 0.00
Parapercids 0.28 0.02 0.05
Parupeneus cinnabarinus 0.00 0.00 0.00
Pentaprion longimanus 18.26 1.52 3.03
Platycephalus spp. 0.26 0.02 0.04
Pleuronectes spp. 3.76 0.31 0.62
Priacanthus macracanthus 0.00 0.00 0.00
Priacanthus tayenus 0.00 0.00 0.00
Pristotis jerdoni 14.40 1.20 2.39
Pseudomonocanthus sp 0.03 0.00 0.00
Pterois sp. 0.00 0.00 0.00
Pterocaesio chrysozona 0.00 0.00 0.00
Pterocaesis 1.07 0.09 0.18
Rays 27.05 2.25 4.49 Rhynchostracion 0.90 0.08 0.15
Rhynchostracion nasus 0.15 0.01 0.02 Round sponges 0.00 0.00 0.00
Saurida micropectoralis 0.00 0.00 0.00
Saurida undosquamis 15.12 1.26 2.51
Saurida hoshinonis 0.00 0.00 0.00
Saurida elongata 5.55 0.46 0.92
Saurida spp. 14.60 1.22 2.43
Saurida tumbil 10.60 0.88 1.76
Scolopsis spp. 0.00 0.00 0.00
Sea cucumber 0.00 0.00 0.00
Sepia spp. 0.00 0.00 0.00
Shells 0.00 0.00 0.00
Stolephorus sp. 0.10 0.01 0.02
Scorpaena scabra 0.00 0.00 0.00
Siganus oramin 0.20 0.02 0.03
Sillago 3.00 0.25 0.50
Sillago sihama 5.50 0.46 0.91
Starfish 0.00 0.00 0.00 Synodous hoshinonis 0.19 0.02 0.03
Tetrosomus sp. 1.19 0.10 0.20
Therapon theraps 12.00 1.00 1.99
Torquigener sp. 0.00 0.00 0.00
Triacanthus spp. 0.13 0.01 0.02
Upeneus sulphureus 25.00 2.08 4.15
Upeneus moluccensis 0.00 0.00 0.00
Upeneus spp. 0.60 0.05 0.10
longimanus, Leiognatus spp., Upeneus spp.and Saurida micropectoralis. During the 4th cruise, trash
fish registered an average catch rate of 15.7 kg/hr. Most trash fish were caught at station 31 (53.1 kg/ hr) followed by station 7 (41.1 kg/hr). The trash fish were dominated by Upeneus sulphureus, Pentaprion longimanus and Saurida spp.
Priacanthids, the most dominant among the fish family in the 3rd cruise have an average catch
rate of 7.9 kg/hr. The highest catch rate was at station 44, (100.0 kg/hr) and was recorded only by
Priacanthus macracanthus. Nemipterids attained an average catch rate of 6.1 kg/hr. Nemipterus bathybius recorded the highest average catch rate of 1.9 kg/hr. Nemipterids were most abundant at station 33 with catch rate of 22.2 kg/hr. Carangidae, the third most dominant fish family registered an average catch rate of 2.8 kg/hr. In terms of individual species within the family, Decapterus spp. attained the highest average catch rate (1.0 kg/hr) and the others recorded an average catch rate of less than 1.0 kg/hr. Carangidae was most abundant at station 34 with catch rate of 8.7 kg/hr.
During the 4th cruise, the most dominant family i.e Nemipteridae have an average catch rate of
6.4 kg/hr. The highest catch rate was at station 27 with catch rate of 14.62 kg/hr. Carangidae attained an average catch rate of 4.3 kg/hr and the highest catch rate was recorded at station 7 (15.9 kg/hr). Among the carangids, Atule mate registered the highest catch rate (9.5 kg/hr) at station 6.
Fishery group Total (kg) Average catch (kg/hr) Percentage (%)
3rd cruise 4th cruise 3rd cruise 4th cruise 3rd cruise 4th cruise
Demersal fish 444.72 268.32 26.16 22.36 46.96 44.57
Pelagic fish 74.18 65.04 4.36 5.42 7.79 10.8
Cephalopods 29.32 67.72 1.72 5.64 3.11 11.25
Shrimps 0.49 2.39 0.03 0.2 0.05 0.40
Crab 0.54 0.75 0.04 0.06 0.06 0.12
Shell fish 0.60 0.00 0.04 0.00 0.06 0.00
Trash fish 395.81 188.74 23.28 15.73 41.55 31.35
Others 3.98 9.05 0.24 0.75 0.42 1.51
Total catch 949.63 602.01 55.86 50.16 100.00 100.00
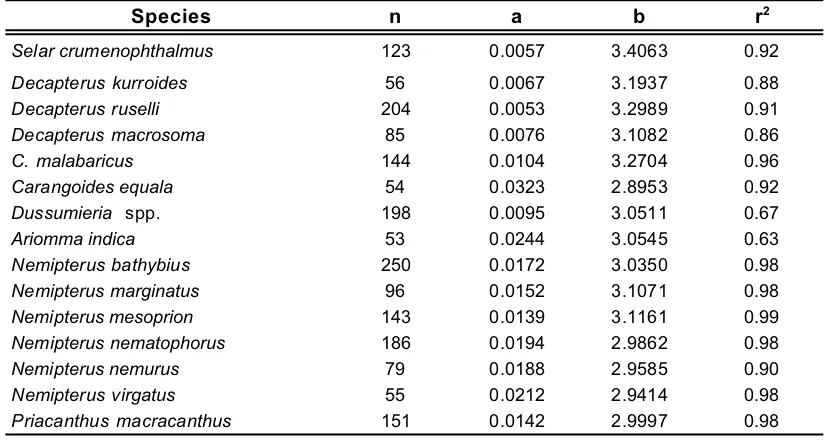
Species n a b r2
Selar crumenophthalmus 123 0.0057 3.4063 0.92
Decapterus kurroides 56 0.0067 3.1937 0.88
Decapterus ruselli 204 0.0053 3.2989 0.91
Decapterus macrosoma 85 0.0076 3.1082 0.86
C. malabaricus 144 0.0104 3.2704 0.96
Carangoides equala 54 0.0323 2.8953 0.92
Dussumieria spp. 198 0.0095 3.0511 0.67
Ariomma indica 53 0.0244 3.0545 0.63
Nemipterus bathybius 250 0.0172 3.0350 0.98
Nemipterus marginatus 96 0.0152 3.1071 0.98
Nemipterus mesoprion 143 0.0139 3.1161 0.99
Nemipterus nematophorus 186 0.0194 2.9862 0.98
Nemipterus nemurus 79 0.0188 2.9585 0.90
Nemipterus virgatus 55 0.0212 2.9414 0.98
Priacanthus macracanthus 151 0.0142 2.9997 0.98
The b values obtained ranged from 2.89 to 3.40.
Table 3 Summary of the catch composition of the major fish group
SAR
AW
Fig. 3 Catch rate of commercial fish of individual station during 3rd cruise (9th - 3rd August 1996)
Length-Weight Relationship
The length-weight relationship of the selected species are as shown in Table 4 below:
Discussions
The overall average catch rate from individual stations during 3rd cruise (55.9 kg/hr) and 4th
cruise (50.2 kg/hr) is very low compared to 318 kg/hr and 210 kg/hr obtained from previous surveys within the same areas in 1972 (Mohammed Shaari et al, 1976a) and 1973 (Mohammed Shaari et al, 1976b) respectively. However, in the present survey, the number of hauls is very small in number (i.e. 17 and 12 hauls for 3rd and 4th cruise respectively) as compared to 118 hauls during the previous
survey (Mohammed Shaari et al, 1976b).
The other factor that might contributed to the low overall average catch rate of commercial fish after 17 and 12 hours trawling respectively is the openning of the trawl net. It could be that the net mouth did not open properly.
For an ideal fish which maintains the same shape, b=3, and this has occasionally been observed (Allen, 1938). In the present study, it seemed that the cube law is being obeyed as most of the b values lies close to 3. In general, the fish are also normally distributed. This was based on the findings by Carlender (1969) that fish with b values equal to 3 are more representative of the population. It was found that the b values for nemipterids varies excepts for 3 species (N. nematophorus, N. nemurus and N. virgatus). This suggests that the nemipterids have different growth rate. The lower values of b
can be considered to be the result of biological features of the species.
Acknowledgements
This work was funded by IRPA, Research and Development fund of the Department of Fisher-ies Malaysia within the framework of national contributions for the collaborative research work be-tween MRFDMD-SEAFDEC and TD-SEAFDEC. We wish to thank the Chief of MFRDMD-SEAFDEC, Mr. Ismail Taufid Bin Md. Yusoff and the former Chief of Fisheries Research Institute, Sarawak Branch, Mr. Albert Chuan Gambang for their support in carrying out this study. We would also like to thank officers and staffs of FRI, Sarawak, MFRDMD-SEAFDEC, Kuala Terengganu, FRI, Penang and FRC, Sabah for their assistance in the data collection.
References
Allen, K.R. (1938). Some observations on the biology of the trout (Salma trutta) in Windermert. J. Anim. Ecol. 7:333-49.
Anon. 1995. Annual Fisheries Statistics. Marine Fisheries Department of Sarawak. Ministry of Agri-culture Malaysia.
Carlender, K. 1969. Handbook of freshwater fishery biology. Vol. 1. Iowa State University press, Annos.
Mohammed Shaari bin Sam Abdul Latiff, W. Weber, Lee Aik Kean, Lam Wah Chang. 1976a. Dem-ersal Fish Resources in Malaysian Waters - 6. Trawl survey off the coasts of Sarawak, Brunei and the west coast of Sabah. (29th March 1972-1st May 1972). Fisheries Bulletin No. 8.
Minis-try of Agriculture and Rural Development, Malaysia: 1-64.
Mohammed Shaari bin Sam Abdul Latiff, W. Weber, Lee Aik Kean. 1976b. Demersal Fish Resources in Malaysian Waters - 9. Second trawl survey off the coasts of Sarawak. (17th August 1973-18th
September 1973). Fisheries Bulletin No. 11. Ministry of Agriculture Malaysia: 1-28.