80
BAB V
PENUTUP
5.1 Kesimpulan
Berdasarkan hasil analisis data yang dilakukan dengan
Structural Equation
Model pada bab sebelumnya, maka diperoleh kesimpulannya :
1.
Kepuasan berpengaruh signifikan terhadap komitmen. Berarti hipotesis
satu (H1) yang menyatakan bahwa kepuasan berpengaruh signifikan
terhadap komitmen diterima dan mendapat dukungan.
2.
Komitmen berpengaruh signifikan terhadap loyalitas. Berarti hipotesis dua
(H2) yang menyatakan bahwa komitmen berpengaruh signifikan terhadap
loyalitas diterima dan mendapat dukungan.
3.
Kepuasan berpengaruh tidak signifikan terhadap loyalitas. Berarti
hipotesis tiga (H3) yang menyatakan bahwa kepuasan berpengaruh
signifikan terhadap loyalitas ditolak dan tidak mendapat dukungan.
81
5.2 Keterbatasan
Penelitian
Keterbatasan pada penelitian ini terletak pada hasil akhir yang didapatkan
penelitian ini menjadi tidak sama dengan penelitian terdahulu oleh (Wu, 2011),
terutama pada variabel kepuasan terhadap loyalitas. Hal ini disebabkan,
peneliti kurang menambah model didalam SEM sehingga jika ada indikator
yang dihapus akan menjadi kurang kebenarannya.
Penelitian ini hanya pada objek perbankan yaitu Bank BCA KCP Ngoro di
Mojokerto sehingga tidak menutup kemungkinan hasilnya akan berbeda jika
dilakukan penelitian dengan subjek berbeda.
5.3 Saran
Berdasarkan penelitian yang telah dilakukan baik peneliti terdahulu
ataupun penelitian saat ini, maka peneliti memberikan saran yang mungkin dapat
digunakan sebagai bahan pertimbangan :
Adapun saran – saran yang diberikan peneliti selanjutnya antara lain :
5.3.1 Saran bagi Bank BCA KCP Ngoro di Mojokerto
Berdasarkan hasil analisis penelitian yang telah disimpulkan, maka peneliti dapat
memberikan saran – saran yang sekiranya dapat bermanfaat bagi pihak – pihak
terkait :
1.
Bagi Bank BCA KCP Ngoro Mojokerto
82
menjadi nyata bagi seorang nasabah, dengan pemenuhan
kepuasan nasabah tersebut akan tercipta suatu loyalitas karena
nasabah beranggapan apa yang dia harapkan sebanding dengan
apa yang dia dapatkan. Untuk itulah, Bank BCA disarankan untuk
memperhatikan pelayanan yang dilakukan baik secara langsung
maupun tidak langsung.
b.
Komitmen nasabah tercipta karena adanya kepuasan yang
berulang – ulang. Untuk itulah Bank BCA harus mampu
menciptakan komitmen terhadap nasabah dengan memberikan
value
.
Value
yang bisa diberikan oleh BCA antara lain :
1.
Menambah fasilitas seperti tempat duduk, sehingga nasabah
bisa mengantri tanpa harus berdiri saat menunggu antrian
untuk melakukan transaksi.
2.
Menyediakan ruangan khusus untuk nasabah yang
diprioritaskan agar nasabah tersebut merasa lebih dekat atau
memiliki hubugan personal dengan Bank BCA.
83
4.
Agar nasabah merasa lebih berkesan dan memiliki pengalaman
istimewa dengan Bank BCA maka Bank BCA disarankan
menambah hadiah.
5.
Meningkatkan kualitas layanan serta produk-produk yang
ditawarkan pada nasabah sehingga apa yang diharapkan
nasabah bias dirasakan.
84
5.3.2 Saran bagi peneliti yang akan datang
Peneliti selanjutnya diharapkan dapat mengkaji ulang penelitian saat ini dan
peneliti sebelumnya dengan menggunakan variabel-variabel lainnya yang
berpengaruh terhadap loyalitas sehingga diharapkan penelitian selanjutnya akan
lebih baik. Serta diharapkan penelitian selanjutnya mendapatkan hasil yang lebih
sesuai dengan teori, menambah model jika memilih menggunakan SEM untuk
menjaga apabila ada proses
deleting
pada indikator yang diuji.
Daftar Pustaka
Aaker,
D.A.
1991.
Strategic Market Management.
2nd ed. New York:
John Willey & Sons, Inc.
Augusty
Ferdinand.
2002.
Structural Equation Modeling
Dalam Penelitian
Manajemen.
Edisi kedua. BP UNDIP
Barnes, G James. 2003.
Rahasia Manajemen Hubungan Pelanggan.
Andi.
Yogyakarta.
Buttle, Francis. 2004.
Customer Relationship Management Concept and
Tools.
Edisi Pertama. Penerbit : Bayumedia Publishing.
Dimitriades, Zoe S
.
2006.
“Customer Satisfaction, Loyalty and Commitment in
Service Organizations”,
Management Research News.
Vol. 29-No. 12.
2006, pp 782-800.
Fandy
Tjiptono.
2001.
Total Quality Management.
Edisi Kedua. Penerbit :
Andi.
Yogyakarta.
____________.2006.
Pemasaran Jasa
. Jakarta. PT. Bayu Media Publishing.
Farida Jasfar. 2002.
Manajemen Jasa.
Bogor. Ghalia Indonesia.
Freddy Rangkuti. 2002.
Measuring Customer Satisfaction.
Jakarta. PT.
Gramedia
Pustaka
Utama.
http://bisnisbloggerku.blogspot.com, diakses 14 Oktober 2011.
http://www.indorating.com, diakses 12 September 2011.
http://www.kabarbisnis.com, diakses 14 Oktober 2011.
Imam Ghozali. 2008.
Model Persamaan Struktural Konsep dan Aplikasi dengan
Program AMOS Ver 16.0
. Semarang : BP. UNDIP.
Kotler,
Philip.
2005.
Manajemen Pemasaran.
Edisi Kesebelas. Penerbit :
PT Indeks Kelompok Gramedia.
___________. 2004.
Dasar-Dasar Pemasaran
. Edisi Kesembilan jilid 1.
PT.Indeks Gramedia. Jakarta.
Kotler, Philip, dan G. Armstrong. 2008.
The Principle Of Marketing.
Edisi
Keduabelas. New Jersey. Pearson Education, Inc.
Kotler, Philip, dan Keller, Kevin Lane. 2009.
Manajemen Pemasaran.
Edisi
Ketigabelas jilid 1. Penerbit : Erlangga.
Lovelock, Christopher, dan J.Wirtz. 2004.
Managing Service : Marketing,
Operations and Human Resources.
Upper Saddle River.
New Jersey. Pearson Education, Inc.
Malhotra, K Naresh. 2009.
Riset Pemasaran.
Edisi keempat Jilid 1. PT Indeks.
Nina Rahmayanty. 2010.
Manajemen Pelayanan Prima.
Edisi Pertama.
Penerbit : Graha Ilmu. Yogyakarta.
Sekaran, Uma. 2007.
Metodologi Penelitian untuk Bisnis.
Edisi keempat
Jilid 1. Salemba empat. Jakarta.
Tatang Kusmayadi.
Pengaruh Relationship Quality terhadap Loyalitas
Nasabah Tabungan.
Tatik Suryani, 2008, Edisi Pertama,
Perilaku Konsumen.
Graha Ilmu.
Wu, Li-Wei. 2011. “Beyond Satisfaction The Relative Importance of Locational
Convenience, Interpersonal Relationships, and Commitment Across
Service Types”,
Managing Service Quality.
Vol. 21-No. 3. 2011, pp
240-263.
STIE Perbanas Surabaya
SURVEY LOYALITAS NASABAH
BANK BCA UNIT NGORO CABANG MOJOKERTO 2011
Pengantar
Dalam rangka meningkatkan loyalitas nasabah pada jasa layanan perbankan di Mojokerto, maka
STIE Perbanas mengadakan penelitian pada nasabah bank BCA KCP Ngoro Mojokerto. Untuk
itu kami memohon bantuan dan kesediaan saudara untuk berpartisipasi dalam pengisian
kuisioner ini. Penelitian ini akan sangat berguna bagi STIE Perbanas Surabaya khususnya dalam
rangka memberikan masukan kepada dunia perbankan di Indonesia, sehingga tentunya hasil
penelitian ini akan bisa menjadi masukan bagi perbaikan layanan perbankan. Kami
sepenuhnya
akan menjamin kerahasiaan identitas saudara.
Kami akan sangat menghargai pendapat saudara
dan atas bantuan saudara kami ucapkan terima kasih.
PETUNJUK PENGISIAN
•
Jangan sampai ada pertanyaan yang terlewatkan.
•
Lingkarilah satu jawaban yang Anda anggap paling tepat sebagaimana contoh berikut ini.
KP
1
Saya puas dengan fasilitas bank BCA.
Sangat tidak setuju sekali 1 2 3 4 5 6 7 Sangat setuju sekali
KP
2
Bank BCA memenuhi harapan saya.
Sangat tidak setuju sekali 1 2 3 4 5 6 7 Sangat setuju sekali
KP
3
Saya memiliki pengalaman istimewa
dengan bank BCA.
Sangat tidak setuju sekali 1 2 3 4 5 6 7 Sangat setuju sekali
KP
4
Bank BCA tidak pernah mengecewakan
saya sejauh ini.
Sangat tidak setuju sekali 1 2 3 4 5 6 7 Sangat setuju sekali
KM
1
Saya merasa ada keterikatan emosional
terhadap bank BCA.
Sangat tidak setuju sekali 1 2 3 4 5 6 7 Sangat setuju sekali
KM
2
Bank BCA memberi kesan pribadi
kepada saya.
Sangat tidak setuju sekali 1 2 3 4 5 6 7 Sangat setuju sekali
KM
3
Saya merasakan rasa yang kuat dalam
mengidentifikasikan atau mengenali
bank BCA.
Sangat tidak setuju sekali 1 2 3 4 5 6 7 Sangat setuju sekali
KM
4
Tingkat keterikatan emosi saya terhadap
bank BCA tinggi.
Sangat tidak setuju sekali 1 2 3 4 5 6 7 Sangat setuju sekali KP8 Harapan saya terhadap layanan jasa bank
BCA.
KM
5
Hubungan saya dengan bank BCA
sangat penting.
Sangat tidak setuju sekali 1 2 3 4 5 6 7 Sangat setuju sekali
KM
6
Keterikatan saya dengan bank BCA
bersifat sangat personal.
Sangat tidak setuju sekali 1 2 3 4 5 6 7 Sangat setuju sekali
L1
Saya pasti akan merekomendasikan
Bank BCA kepada seseorang yang
meminta pendapat saya.
Sangat tidak setuju sekali 1 2 3 4 5 6 7 Sangat setuju sekali
L2
Saya mendorong kerabat dan
teman-teman untuk melakukan bisnis dengan
bank BCA.
Sangat tidak setuju sekali 1 2 3 4 5 6 7 Sangat setuju sekali
L3
Saya berniat untuk menjalin kerjasama
yang lebih dengan Bank BCA dalam
beberapa tahun kedepan.
Sangat tidak setuju sekali 1 2 3 4 5 6 7 Sangat setuju sekali
L4
Saya mengatakan hal-hal positif tentang
Bank BCA kepada orang lain.
Sangat tidak setuju sekali 1 2 3 4 5 6 7 Sangat setuju sekaliL5
Saya memilih Bank BCA sebagai pilihan
pertama saya untuk menggunakan
layanan yang saya butuhkan.
Sangat tidak setuju sekali 1 2 3 4 5 6 7 Sangat setuju sekali
L6
Saya akan terus melakukan bisnis
dengan Bank BCA bahkan jika harga
akan meningkat.
Sangat tidak setuju sekali 1 2 3 4 5 6 7 Sangat setuju sekali
L7
Saya akan membayar dengan harga yang
lebih tinggi dari harga pesaing lainnya
untuk keuntungan yang saya terima saat
ini.
Sangat tidak setuju sekali 1 2 3 4 5 6 7 Sangat setuju sekali
A.
DATA RESPONDEN. No : ……....
a.
Nama
: ...(Boleh diisi atau Tidak)
b.
No. Telepon
: ...
c.
Usia
: a. 17 -
≤
25 Tahun b . >25 -
≤
38 tahun
c. >38 -
≤
45 tahun d. >45 tahun
d.
Pendidikan Terakhir
: a. SMA/ sederajat
b. Diploma
f. Pekerjaan
: a. Pegawai Negeri b. Pegawai Swasta
c. Pelajar/Mahasiswa d. Lainnya,...
h. Domisili
: a. Mojokerto
b. Sidoarjo
c. Surabaya
d. Lainnya,……….
i. Lama Menjadi Nasabah
: a. 3bulan -
≤
1tahun
b. > 1 tahun -
≤
3 tahun
c. > 3 tahun -
≤
5 tahun
d. > 5tahun
j. Nasabah Bank BCA
: a. Bank BCA KCP Ngoro b. Bank BCA KCP
Mojosari
c.
Bank
BCA
KCU
d.
Lainnya………….
Mojokerto
MRN
#Emerald Group Publishing Limited 0140-9174
University of Macedonia, Thessaloniki, Greece
Abstract
Purpose– The present study attempts to contribute to the knowledge of how customer satisfaction, loyalty and commitment are defined and relate to each other in the Greek context.
Design/methodology/approach– It is based on 200 responses collected from 20 service providers in four service settings: financial services, retailing, entertainment and transportation services.
Findings– Both factor- and reliability analyses provided satisfactory results. Surprisingly, company satisfaction was not interpreted as a conceptually distinct construct from customer loyalty; a conceptual overlap also emerged between attitudinal loyalty and loyal behavioral actions such as word of mouth; whereas customer commitment was highly positively associated with loyalty (and satisfaction), according to expectations. Hierarchical regression analysis was used to investigate potential moderating effects of gender and service setting on the satisfaction-commitment and commitment-loyalty relationships. Although significant differences were identified, both gender and service setting did not moderate the relationship between satisfaction and commitment and between commitment and loyalty in the sample studied.
Research limitations/implications – It may be relevant for future research to replicate the present study utilizing transaction-specific and/or facet satisfaction measures instead of the overall, cumulative satisfaction construct employed in the present investigation. Moreover, incorporating measures of purchase loyalty and instrumental commitment as well as financial performance indices and use of longitudinal approaches in different sub-sectors may also lead to an enhanced understanding of the dynamic nature of the variables analyzed.
Originality/value – While the relationship between customer loyalty and satisfaction as well as between commitment and customer loyalty are well understood in the literature, the inter-relationships among these constructs are not so well illustrated. The discriminant validity of satisfaction and loyalty needs to be further investigated – highlighting potential effects of culture, method and measure variance. To the knowledge of the researcher no prior study has attempted to address these issues in the Greek context, unfamiliar to many readers.
Keywords Customer satisfaction, Customer loyalty, Customer retention, Gender, Service industries, Greece
Paper type Research paper
Introduction
In the contemporary global and highly competitive economy it is fatal for a business organization to be non-customer-oriented. Indeed, to survive organizations need to produce products and services of very good quality that yield highly satisfied and loyal customers (Fecikova, 2004). For many years customer satisfaction has been a major goal of business organizations, since it has been deemed to affect customer retention and companies’ market share (Hansemark and Albinsson, 2004). Traditionally, satisfied
The current issue and full text archive of this journal is available at
www.emeraldinsight.com/0140-9174.htm
Service
organizations
in Greece
783
customers have been thought of as less price sensitive, less influenced by competitors, buying additional products and/or services and staying loyal longer (Zineldin, 2000). Yet, in 1991 the Xerox Corporation made a surprising – and disquieting – discovery. It was found that ‘‘satisfied’’ customers were not behaving the way they were expected: they were not coming back to Xerox to repurchase (McCarthy, 1997, p. 13). ‘‘Merely satisfying customers, who have the freedom to make choices, is not enough to make them loyal,’’ Jones and Sasser (1995) observed in their own analysis of the Xerox study. ‘‘The only truly loyal customers are totally satisfied customers’’. Hence, the Xerox study shed new light on what had previously been relatively unexplored territory: the link between customer satisfaction and customer loyalty.
Loyalty of customers is considered to be a function of satisfaction (Fecikova, 2004, p. 57) and loyal customers contribute to company profitability by spending more on company products and services, via repeat purchasing, and by recommending the organization to other consumers (Bowen and Chen, 2001; Fecikova, 2004). To further understand the behavior of loyal customers, recent research has attempted to integrate the concept of customer commitment (Fullerton, 2005; Zins, 2001). For the most part, these recent studies have been built upon customer commitment as a key mediator of the relationship between the customer’s evaluations of a firm’s performance and the customer’s intentions regarding the future relationship with the firm (Fullerton, 2005). The present paper explores the nature of interrelationships among customer satisfaction, loyalty and commitment in Greek service organizations. First a brief synthesis of the extant literature on key conceptual and operational issues is offered, followed by an outline of the research questions under study and the method used for the collection of the primary data. Then findings are presented and discussed, while the concluding section addresses the study limitations, implications and recommendations for further research.
The growth of the service sector
By the mid-1990s services accounted for almost two-thirds of world GDP, up from about half in the 1980s (www.worldbank.org/depweb/beyond/wren/wnrbw_09.pdf). Indeed, the value of global trade in services in 1995 was estimated at $1.2 trillion constituting about 25 per cent of global merchandise trade (Samiee, 1999). In the USA, the service sector accounts for approximately 80 per cent of GDP and private non-farm employment (Clark and Rajaratham, 1999). The services sector also is the most important sector in the European Union, making up 70 per cent of GDP compared to the manufacturing industry with 28 per cent of GDP and agriculture with only 2 per cent of GDP. Greece, with a population of 11 million, is a member of the European Union since 1981. Greece enjoys a relatively high standard of living, ranking 24th on the 2005 Human Development Index (http://en.wikipedia.org/wiki/Human_Development_Index) and 22nd on The Economist’s 2005 world-wide quality-of-life index (www.elke.gr/ default.asp?V_DOC_ID=765). Services, make up ‘‘the largest, most vital and fastest-growing sector of the Greek economy’’, accounting for about 71 per cent of GDP in 2002 followed by industry (22 per cent) and agriculture (7 per cent) (www.economist.com/ countries/Greece/). The nation’s main economic activity is primarily based on tourism, shipping, banking and finance and construction while the country serves as the regional business hub for many of the world’s largest multinational companies (http:// en.wikipedia.org/wiki/Greece#Economy).
MRN
29,12
784
of the features that predominantly characterize a service is most commonly employed (Redman and Mathews, 1998); namely: intangibility, inseparability, heterogeneity and perishability (see Edgett and Parkinson, 1993 for a summary of research and review of developments in the area). The most obvious characteristic of services is that they are intangible – they cannot be seen or touched. This intangibility poses great problems to service organizations in communicating to the consumer exactly what is on offer, resulting in the consumer’s inability to really evaluate a service until it has been consumed (Redman and Mathews, 1998, p. 59). A second idiosyncrasy of services is that, frequently, the service consumer cannot be separated from the service producer. Thus getting close to the customer is an unavoidable feature of service encounters. Thirdly, services are different each time they are performed. Lastly, if a service is not consumed it disappears. This is an economic cost that cannot be recovered and is critical to the very survival of the organization (Redman and Mathews, 1998).
Hence, understanding, anticipating and meeting consumer needs and wants is a critical strategic issue for service organizations. Customer satisfaction and loyalty – secured through high-quality products and services providing value for money for the consumer – are seen as essential for long-term survival, let alone long-term success (Donnellyet al., 1995; Nichollset al., 1998).
Despite the fact that satisfaction and loyalty have been extensively researched in the international services literature (Bennett and Rundle-Thiele, 2004; Szymanski and Henard, 2001), there are still unresolved issues concerning the conceptualization, operationalization and the true nature of the relationship between the two constructs (Bennett and Rundle-Thiele, 2004). For instance, ‘‘although the discriminant validity of satisfaction and loyalty (that is, satisfaction and loyalty are not the same and items measure different constructs) is assumed in most services research, there is very little empirical evidence to support this assumption’’ (Bennett and Rundle-Thiele, 2004, p. 515). Specifically, Bennett and Rundle-Thiele (2004) note that out of 15 empirical studies on customer loyalty and satisfaction only five report ‘‘validity and reliability checks’’. Moreover, ‘‘the relationship between satisfaction and loyalty in many instances is moderated by other factors. That is the strength of the relationship can be lower or higher given the influence of other variables’’ (Bennett and Rundle-Thiele, 2004, p. 517) Specifically, the relationship between satisfaction and loyalty has been found to be moderated by commitment ( Johnson et al., 2001) and by personal characteristics such as demographics (Heskett et al., 1997). In addition, a recent customer satisfaction meta-analysis conducted by Szymanski and Henard (2001) indicates that the magnitude of the relationship between satisfaction and loyalty varies according to the measurement and method factors that characterize the research. The following conceptual background provides a rationale for the research design and data analysis techniques employed in the present investigation.
Conceptual foundations
Customer satisfaction
Service
organizations
in Greece
785
with goods may derive from, and may be influenced by, different factors and therefore should be treated as separate and distinct (Veloutsouet al., 2005).
Two additional issues that need to be clarified when researching customer satisfaction in services is whether satisfaction is conceptualized as facet (attribute-specific) or as overall (aggregate); and whether it is viewed as transaction-specific (encounter satisfaction) or as cumulative (satisfaction over time) (Hoest and Knie-Andersen, 2004). In the present paper, satisfaction is conceptualized as an overall, customer attitude towards a service provider (Levesque and McDougall, 1996).
Customer loyalty
Three conceptual perspectives have been suggested to define customer loyalty: the behavioral perspective, the attitudinal perspective and the composite perspective (Bowen and Chen, 2001; Zins, 2001). The behavioral perspective, ‘‘purchase loyalty’’, strictly looks at repeat purchase behavior and is based on the customer’s purchase history. Here, the emphasis is on past -rather than on- future actions. Moreover, no other loyal behavioral actions such as price tolerance, word of mouth, or complaint behavior can be interpreted (Zins, 2001). Concentrating on the behavioral aspect of loyalty could overestimate true loyalty (Zins, 2001). The attitudinal perspective, in contrast, allows gain in supplemental understanding of loyal behavior (Zins, 2001). Here, customer loyalty is approached as an attitudinal construct. Attitude denotes the degree to which a consumer’s disposition towards a service is favorably inclined. This inclintion is reflected by activities such as the customers recommending service providers to other consumers or their commitment to repatronize a preferred service provider (Gremler and Brown, 1996). Based on a favorable attitude towards a service provider, customers may develop ‘‘preference loyalty’’ (De Ruyteret al., 1998). Lastly, the composite perspective combines attitudinal and behavioral definitions of loyalty. The composite perspective might be considered as an alternative to affective loyalty since using both attitude and behavior in a loyalty definition arguably increases the predictive power of loyalty (Pritchard and Howard, 1997). In the present study ‘‘loyal’’ are defined those customers who hold favorable attitudes toward an organization, recommend the organization to other consumers and exhibit repurchase behavior.
Customer commitment
Recent research on customer loyalty reflects attempts to integrate the concept of attitudinal commitment in an effort to distinguish between true and spurious loyalty (Bloemer and Kasper, 1995; Fullerton, 2005). There are two types of customer commitment conceptualizations: affective and calculative or continuance commitment, having different antecedents, contents and consequences (Zins, 2001). Calculative commitment is the way that the customer is forced to remain loyal against his/her desire (De Ruyteret al., 1998). In calculative commitment customers can be committed to a selling organization because they feel that ending the relationship involves an economic or social sacrifice (Fullerton, 2005). Affective commitment reflects a consumer’s sense of belonging and involvement with a service provider akin to emotional bonding (Rhoadeset al., 2001; Fullerton, 2003).
The definition of customer commitment in the present investigation is based on its affective aspect, in view of its larger effect on loyalty compared to satisfaction ( Johnson
MRN
29,12
786
The present study
Research aims and hypotheses
The first objective of the study is to test the distinctiveness of customer satisfaction and loyalty, since the literature provides little empirical evidence to their discriminant validity (Bennett and Rundle-Thiele, 2004). Since the conceptualization and operationalization of the constructs were developed in culturally diverse contexts (Germany, USA), a possibility was considered that these may not show validity with the current sample (Ueltschy and Krampf, 2001). Hence, a second objective of this study is to explore the psychometric properties of the scales with Greek data. Lastly, a third research objective is to examine the potential moderating effects of gender and service setting on the inter-relationships among satisfaction, loyalty and commitment.
These objectives led to the formulation of the following research hypotheses, grounded on previous findings (Bennett and Rundle-Thiele, 2004; Johnsonet al., 2001; Ndubisi, 2006; Ndubisi and Wah, 2005; Taylor, 1997):
H1. Satisfaction and loyalty are distinct constructs.
H2. A direct positive association is expected to be found between satisfaction and loyalty.
H3. Satisfaction is predicted to have a direct positive effect on commitment.
H4. Customer commitment is assumed to be directly related to loyalty.
H5. Gender is a significant discriminator of customer satisfaction.
H6. Gender is a significant discriminator of customer loyalty.
H7. Gender is a significant discriminator of customer commitment.
H8. Customer satisfaction is a function of the service setting.
H9. Customer loyalty is a function of the service setting.
H10. Customer commitment is a function of the service setting.
H11. Satisfaction is hypothesized also to exert an indirect effect on customer loyalty, via commitment.
H12. Gender significantly moderates the satisfaction-commitment relationship.
H13. Gender significantly moderates the commitment-loyalty relationship.
H14. Service setting is a moderator of the relationship between satisfaction and commitment.
H15. Service setting is a moderator of the relationship between commitment and loyalty.
Research method
Research setting and subjects
The hypotheses were tested using a closed-ended survey in four service settings: retailing, entertainment, banking and transportation services. These service settings were selected in part due to relative ease in data collection, their emerging dominating role (Alexander and Myers, 2000; Molitor, 2000), the fairly limited attention retailing – and leisure services have received in the literature ( Jones and Hillier, 2002) and because they differ in terms of their service attributes including degree of tangibility and the degree to which credence is a core feature of the service.
Service
organizations
in Greece
787
is Greece’s second major economic, industrial, commercial and cultural centre as well as a transportation hub in southeastern Europe. Hence, the city appeared well suited as a site for assessing the research questions under investigation.
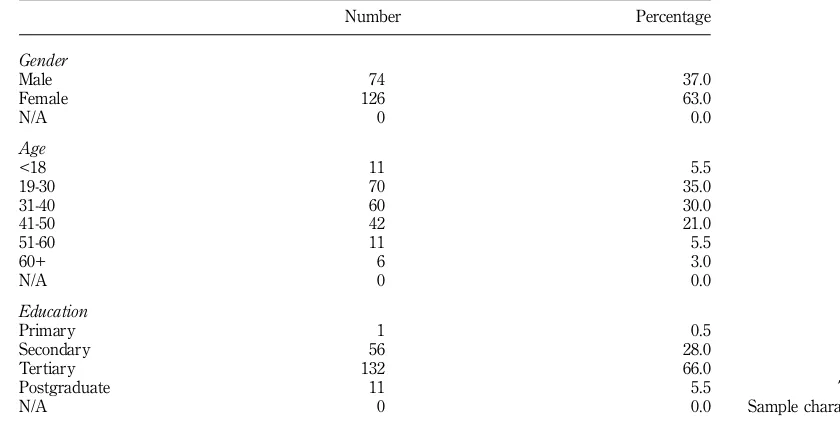
Data were collected during the Spring of 2006 via structured interviews. 270 consumers were initially randomly approached and invited to participate in the study. Participation was voluntary. The majority (74 per cent) agreed to contribute to the research. Of the sample, 63 per cent were females holding a university degree. Respondents’ age ranged from under 19 to over 60, with approximately 70 per cent of the sample representing the age group 20-40. 30 per cent were students, 45 per cent were salaried employees, 13 per cent were free-lancers, 5 per cent were pensioners and 7 per cent had other occupational status (see Table I).
Measures
The four-item customer satisfaction measure was adopted from the work of Hennig-Thurau (2004). Respondents were asked to indicate the degree of their agreement or disagreement with each item, using a seven-point Likert-type scale (7 = totally agree, 1 = totally disagree). Customer loyalty was operationalized on the basis of seven items adopted from a scale developed by De Ruyter et al. (1998). Each of the items was accompanied by a seven-point response format, ranging from 7 = totally agree to 1 = totally disagree. Customer commitment was tapped by seven items adopted from Fullerton (2005), Mattila (2004) and Hennig-Thurau (2004), using a Likert-type scale (7¼totally agree, 1¼totally disagree). All items were translated via a procedure of double-back translation (see Appendix for a description of the data collection instrument). No problems emerged during pre-testing, conducted via ten interviews with local consumers. Questionnaire items were comprehensive, and no complaints in terms of content and time constraints were expressed.
MRN
29,12
788
Data analysis
The discriminant validity of satisfaction and loyalty was tested via confirmatory factor analysis (CFA). CFA is commonly used to confirm that the indicators sort themselves into factors corresponding to how the researcher has linked the indicators to the latent variables (Schumacker and Lomax, 2004). Goodness-of-fit indexes (GFIs) determine if the model being tested should be accepted or rejected. Model chi-square, also called discrepancy or the discrepancy function, is the most common fit test. The chi-square value should not be significant if there is a good model fit, while a significant chi-square indicates lack of satisfactory model fit. Other commonly reported fit indexes are the GFI, the adjusted goodness-of-fit index (AGFI), the comparative fit index (CFI), the normed fit index (NFI), the non-normed fit index (NNFI or TLI) and the root mean square error of approximation (RMSEA). Although there are rules of thumb for acceptance of model fit, these cut-offs are arbitrary. By convention, most GFIs should be equal to or greater than 0.90 to accept the model being tested; whereas RMSEA should be less than or equal or 0.05 if there is a good model fit and less than or equal to 0.08 if there is an adequate fit (Schumacker and Lomax, 2004).
Results
Pre-analysis testing
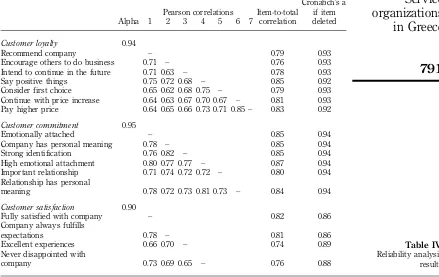
The suitability of the data set for the performance of factor analysis was tested via estimation of the Kaiser-Meyer-Olkin (KMO) measure of sampling adequacy. KMO was 0.94 (chi-square¼3555.55, df¼153, sign¼0.001), characterized as ‘‘marvellous’’ by Kaiser (1974). It indicates that the data set can be used for the analysis and that the items will form specific factors (Hutcheson and Sofroniou, 1999). Internal consistency was tested with Cronbach’s alpha with an anticipated acceptable level of at least 0.70 (Hinkin, 1995).
Factor analysis results
Service
organizations
in Greece
789
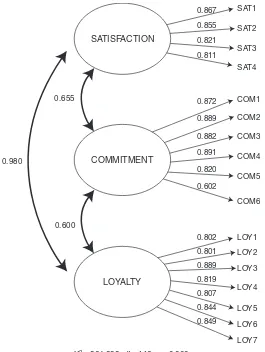
them distinct constructs. On the basis of these findings, in order to avoid multicollinearity problems, it was decided to perform separate analyses to investigate the potential moderating effects of gender and service setting on the satisfaction-commitment and satisfaction-commitment-loyalty relationships.
Scale construction and subsequent analysis
MRN
29,12
790
Satisfaction, commitment and loyalty as a function of gender and service setting
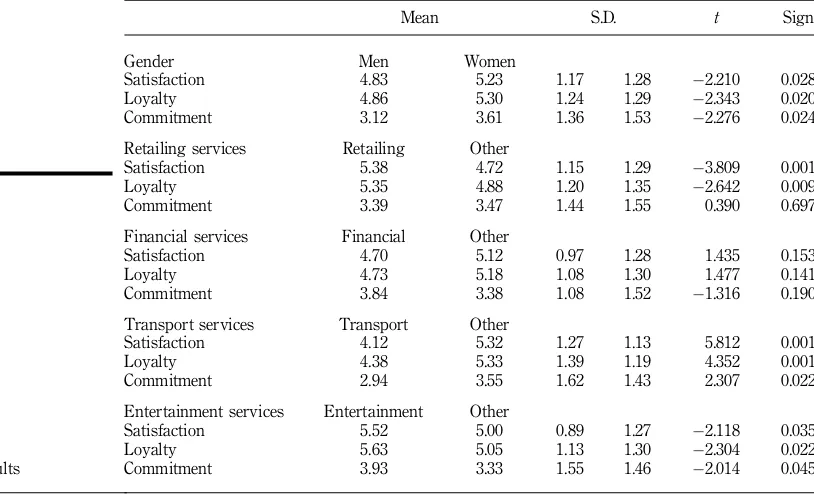
A series of t-tests were run to examine whether gender and age are significant discriminators of satisfaction, loyalty and commitment. As may be noted from Table V, women are significantly more satisfied, committed and loyal than men. Moreover, while consumers of transportation services reported significantly lower levels of satisfaction, loyalty and commitment the opposite was reported by consumers of entertainment services. In retailing, satisfaction and loyalty were significantly higher compared to the other service settings, however, commitment was lower, although not statistically significant. Lastly despite the fact the no statistically significant differences were identified in financial services, it is interesting to note that while lower levels of satisfaction and loyalty are reported commitment is higher – potentially indicating instrumental rather than affective commitment to the service provider. Table II.
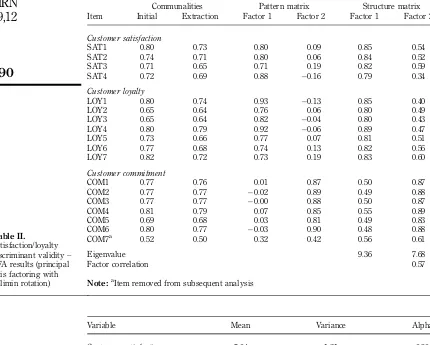
Communalities Pattern matrix Structure matrix Item Initial Extraction Factor 1 Factor 2 Factor 1 Factor 2
Customer satisfaction
SAT1 0.80 0.73 0.80 0.09 0.85 0.54 SAT2 0.74 0.71 0.80 0.06 0.84 0.52 SAT3 0.71 0.65 0.71 0.19 0.82 0.59 SAT4 0.72 0.69 0.88 0.16 0.79 0.34
Customer loyalty
LOY1 0.80 0.74 0.93 0.13 0.85 0.40 LOY2 0.65 0.64 0.76 0.06 0.80 0.49 LOY3 0.65 0.64 0.82 0.04 0.80 0.43 LOY4 0.80 0.79 0.92 0.06 0.89 0.47 LOY5 0.73 0.66 0.77 0.07 0.81 0.51 LOY6 0.77 0.68 0.74 0.13 0.82 0.56 LOY7 0.82 0.72 0.73 0.19 0.83 0.60
Customer commitment
COM1 0.77 0.76 0.01 0.87 0.50 0.87 COM2 0.77 0.77 0.02 0.89 0.49 0.88 COM3 0.77 0.77 0.00 0.88 0.50 0.87 COM4 0.81 0.79 0.07 0.85 0.55 0.89 COM5 0.69 0.68 0.03 0.81 0.49 0.83 COM6 0.80 0.77 0.03 0.90 0.48 0.88 COM7a 0.52 0.50 0.32 0.42 0.56 0.61
Eigenvalue 9.36 7.68
Factor correlation 0.57
Note:aItem removed from subsequent analysis
Table III.
Descriptives
Variable Mean Variance Alpha
Service
organizations
in Greece
791
Hierarchical multivariate regression analysis
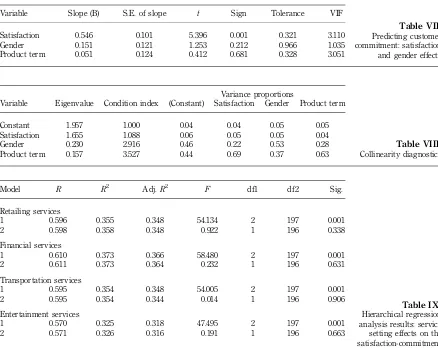
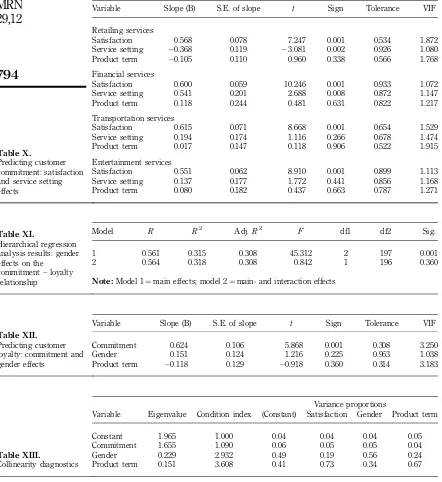
Next, hierarchical multivariate regression analysis (HMRA) was employed to test the moderating effects of gender and service setting on the relationships between satisfaction and commitment as well as between commitment and loyalty.
The standard practice of relating two independent variables to a dependent variable in social science research generally takes the form of equation (1):
Y ¼aþb1Xþb2Zþe ð1Þ
Equation (1) suggests that the dependent variable (Y) is a function of the least squares estimate of the intercept (a), the simple additive (or main effects) of the population regression coefficients for independent variableX(b1) and independent variableZ(b2), and the residual term (e).
Y ¼aþb1Xþb2Zþb3XZþe ð2Þ
Equation (2) presents an extension of equation (1) to include a product term in the model in order to account for potential interaction effects between the two independent variables.
According to Taylor (1997), HMRA comprises four basic steps. The first step involves the identification of direct predictors of the constructs of interest. Selection of appropriate indicators must be based not only on their origins in the literature, but also on a consideration of potential skew and kurtosis as well as potential multicollinearity between the direct predictors of the relevant constructs.
Table IV.
Recommend company – 0.79 0.93 Encourage others to do business 0.71 – 0.76 0.93 Intend to continue in the future 0.71 0.63 – 0.78 0.93 Say positive things 0.75 0.72 0.68 – 0.85 0.92 Consider first choice 0.65 0.62 0.68 0.75 – 0.79 0.93 Continue with price increase 0.64 0.63 0.67 0.70 0.67 – 0.81 0.93 Pay higher price 0.64 0.65 0.66 0.73 0.71 0.85 – 0.83 0.92
Customer commitment 0.95
Emotionally attached – 0.85 0.94 Company has personal meaning 0.78 – 0.85 0.94 Strong identification 0.76 0.82 – 0.85 0.94 High emotional attachment 0.80 0.77 0.77 – 0.87 0.94 Important relationship 0.71 0.74 0.72 0.72 – 0.80 0.94 Relationship has personal
meaning 0.78 0.72 0.73 0.81 0.73 – 0.84 0.94
Customer satisfaction 0.90
Fully satisfied with company – 0.82 0.86 Company always fulfills
expectations 0.78 – 0.81 0.86 Excellent experiences 0.66 0.70 – 0.74 0.89 Never disappointed with
MRN
29,12
792
The second step involves mean-centering the first-order independent variables for subsequent analysis (i.e. XandZ). The purpose of mean-centering the independent variables relates primarily to the potential of multi-collinearity between the independent variables. In the third step, the existence of multi-collinearity is assessed, via two commonly used indices: tolerance and variance inflation factor (VIF). Miles and Shevlin (2003) suggest that the commonly accepted standards for using these indicants include tolerance values close to one and VIF scores less than two to denote lack of collinearity problems. VIF values greater than two may indicate the possibility of collinearity. In such a case, inspection of the collinearity diagnostics is advisable. No evidence of a collinearity problem exists when the condition index for each independent variable is lower than 30 and at least two variance proportions are lower than 0.50 (Tabashnick and Fidell, 1996).
The last step involves the interpretation of the final model regression coefficients. Since standardized regression coefficients are difficult to interpret in the analysis of product terms, only the unstandardized regression (b) coefficients should be used in interpreting HMRA results.
Results of the hierarchical regression analysis are illustrated in Tables VI to XV. As may be noted:
(1) tolerance and collinearity values denote lack of serious collinearity problems; (2) no significant moderating effects of gender and service setting were identified; (3) while gender is a discriminator of (satisfaction), loyalty and commitment at the
bivariate level of analysis, its effects are not retained at the multivariate level, whereas; and
(4) the same is partially true for service setting effects. Table V.
t-test results
Mean S.D. t Sign
Gender Men Women
Satisfaction 4.83 5.23 1.17 1.28 2.210 0.028 Loyalty 4.86 5.30 1.24 1.29 2.343 0.020 Commitment 3.12 3.61 1.36 1.53 2.276 0.024 Retailing services Retailing Other
Satisfaction 5.38 4.72 1.15 1.29 3.809 0.001 Loyalty 5.35 4.88 1.20 1.35 2.642 0.009 Commitment 3.39 3.47 1.44 1.55 0.390 0.697 Financial services Financial Other
Satisfaction 4.70 5.12 0.97 1.28 1.435 0.153 Loyalty 4.73 5.18 1.08 1.30 1.477 0.141 Commitment 3.84 3.38 1.08 1.52 1.316 0.190 Transport services Transport Other
Satisfaction 4.12 5.32 1.27 1.13 5.812 0.001 Loyalty 4.38 5.33 1.39 1.19 4.352 0.001 Commitment 2.94 3.55 1.62 1.43 2.307 0.022 Entertainment services Entertainment Other
Service
organizations
in Greece
793
Discussion, implications and recommendations for further research In an industry that is becoming increasingly international, such as services, it is important to develop standardized measures to adequately capture consumer satisfaction, loyalty and commitment in similar intra-services industries (for instance, financial, entertainment, professional, transport services, etc). Through such measurement, companies can learn how they are doing from the point of view of their targeted consumers, identify what it takes to compete, find ways to deliver better
Table VI.
1 0.595 0.354 0.348 54.0533 2 197 0.001 2 0.596 0.355 0.345 0.170 1 196 0.681
Note:Model 1¼main effects; model 2¼main- and interaction effects
Table VII.
Predicting customer commitment: satisfaction and gender effects Variable Slope (B) S.E. of slope t Sign Tolerance VIF
Satisfaction 0.546 0.101 5.396 0.001 0.321 3.110 Gender 0.151 0.121 1.253 0.212 0.966 1.035 Product term 0.051 0.124 0.412 0.681 0.328 3.051
Table VIII.
Collinearity diagnostics Variance proportions
Variable Eigenvalue Condition index (Constant) Satisfaction Gender Product term
Constant 1.957 1.000 0.04 0.04 0.05 0.05 Satisfaction 1.655 1.088 0.06 0.05 0.05 0.04 Gender 0.230 2.916 0.46 0.22 0.53 0.28 Product term 0.157 3.527 0.44 0.69 0.37 0.63
Table IX.
1 0.596 0.355 0.348 54.134 2 197 0.001 2 0.598 0.358 0.348 0.922 1 196 0.338 Financial services
1 0.610 0.373 0.366 58.480 2 197 0.001 2 0.611 0.373 0.364 0.232 1 196 0.631 Transportation services
1 0.595 0.354 0.348 54.005 2 197 0.001 2 0.595 0.354 0.344 0.014 1 196 0.906 Entertainment services
1 0.570 0.325 0.318 47.495 2 197 0.001 2 0.571 0.326 0.316 0.191 1 196 0.663
MRN
29,12
794
service to their customers and compare their achievements with competitors. By doing so, they will be positioned to create satisfied, loyal and committed customers who ‘‘will not only return for repeat business but will also bring their friends and family with them’’ (Veloutsouet al., 2005).
Table X.
Predicting customer commitment: satisfaction and service setting effects
Variable Slope (B) S.E. of slope t Sign Tolerance VIF
Retailing services
Satisfaction 0.568 0.078 7.247 0.001 0.534 1.872 Service setting 0.368 0.119 3.081 0.002 0.926 1.080 Product term 0.105 0.110 0.960 0.338 0.566 1.768 Financial services
Satisfaction 0.600 0.059 10.246 0.001 0.933 1.072 Service setting 0.541 0.201 2.688 0.008 0.872 1.147 Product term 0.118 0.244 0.481 0.631 0.822 1.217 Transportation services
Satisfaction 0.615 0.071 8.668 0.001 0.654 1.529 Service setting 0.194 0.174 1.116 0.266 0.678 1.474 Product term 0.017 0.147 0.118 0.906 0.522 1.915 Entertainment services
Satisfaction 0.551 0.062 8.910 0.001 0.899 1.113 Service setting 0.137 0.177 1.772 0.441 0.856 1.168 Product term 0.080 0.182 0.437 0.663 0.787 1.271
Table XI.
1 0.561 0.315 0.308 45.312 2 197 0.001 2 0.564 0.318 0.308 0.842 1 196 0.360
Note:Model 1¼main effects; model 2¼main- and interaction effects
Table XII.
Predicting customer loyalty: commitment and gender effects
Variable Slope (B) S.E. of slope t Sign Tolerance VIF
Commitment 0.624 0.106 5.868 0.001 0.308 3.250 Gender 0.151 0.124 1.216 0.225 0.963 1.038 Product term 0.118 0.129 0.918 0.360 0.314 3.183
Table XIII.
Collinearity diagnostics
Variance proportions
Variable Eigenvalue Condition index (Constant) Satisfaction Gender Product term
Service
organizations
in Greece
795
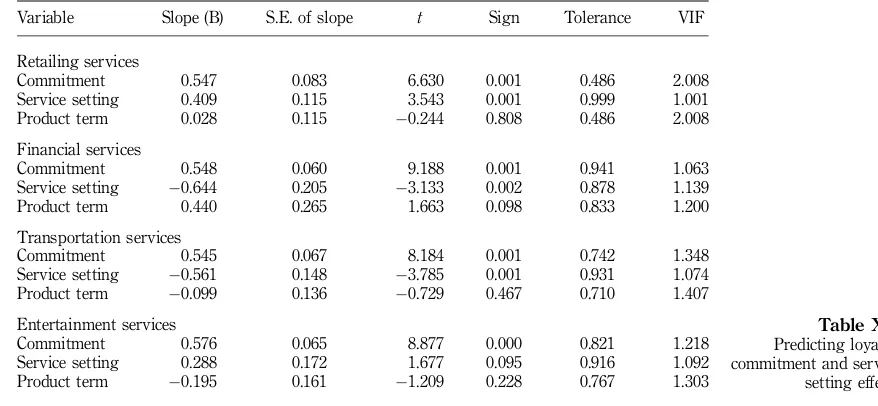
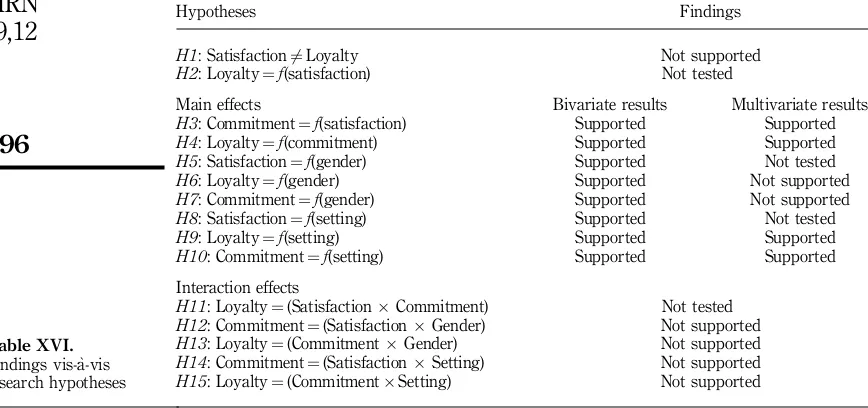
This paper attempted to test the distinctiveness of customer satisfaction and loyalty, and to explore the nature of interrelationships among service setting, gender, satisfaction, loyalty and commitment in the Greek context. Overall, fifteen hypotheses were tested. Findings vis-a`-vis research hypotheses are summarized in Table XVI. The data revealed an unexpected conceptual overlap between satisfaction and loyalty, while satisfaction and commitment as well as loyalty and commitment emerged clearly as distinct concepts in accordance with expectations. These findings are in line with findings reported by Maddenet al.(1986), yet contrary to the conclusions reached by Bennett and Rundle-Thiele (2004), and may be attributed either to the measure of overall cumulative
Table XIV.
1 0.593 0.351 0.345 53.317 2 197 0.001 2 0.593 0.351 0.345 0.059 1 196 0.808 Financial services
1 0.578 0.334 0.327 49.395 2 197 0.001 2 0.586 0.343 0.333 2.765 1 196 0.098 Transportation services
1 0.595 0.354 0.348 54.052 2 197 0.001 2 0.597 0.356 0.346 0.531 1 196 0.467 Entertainment services
1 0.563 0.317 0.310 45.628 2 197 0.001 2 0.567 0.322 0.311 1.462 1 196 0.228
Note:Model 1¼main effects; model 2¼main- and interaction effects
Table XV.
Predicting loyalty: commitment and service setting effects Variable Slope (B) S.E. of slope t Sign Tolerance VIF
Retailing services
Commitment 0.547 0.083 6.630 0.001 0.486 2.008 Service setting 0.409 0.115 3.543 0.001 0.999 1.001 Product term 0.028 0.115 0.244 0.808 0.486 2.008 Financial services
Commitment 0.548 0.060 9.188 0.001 0.941 1.063 Service setting 0.644 0.205 3.133 0.002 0.878 1.139 Product term 0.440 0.265 1.663 0.098 0.833 1.200 Transportation services
Commitment 0.545 0.067 8.184 0.001 0.742 1.348 Service setting 0.561 0.148 3.785 0.001 0.931 1.074 Product term 0.099 0.136 0.729 0.467 0.710 1.407 Entertainment services
MRN
29,12
796
satisfaction that was employed in the present study and/or to the cultural background of the sample, since ‘‘all measurement of consumer satisfaction is contextually defined’’ (Veloutsou et al., 2005, p. 622). It would appear that the discriminant validity of service satisfaction and loyalty still remains an unresolved issue, worthy of further investigation. In this respect, encounter – and/or facet satisfaction measures might prove more appropriate in the design of similar future studies.
Moreover, no significant gender and setting interaction effects were identified – contrary to expectations yet in line with previous findings (Ndubisi, 2006). Lastly, word of mouth emerged as an integral part of customer loyalty in the present study, contrary to previous conceptualizations (Hoest and Knie-Andersen, 2004).
One of the limitations of the current study derives from the sampling context and procedures employed to collect the primary data. A more systematic probabilistic sampling procedure that would entail larger nation-wide samples is needed in order to affirm the present results. In addition, tapping instrumental along with affective commitment might enhance our understanding of the satisfaction-commitment-loyalty relationships. Lastly, more in-depth and/or longitudinal research designs in different service settings may be adopted, incorporating additional organizational as well as employee variables.
References
Alexander, N. and Myers, H. (2000), ‘‘The retail internalization process’’,International Marketing Review, Vol. 17 No. 4/5, pp. 334-53.
Barsky, J. (1995),World-Class Customer Satisfaction, Irwin Professional, Burr Ridge, IL.
Bennett, R. and Rundle-Thiele, S. (2004), ‘‘Customer satisfaction should not be the only goal’’, Journal of Services Marketing, Vol. 16 No. 7, pp. 514-23.
Besterfield, D.H. (1994),Quality Control, Prentice-Hall, Englewood Cliffs, NJ.
Bloemer, M.J. and Kasper, P.D. (1995), ‘‘The complex relationship between consumer satisfaction and brand loyalty’’,Journal of Economic Psychology, Vol. 16, pp. 311-29.
Table XVI.
Findings vis-a`-vis research hypotheses
Hypotheses Findings
H1: Satisfaction6¼Loyalty Not supported
H2: Loyalty¼f(satisfaction) Not tested
Main effects Bivariate results Multivariate results
H3: Commitment¼f(satisfaction) Supported Supported
H4: Loyalty¼f(commitment) Supported Supported
H5: Satisfaction¼f(gender) Supported Not tested
H6: Loyalty¼f(gender) Supported Not supported
H7: Commitment¼f(gender) Supported Not supported
H8: Satisfaction¼f(setting) Supported Not tested
H9: Loyalty¼f(setting) Supported Supported
H10: Commitment¼f(setting) Supported Supported Interaction effects
H11: Loyalty¼(SatisfactionCommitment) Not tested
H12: Commitment¼(SatisfactionGender) Not supported
H13: Loyalty¼(CommitmentGender) Not supported
H14: Commitment¼(SatisfactionSetting) Not supported
Service
organizations
in Greece
797
Bowen, J.T. and Chen, S.L. (2001), ‘‘The relationship between customer loyalty and customer satisfaction’’,International Journal of Contemporary Hospitality Management, Vol. 13 No. 5, pp. 213-7.
Clark, T. and Rajaratham, D. (1999), ‘‘International services: perspectives at century’s end’’,The Journal of Services Marketing, Vol. 13 No. 4/5, pp. 298-314.
Conway, J.M. and Huffcutt, A.I. (2003), ‘‘A review and evaluation of exploratory factor analysis practices in organizational research’’, Organizational Research Methods, Vol. 6 No. 2, pp. 147-68.
De Ruyter, K., Wetzels, M. and Bloemer, J. (1998), ‘‘On the relationship between perceived service quality, service loyalty and switching costs’’, International Journal of Service Industry Management, Vol. 9 No. 5, pp. 436-53.
Donnelly, M., Wisniewski, M., Dalrymple, J. and Curry, A. (1995), ‘‘Measuring service quality in local government: the SERVQUAL approach’’, International Journal of Public Sector Management, Vol. 8 No. 7, pp. 15-20.
Edgett, S. and Parkinson, S.T. (1993), ‘‘Marketing for service industries: a review’’, Service Industries Journal, Vol. 13 No. 3, pp. 19-39.
Fecikova, I. (2004), ‘‘An index method for measurement of customer satisfaction’’, The TQM Magazine, Vol. 16 No. 1, pp. 57-66.
Fullerton, G. (2003), ‘‘When does commitment lead to loyalty’’,Journal of Service Research, Vol. 5 No. 4, pp. 333-44.
Fullerton, G. (2005), ‘‘How commitment both enables and undermines marketing relationships’’, European Journal of Marketing, Vol. 39 No. 11-12, pp. 1372-88.
Gremler, D.D. and Brown, S.W. (1996), ‘‘Service loyalty: its nature, importance and implications’’, in Edvardsson, B., Brown, S.W., Sohnston, R. and Scheuing, E. (Eds),QUIS V: Advancing Service Quality: A Global Perspective, ISQA, New York, NY, pp. 171-81.
Hair, J.F., Anderson, R.E., Tatham, R.L. and Black, W.C. (1998),Multivariate Data Analysis, 5th ed., Prentice-Hall International, London.
Hansemark, O.C. and Albinsson, M. (2004), ‘‘Customer satisfaction and retention: the experience of individual employees’’,Managing Service Quality, Vol. 14 No. 1, pp. 40-57.
Hennig-Thurau, T. (2004), ‘‘Customer orientation of service employees: its impact on customer satisfaction, commitment and retention’’, International Journal of Service Industry Management, Vol. 15 No. 5, pp. 460-78.
Heskett, J.L., Sasser, W.E. and Schlesinger, L.A. (1997), The Service Profit Chain, Free Press, New York, NY.
Hinkin, T. (1995), ‘‘A review of scale development practices in the study of organizations’’,Journal of Management, Vol. 21 No. 5, pp. 967-88.
Hoest, V. and Knie-Andersen, M. (2004), ‘‘Modeling customer satisfaction in mortgage credit companies’’,The International Journal of Bank Marketing, Vol. 22 No. 1, pp. 26-42.
Hutcheson, G. and Sofroniou, N. (1999),The Multivariate Social Scientist: Introductory Statistics Using Generalized Linear Models, Sage, Thousand Oaks, CA.
Johnson, M., Gufstafsson, A., Andreassen, T.W., Lervik, L. and Cha, J. (2001), ‘‘The evolution and future of national customer satisfaction index models’’,Journal of Economic Psychology, Vol. 22 No. 2, pp. 217-45.
Jones, P. and Hillier, D. (2002), ‘‘Urban leisure complexes in the UK: planning and management issues’’,Management Research News, Vol. 25 No. 11, pp. 75-83.
Jones, T.O. and Sasser, E.W. (1995), ‘‘Why satisfied customers defect’’,Harvard Business Review, Vol. 73 No. 6, November-December, pp. 88-99.
MRN
29,12
798
Kanji, G. and Moura, P. (2002), ‘‘Kanji’s business scorecard’’,Total Quality Management, Vol. 13 No. 1, pp. 13-27.
Levesque, T. and McDougall, G. (1996), ‘‘Determinants of customer satisfaction in retail banking’’, International Journal of Bank Marketing, Vol. 14 No. 7, pp. 12-20.
McCarthy, D.G. (1997),The Loyalty Link: How Loyal Employees Create Loyal Customers, John Wiley and Sons Inc., New York, NY.
Madden, T.J., Dillon, W.R. and Twible, J.L. (1986), ‘‘Construct validity of attitude toward the ad: an assessment of convergent/discriminant dimensions’’, in Olson, J. and Sentis, K. (Eds), Advertising and Consumer Psychology, Vol. 3, Praeger, New York, NY, pp. 74-92.
Mattila, A.S. (2004), ‘‘The impact of service failures on customer loyalty: the moderating role of affective commitment’’,International Journal of Service Industry Management, Vol. 15 No. 2, pp. 134-49.
Miles, J. and Shelvin, M. (2003),Applying Regression and Correlation, Sage, London.
Molitor, G. (2000), ‘‘Emerging economic sectors in the third millennium: leisure time era begins to dominate US economy by 2015’’,Foresight, Vol. 2 No. 4, pp. 425-8.
Ndubisi, N.O. (2006), ‘‘Effect of gender on customer loyalty: a relationship marketing approach’’, Marketing Intelligence and Planning, Vol. 24 No. 1, pp. 48-61.
Ndubisi, N.O. and Wah, C.K. (2005), ‘‘Factorial and discriminant analyses of the underpinnings of relationship marketing and customer satisfaction’’, International Journal of Bank Marketing, Vol. 23 No. 7, pp. 542-57.
Nicholls, J.A.F., Gilbert, G.R. and Roslow, S. (1998), ‘‘Parsimonious measurement of customer satisfaction with personal service and the service setting’’,Journal of Consumer Marketing, Vol. 15 No. 3, pp. 239-53.
Pritchard, M.P. and Howard, D.R. (1997), ‘‘The loyal traveler: examining a typology of service patronage’’,Journal of Travelers Research, Vol. 35 No. 4, pp. 2-11.
Redman, T. and Mathews, B.R. (1998), ‘‘Service quality and human resource management: a review and research agenda’’,Personnel Review, Vol. 27 No. 1, pp. 57-77.
Rhoades, L., Eisenberger, R. and Armeli, S. (2001), ‘‘Affective commitment to the organization: the contribution of perceived organizational support’’,Journal of Applied Psychology, Vol. 86 No. 5, pp. 825-36.
Samiee, S. (1999), ‘‘The internationalization of services: trends, obstacles and issues’’,The Journal of Services Marketing, Vol. 13 No. 4/5, pp. 319-32.
Schumacker, R.E. and Lomax, R.G. (2004),A Beginner’s Guide to Structural Equation Modeling, Lawrence Erlbaum Associates, London.
Stell, R. and Donoho, C. (1996), ‘‘Classifying services from a consumer perspective’’,The Journal of Services Marketing, Vol. 10 No. 6, pp. 33-44.
Szymanski, D.M. and Henard, D.H. (2001), ‘‘Customer satisfaction: a meta-analysis of the empirical evidence’’,Journal of the Academy Marketing Science, Vol. 29 No. 1, pp. 16-35. Tabashnick, B.G. and Fidell, L.S. (1996),Using Multivariate Statistics, 3rd ed., Harper Collins,
New York, NY.
Taylor, S.A. (1997), ‘‘Assessing regression-based importance weights for quality perceptions and satisfaction judgements in the presence of higher order and/or interaction effects’’,Journal of Retailing, Vol. 73 No. 1, pp. 135-59.
Ueltschy, L.C. and Krampf, R.F. (2001), ‘‘Cultural sensitivity to satisfaction and service quality measures’’,Journal of Marketing Theory and Practice, Vol. 9 No. 3, pp. 14-31.
Service
organizations
in Greece
799
Zins, A.H. (2001), ‘‘Relative attitudes and commitment in customer loyalty models’’,International Journal of Service Industry Management, Vol. 12 No. 3, pp. 269-94.
Further reading
Bendall-Lyon, D. and Powers, T.L. (2002), ‘‘The impact of gender differences on change in satisfaction over time’’,Journal of Consumer Marketing, Vol. 19 No. 1, pp. 12-23.
Bennison, D. and Boutsouki, C. (1995), ‘‘Greek retailing in transition’’,International Journal of Retail and Distribution Management, Vol. 23 No. 1, pp. 24-31.
Reichheld, F.F. (1996), ‘‘Learning form customer defections’’,Harvard Business Review, Vol. 74 No. 2, March-April, pp. 56-69.
Smith, A. and Reynolds, N. (2001), ‘‘Measuring cross-cultural service quality: a framework for assessment’’,International Marketing Review, Vol. 19 No. 5, pp. 450-81.
Taylor, S.A. and Baker, T.L. (1994), ‘‘An assessment of the relationship between service quality and customer satisfaction in the formation of consumer’s purchase intentions’’,Journal of Retailing, Vol. 70 No. 2, pp. 163-78.
Ting, D.H. (2006), ‘‘Further probing of higher order in satisfaction construct: the case of banking institutions in Malaysia’’,International Journal of Bank Marketing, Vol. 24 No. 2, pp. 98-111.
Appendix
SAT1: I am fully satisfied with company ‘‘X’’ SAT2: Company ‘‘X’’ always fulfills my expectations SAT3: My experiences with company ‘‘X’’ are excellent SAT4: Company ‘‘X’’ has never disappointed me so far
Customer loyaltya
De Ruyteret al.(1998)
LOYAL1: I would definitely recommend company ‘‘X’’ to someone who seeks my advise LOYAL2: I encourage relatives and friends to do business with company ‘‘X’’
LOYAL3: I intend to do more business with company ‘‘X’’ in the next few years LOYAL4: I say positive things about company ‘‘X’’ to others
LOYAL5: I consider company ‘‘X’’ my first choice to buy the services I need
LOYAL6: I would continue to do business with company ‘‘X’’ even if its prices increased somewhat LOYAL7: I would pay a higher price than competitors charge for the benefits I currently receive
Customer commitmenta
Fullerton (2005)
COMM1: I feel emotionally attached to company ‘‘X’’
COMM2: Company ‘‘X’’ has a great deal of personal meaning for me COMM3: I feel a strong sense of identification with company ‘‘X’’ Hennig-Thurau (2004)
COMM5: My relationship with company ‘‘X’’ is important to me
COMM7: If company ‘‘X’’ were no longer to exist, this would be a significant loss for me Mattila (2004)
COMM4: The level of my emotional attachment to company ‘‘X’’ is high
COMM6: My relationship with company ‘‘X’’ has a great deal of personal meaning
MRN
29,12
800
About the author
Zoe S. Dimitriades earned her PhD in Organizational Behavior from the London School of Economics and Political Science, University of London, London, UK. Presently, she serves as an Associate Professor of Management at the Department of Business Administration, University of Macedonia, 156 Egnatia Street, 540 06 Thessaloniki, Greece. Her current research interests center on customer satisfaction, loyalty and commitment, extra role behaviors of customer-contact employees, organization and employee customer- and service orientation. Zoe S. Dimitriades can be contacted at: zd@uom.gr
To purchase reprints of this article please e-mail:reprints@emeraldinsight.com