TECHNICAL EFFICIENCY OF WATERMELON
FARMING IN BLAMBANGAN VILLAGE, MUNCAR
SUB-DISTRICT, BANYUWANGI, EAST-JAVA,
INDONESIA
Ade Yoga Pratama
1, Sujarwo
2*1 Student of Agribusiness Study Program, Faculty of Agriculture, Universitas of Brawijaya, Malang 2 Lecturer of Agricultural Economics Department, Agricultural Faculty, University of Brawijaya
*corresponding author: [email protected]
ABSTRACT: Small-scale farmers in Blambangan Village, Banyuwangi, East Java, Indonesia take risk decision in growing watermelon. Assuming that farmers are rational, they will be able to overcome many obstacles regarding the risky watermelon farming. However, in term of efficiency farmers have vary among them and this is the interested topic to be observed more. In line with this thought, this study has several objectives: (1) to analyze the level of technical efficiency of the use of factors of production in farming watermelons in the research area, and (2) to analyze the ratio between actual input and optimum input that should be used in the research area. The method used is Data Envelopment Analysis (DEA) approach. The value of technical efficiency in this study is based on input-oriented and measurement of technical efficiency use DEA VRS (Variable Return to Scale). The results show that the average technical efficiency of respondent farmers are equal to 0.901. There are 11 respondents in state of Constant Return to Scale (CRS), 8 respondents in state of Increasing Return to Scale (IRS), and 2 respondents in state of Decreasing Return to Scale (DRS). There slack for all inputs used.
Keywords: watermelon, DEA, VRS, input oriented, slack
INTRODUCTION
Increased domestic consumption of watermelon in Indonesia in 2011 reached 1.25 kg/capita, which is higher than the consumption in 2010, which is equal to 1.04 kg/capita (Ministry of Agriculture, 2012). Increased demand and consumption can be met through increased production.
The watermelon production in Indonesia depends on farmers’ preference in watermelon farming. Farmers really have to take more effort by themselves in overcoming every obstacles due to lack of government concern for this kind of farming.
Blambangan village is one of village in Banyuwangi district, which is the highest production of watermelon with total 18.904 tons watermelon. Blambangan also is considered as one of watermelon production centers in Banyuwangi.
The result of production watermelon obtained from the combination of inputs, such as labor, seed, fertilizer, and also pesticides employed by farmers.
According to Soekarwati (1994), efficiency is an attempt to use a minimal input to generate maximum output. Farrell (1957) in Coelli et al (1998) explains that the combination of inputs by farmers results technical efficiency measurement. So, the technical efficiency can reflect the ability of farmers to obtain the maximum results from the use of certain inputs.
Many efficiency researches have been done related to production efficiency. Sujarwo et al
(2015) using frontier production function of shallot production in East-Java Indonesia found that the farmers relatively efficient in allocation of land and labor. Moreover, comparing the farming size, smaller size farming is more efficient in using seed than the higher one. Suprisingly, the research also found that fertilizer and pesticides use are less than optimal one. The profit gap between optimum and actual one is about 30 percent. The profit gap among the smaller and the higher farming size are relatively the same.
between shallot farming in 2005 and 2012), there are changing of production efficiency. Changing of price or allocative efficiency got lower in 2012 comparing to that in 2005. However, technical efficiency is not changing much between those two years of production.
Ogunniyi (2012) was conducted a study of maize production efficiency and found that average value of technical efficiency of 0.64. Dhungana (2004) was conducted a study on rice commodities and found that the value of the average technical efficiency of 0.76. Luke (2012) was doing research on food crops and calculated technical efficiency obtained by farmers. The technical efficiency found was 0.85 on average; Rossana (2001) conducted a study on rice commodities and found the value of the average technical efficiency was 0.71. Asmarantaka (2011) found the highest measurement of technical efficiency. It was 0.93 of technical efficiency in sugar cane commodities.
This research is also intended to observe technical efficiency in watermelon commodity by applying DEA.
RESEARCH METHODS
This research was conducted in the village of Blambangan, Muncar subdistrict, Banyuwangi considered that the location as the central production of watermelon in Banyuwangi with production reaching 18.904 ton.
The sampling method is purposive. This study deliberately takes farmers who cultivate land for watermelon production in the village Blambangan, Muncar subdistrict, Banyuwangi. The number of farmers that produce watermelon is 21 farmers. All of them become respondent for this research. Furthermore, the farmers also represent members of Tani Lestari Farmers’ Group.
Data used include primary data and secondary data. Primary data are collected from the farmer respondents through interviews. The data consist of farm planting activities in the season in January 2016. The primary data considered are inputs use, production level, and the socio-economic characteristics of the respondent. Moreover, secondary data were also compiled which are from the Central Bureau of Statistics, Ministry of Agriculture, and Department of Agriculture, Banyuwangi.
In this study, calculating the value of efficiency uses Data Envelopment Analysis (DEA) approach. According to the DEA, a unit of economic activity is said efficienct technically when the ratio of
output and input used is equal to one, meaning that the unit of economic activity is already not doing extravagance in the use of production inputs or able to exploit the potential production capability possessed optimally to produce highest output.
The value of technical efficiency in this study is based on input-oriented (input minimization). Measurement of technical efficiency using DEA VRS (Variable Return to Scale) with the consideration that the watermelon farming is not operating at optimal scale for their limited production costs and productivity of the factors of production used and there is variation of inputs use from each farm. VRS input-oriented models are as follows:
Where DMU0 is DMU under evaluation and xi0 and yr0 are input and outpur f DMU0, respectively. 𝜃
represent (input-oriented) efficiency score of DMU observed.
RESULTS AND DISCUSSION
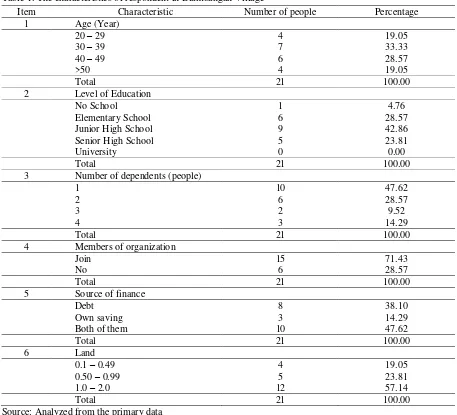
Respondents in this study are farmers who are producing watermelons in the season of January 2016 in the village of Blambangan, Muncar sub-district, Banyuwangi. Total respondents are 21 farmers. The characteristics of the farmers in terms of age, level of education, the status of farming, land tenure, land area, number of dependents in the family in the home of farmers, membership in the institution, and access the credit institution are displayed in the tables below.
Respondents, watermelon farmer, in the village of Blambangan have different characteristics that affect the decision of watermelon farmer in carrying out farming activities. Differences in these characteristics will affect the performance and efficiency of the farming.
The education level is assumed to affect the mindset of farmers and the level of technology absorption. Based on Table 1 can be seen the level of education of farmers in the village of respondents Blambangan, Muncarsubdistrict, Banyuwangi mostly junior high school graduates. Financial is the reason some farmers respondent did not continue their education.
Respondents in this study have a number of dependents vary between 1-4 people. Based on
Table 1 it can be seen that the highest percentage of the number of dependents in the household is as much as one person. But, there are also farmers who have dependents as many as four people. This amount will indirectly burden the farmers due to the greater number of dependents in the household the farmer, it will impact on the high expenditure on household consumption.
Table 1. The characteristics of respondent in Blambangan Village
Item Characteristic Number of people Percentage
1 Age (Year)
20 – 29 4 19.05
30 – 39 7 33.33
40 – 49 6 28.57
>50 4 19.05
Total 21 100.00
2 Level of Education
No School 1 4.76
Elementary School 6 28.57
Junior High School 9 42.86
Senior High School 5 23.81
University 0 0.00
Total 21 100.00
3 Number of dependents (people)
1 10 47.62
2 6 28.57
3 2 9.52
4 3 14.29
Total 21 100.00
4 Members of organization
Join 15 71.43
No 6 28.57
Total 21 100.00
5 Source of finance
Debt 8 38.10
Own saving 3 14.29
Both of them 10 47.62
Total 21 100.00
6 Land
0.1 – 0.49 4 19.05
0.50 – 0.99 5 23.81
1.0 – 2.0 12 57.14
Total 21 100.00
Source: Analyzed from the primary data
According to Table 1, the farmers that joint to the farmers’group are 71.43 percent and the rest (28.57 percent) is the farmers who are not joining in the farmers’ group. Regarding source of cost spending for watermelon production, it can be obtained from internal or external sources.
Based on Table 1, it shows that there are some farmers (38.10 percent) that obtain financial
support for the farming from informal credit institutions at the research location about 14 percent from own farmer’s saving, and the rest are getting financial support from both sources.
respondents employ 1.0 to 2.0 hectares (57.14 percent). Comparing to the average land occupation per farmers in East-Java Province, which is about 0.3 hectar on average, the level of land size of watermelon production in the research location is quite bigger.
Technical Efficiency
Based on the analysis of DEA using DEAP Version 2.1, the results show that efficient DMUs in watermelon production is about 71.4 percent or 15 farmers out of 21 respondents observed. On the
other hand, the farmers who have less efficiency are 6 farmers or 28.6 percent. The variance of the efficiency level among the farmers is not clearly related to the farming size (land input) but it seems more related to productivity of DMU (Figure-1). Furthermore, the efficiency of DMUs of all DMUs can be shown in Tabel 2.
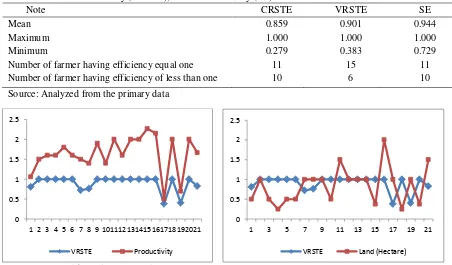
The average value of Constant Return to Scale Technical Efficiency (CRSTE), Variable Return to Scale Technical Efficiency (VRSTE), and Scale Efficiency (SE) of the respondents can be shown in Table 3.
Table 2. The DMUs efficiency level
DMU CRSTE VRSTE SE Keterangan DMU CRSTE VRSTE SE Keterangan
1 0.638 0.809 0.788 IRS 12 1 1 1 CRS
2 1 1 1 CRS 13 1 1 1 CRS
3 1 1 1 CRS 14 1 1 1 CRS
4 0.783 1 0.783 IRS 15 1 1 1 CRS
5 0.9 1 0.9 IRS 16 1 1 1 CRS
6 1 1 1 CRS 17 0.279 0.383 0.729 IRS
7 0.712 0.724 0.984 DRS 18 1 1 1 CRS
8 0.763 0.765 0.998 IRS 19 0.35 0.405 0.864 IRS
9 1 1 1 CRS 20 0.91 1 0.91 IRS
10 0.875 1 0.875 IRS 21 0.827 0.829 1 DRS
11 1 1 1 CRS Mean 0.859 0.901 0.944 -
Source: Analyzed from the primary data
Table 3. Average value of constant return to scale technicall efficiency (CRSTE), variable return to scale technical efficiency (VRSTE), and scale efficiency (SE) of watermelon farmers
Note CRSTE VRSTE SE
Mean 0.859 0.901 0.944
Maximum 1.000 1.000 1.000
Minimum 0.279 0.383 0.729
Number of farmer having efficiency equal one 11 15 11 Number of farmer having efficiency of less than one 10 6 10 Source: Analyzed from the primary data
Source: Analyzed from the primary data
Figure 1. Correlation Variable Return to Scale Technical Efficiency and other input variables
0 0.5 1 1.5 2 2.5
1 2 3 4 5 6 7 8 9 101112131415161718192021
VRSTE Productivity
0 0.5 1 1.5 2 2.5
1 3 5 7 9 11 13 15 17 19 21
The value of technical efficiency watermelon farmer in the village of Blambangan, Muncar subdistrict, Banyuwangi varies from 38.3 percent to 100 percent. This range is relatively high comparing to the previous research mentioned in the previous chapter. This study is similar to research conducted by Ibrahim et al. (2014) watermelon farmers in Borno, Nigeria, where the inefficient farmers reached 30 percent of total respondents.
Farmers respondents who are in conditions of increasing returns to scale (IRS) are 8 farmers (38.09 percent), while 9.5 percent of farmers were under conditions of decreasing returns to scale (DRS), and 11 farmers (52,3 percent) in the state of constant returns to scale (CRS). Based on this result, it shows that most farmers in Blambangan, Muncar subdistrict, Banyuwangi mostly is in the position where the increase in output is equal to the increase in input (constant return to scale). In this sense, farmers who have lower technical efficiency should observe and learn more from the peer who have higher result and better efficiency. Futhermore, the level of productivity represents the ability of DMU allocating input more efficiently and get better technical efficiency.
Excessive Input Allocated (Slack)
Slack is the number of input that should be adjusted in onder to gain better technical efficiency. A certain DMU could allocate the input used effectively and gain productivity and profit of their farming. Other DMU with less efficient will allocate the input in such away that one or more
inputs tend to overused and incrasing their cost of production as a result and lowering the profit in the end. The comparation among several DMUs can be presented at Tabel 4.
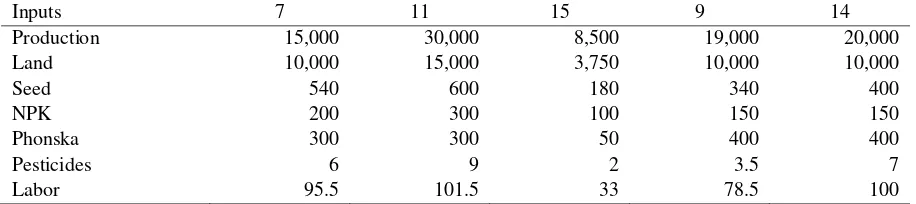
Table 4 shows the comparison among 5 DMUs chosen for analyzing their decision in inputs allocation. Farmer’s number 7 has lower technical efficiency (0.71 percent) comparing to the others, which have technical efficiency of 1. The inefficiency of farmer’s number 7 is related to inefficiency in allocation of seed, fertilizers, pesticides, and labor. The four inputs have positive slack of inputs, which mean that the farmer used the input higher than efficient level as allocated by efficient peer. Farmer’s number 7 allocated 540 grams of seed. Moreover, Phonska fertilizer, pesticides, and labor are allocated 300 kilograms, 6 liters, and 95.5 labor days, respectively. The production of watermelon is 15 tons. Meanwhile, respondents' number 14 used 400 grams of seeds, 400 kilograms Phonska fertilizer, 7 liters pesticides, and 100 labor days of labor to produce 20 tons of watermelon. Respondents number 11, number 15, number 9 and number 14 has a slack value equal to zero (zero slack) for all variables used (does not have excessive amount in using inputs). Farmer’s number 7 has a slack value (excess input) as many as 86.82 grams of seeds, 30.04 kilograms of Phonska fertilizer, and 7.58 labor days. The farmer’s number 7 can reduce the use of those inputs in order to gain efficiency and at the same level of watermelon productivity.
Table 4. Comparison among DMU allocation of inputs
Inputs 7 11 15 9 14
Production 15,000 30,000 8,500 19,000 20,000
Land 10,000 15,000 3,750 10,000 10,000
Seed 540 600 180 340 400
NPK 200 300 100 150 150
Phonska 300 300 50 400 400
Pesticides 6 9 2 3.5 7
Labor 95.5 101.5 33 78.5 100
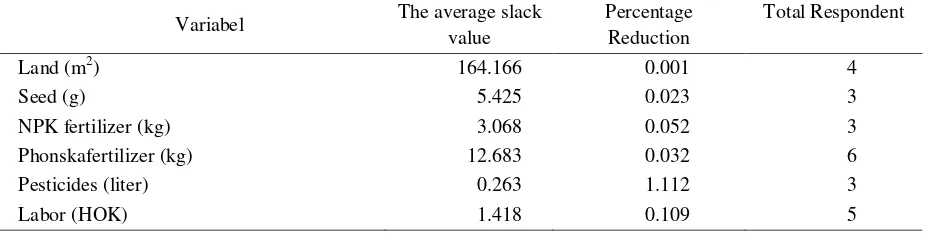
Based on the results obtained, the average value of the input slack for land, seed, NPK fertilizer, phonska fertilizers, pesticides, and labor have slack on average. The higher average value of the input
Table 5. Value input overload (input slack) average of all the respondents
Variabel The average slack value
Phonskafertilizer (kg) 12.683 0.032 6
Pesticides (liter) 0.263 1.112 3
Labor (HOK) 1.418 0.109 5
Based on Table 5, judging from the input side, the majority of farmers in watermelon farming already have efficient technically. But, there are still six respondents (28.57 percent of the total respondents) in the village of Blambangan, Muncar subdistrict, Banyuwangi that have inefficient allocation of inputs which need to reduce to get optimal level as noted above.
Pesticides and labor are used in the highest excessive way of watermelon farming in the village. Pesticides shold be reduce 0.263 liter for better efficiency and labor should be reduced by 1.418 HOK (labor day). This is mathematical calculation for representing how the relation between input and output established numerically; but the fact is that wothermellon is also one of risky aricultural production. In this understanding, reducing labor and pesticides can increase the variability of results or yields and possibly give hiher potential damage from pests and diseases attached watermelon crops. Therefore, this results also show empirically that agricultural farming find many difficulties in mproving their better production due to many external factors especially from weather that push the farmers deciding allocation of input inefficiently due to the trade off between risk and efficiency. Horticultural farmers tend to loss their efficiency due to higher protection for their crop and they apply more pesticide and labor. However, if they try to improve their efficiency, they face more risk due to decreasing pesticides and labor for watermelon farming.
Comparison of Actual and Optimum Inputs
Based on 21 observations, there were 15 respondents were efficient in the use of inputs allocation. For example DMU 2 with allocations of land area (X1) of 10,000 m2, seeds (X2) of 300
Watermelon Farming efficiency and allocation of inputs in the research location can be described as follow:
1. Based on the calculation of technical efficiency, average efficiency score of 0.901 (VRSTE). The efficient farmers are 71.4 percent with zero slack of inputs allocation and 28.6 percent of the farmers still have to re-allocate the input for gaining better efficiency level
2. The efficiency level of watermelon farmers is note closely related to the farming size. There is no enough evident that efficiency related to farming size for the case of watermelon farming in Blambangan Village, Muncar, Banyuwangi, East-Java, Indonesia. 3. The higher slack of inputs are pesticides and
efficiency and production loss. In this condition, farmers have to get more information related to farming practices and get more understanding about the watermelon production behavior related to inputs use. Precision in using inputs and precision in observing the attack of pests and diseases are the key factor of reducing the level of trade-off between efficiency and production loss.
REFERENCES
Asmarantaka, R. (2011). Analisis Usahatani Tebu Rakyat Di Lampung. Bogor. Departemen Agribisnis. Institut Pertanian Bogor.
Badan Pusat Statistik. (2014). Banyuwangi dalam Angka 2014. Jawa Timur: Badan Pusat Statistik.
Coelli T, Rao PSD, Battese GE. (1998). An Introduction to Efficiency and Product Analysis. London: Kluwer Academic Publisher.
Dhungana BR, Nuthall PL, Nartea GV. (2004). Measuring the Economic Inefficiency of Nepalese Rice Farms Using Data Envelopment Analysis. The Australian Journal of Agricultural and Resource Economics. 48(2): 347–369.
Farrel, M.J. (1957). The Measurement of Productivity Efficiency. Journal of Royal Statistics Society Series. Vol. 120 (Part III): 253-290
Ibrahim UW, Umar ASS, Ahmed B. (2014). Technical Efficiency and its Determinants in Water Melon Production in Borneo State, Nigeria. Journal of Economics and
Sustainable Development. ISSN 2222-1700 Vol.5 No 27
Luke, N. (2012). Analysis of Farm Household Technical Efficiency in Northern Ghana Using Bootstrap DEA. Australia. University of Western Australia
Ogunniyi, L.T. (2012). Fertilizer Use Efficiency of Maize Producers in Ogun State of Nigeria. The Pacific Journal of Science and Technology. 13(2): 370-376.
Rossana, P. (2001). Efisiensi Teknis dan Ekonomis Usahatani Padi Pandan Wangi. Jurnal Forum Agribisnis Vol 1 No 1(Maret): 58-75
Soekartawi. (1994). Teori Ekonomi Produksi dengan Pokok Bahasan Analisis Cobb-Douglas Edisi 1.Jakarta: PT Raja Grafindo Persada.
Sujarwo, Michael R. Reed, Sayyed H. Saghaian. (2015). Production Effficiency of Small-Scale Shallot Producers in East Java, Indonesia. Journal of Global Economics, Management, and Business Research. Vol. 2 (Issue 2): 59-71