http://jht.sagepub.com
Research
DOI: 10.1177/1096348009344212
2009; 33; 487 Journal of Hospitality & Tourism ResearchHeesup Han and Kisang Ryu
Industry
Satisfaction in Determining Customer Loyalty in the Restaurant
The Roles of the Physical Environment, Price Perception, and Customer
http://jht.sagepub.com/cgi/content/abstract/33/4/487The online version of this article can be found at:
Published by:
http://www.sagepublications.com
On behalf of:
International Council on Hotel, Restaurant, and Institutional Education
can be found at:
Journal of Hospitality & Tourism Research
Additional services and information for
http://jht.sagepub.com/cgi/alerts
Email Alerts:
http://jht.sagepub.com/subscriptions
Subscriptions:
http://www.sagepub.com/journalsReprints.nav
Reprints:
http://www.sagepub.com/journalsPermissions.nav
Permissions:
http://jht.sagepub.com/cgi/content/refs/33/4/487
487
Journal of Hospitality & Tourism Research, Vol. 33, No. 4, November 2009, 487-510 DOI: 10.1177/1096348009344212
© 2009 International Council on Hotel, Restaurant and Institutional Education
ENVIRONMENT, PRICE PERCEPTION,
AND CUSTOMER SATISFACTION IN
DETERMINING CUSTOMER LOYALTY IN
THE RESTAURANT INDUSTRY
Heesup Han
Dong-A University
Kisang Ryu
University of New Orleans
This research aims to examine the relationships among three components of the physical environment (i.e., décor and artifacts, spatial layout, and ambient conditions), price per-ception, customer satisfaction, and customer loyalty in the restaurant industry. A total of 279 cases from a survey were used to assess overall fit of the proposed model and test hypotheses using structural equation modeling. The three factors of the physical environ-ment strongly influenced how customers perceived price, and this price perception, in turn, enhanced customer satisfaction level and directly/indirectly influenced customer loyalty. Décor and artifacts were the most significant predictors of price perception among the three components of the physical environment. Furthermore, both price perception and customer satisfaction played significant partial/complete mediating roles in the proposed model. The paper provides potential ways for restaurateurs to increase customer loyalty by improving their understanding of the roles of physical environment, price perception, and customer satisfaction.
KEYWORDS: physical environment; price perception; customer satisfaction; cus-tomer loyalty; restaurant industry
The benefits of creating and maintaining customer loyalty among existing customers have been investigated in many fields. Researchers agree that firms reduce marketing costs and increase profits by enhancing customer loyalty (Bowen & Chen, 2001). Loyal customers are more likely than nonloyal custom-ers to engage in positive word-of-mouth (WOM) behaviors and spend extra money in a specific service operation (Ladhari, Brun, & Morales, 2008; Tepeci,
Authors’ Note: This study was supported by research fund of Dong-A University, Busan, Korea. Additionally, the authors thank Dr. John A. Williams at University of New Orleans for his comments from a marketing perspective.
by Kisang Ryu on October 14, 2009
http://jht.sagepub.com
1999; Yang & Peterson, 2004). In addition, loyal customers are less costly to serve because they know the product/service well and require less information (Reichheld & Sasser, 1990). Thus, in recent years, service providers have focused on achieving customer loyalty by delivering superior value and by iden-tifying and enhancing the important factors that determine loyalty (McDougall & Levesque, 2000; Parasuraman & Grewal, 2000; Yang & Peterson, 2004). These efforts are all based on the desire to retain customers longer, thereby increasing overall sales and profits.
First and foremost, customer loyalty depends largely on customer satisfaction (Fornell, Johnston, Anderson, Cha, & Bryant, 1996; Ladhari et al., 2008; McDougall & Levesque, 2000). Thus, a large body of research in services mar-keting has focused on identifying the factors that enhance customer satisfaction level. Research suggests that ultimately, customer satisfaction is strongly influ-enced by physical surroundings and price perception (Dube, Johnson, & Renaghan , 1999; Knutson & Patton, 1995; Ryu, 2005; Varki & Colgate, 2001). Unlike buyers of tangible products, service customers are limited to a small number of cues to evaluate their overall experience because of the intangible nature of service (Nguyen & Leblanc, 2002; Reimer & Kuehn, 2005). In many cases, price and the physical environment (e.g., décor and artifacts, spatial lay-out, and ambient conditions) are the only tangible cues available (Bitner, 1992; Zeithaml, 1981). Thus, from the service provider’s point of view, the physical environment and reasonable price are two essential elements that determine the level of customer satisfaction, and ultimately enhance customer loyalty (Bolton & Lemon, 1999; Nguyen & Leblanc, 2002; Reimer & Kuehn, 2005; Ryu & Jang, 2007; Varki & Colgate, 2001).
Despite indications that tangible physical environment, perceived price, and customer satisfaction are essential components in explaining the formation of customer loyalty, surprisingly little research in the service literature, particularly the restaurant sector, has examined the roles of these variables in forming cus-tomer loyalty. Additionally, to best of our knowledge, no empirical research has yet verified the relationships between multicomponents of the physical environ-ment (i.e., décor and artifacts, spatial layout, and ambient conditions) and price perception, and the possible influence of such relationships on customer satisfac-tion and customer loyalty in the service sector. Furthermore, the role of price perception in increasing the level of satisfaction and in forming loyalty still remains unclear both empirically and theoretically. Thus, the combined effect of the elements that make up customer loyalty in the restaurant industry should be empirically tested to create an overall conceptual model.
of the physical environment and assessed the mediating effect of customer sat-isfaction on the relationship between price perception and customer loyalty in the restaurant industry.
REVIEW OF THE LITERATURE
The Physical Environment
According to research in environmental psychology, human behavior is strongly associated with the physical environment (Mehrabian & Russel, 1974; Russel & Pratt, 1980). Specifically, Mehrabian and Russel’s (1974) theory indi-cated that individuals generally react to the environment in two opposite ways: approach and avoidance. Whereas approach behaviors can be seen as positive responses to the environment of a place (e.g., desire to stay, work, and affiliate), avoidance behaviors can be described as negative responses (e.g., a desire not to stay, work, and affiliate). Firms apparently want to enhance individual approach behaviors and decrease avoidance behaviors (Bitner, 1992). In recent years, the importance of the physical environment in influencing behaviors has been veri-fied in many consumer behavior studies (Reimer & Kuehn, 2005; Wakefield & Blodgett, 1996). Findings in these studies indicated that making the atmosphere more pleasant and innovative is essential for a firm’s success.
The role of the physical environment in influencing customer behaviors and in creating a provider’s image is especially pertinent in a service industry such as the restaurant industry (Booms & Bitner, 1982). Indeed, customers con-sciously (or unconcon-sciously) sense the physical surroundings before, during, and after the meal when dining out in a restaurant. While the food and the service must be of acceptable quality, pleasing physical surroundings, such as décor, artifacts, layout, and music may determine, to a large extent, the degree of over-all customer satisfaction and subsequent customer behavior. That is, customers may respond to more than just the quality of the food and service when evaluat-ing their experience and buildevaluat-ing their attitudes toward a provider. Kotler (1973) indicated that, in some situations, the atmosphere of the place can be as much important as the product itself (e.g., foods and services) in purchasing decision making. Creative use of physical design in a restaurant operation would be essen-tial in enhancing specific marketing objectives such as positive customer percep-tion of quality, positive evaluapercep-tion of experience, and positive attitudes.
In many theoretical and empirical studies, researchers have identified the essential factors of the physical environment, such as décor and artifacts, spatial layout, and ambient conditions that are particularly pertinent to the service industry (e.g., Nguyen & Leblanc, 2002; Raajpoot, 2002; Wakefield & Blodgett, 1999). These three factors have been frequently included in most research related to the physical environment and are the most adequate dimensions of the physical environment for customer behavior study in service settings (Nguyen & Leblanc, 2002; Raajpoot, 2002; Wakefield & Blodgett, 1999).
Décor and artifacts. Décor and artifacts contribute to the attractiveness of the physical environment (Wakefield & Blodgett, 1994). While customers remain inside a restaurant, they are likely to evaluate consciously and subconsciously the pleasant appearance of the interior designs of a restaurant as well as the quality of the materials used in construction, artwork, and decoration. Their evaluations of the attractiveness and overall aesthetic impression are influenced by various aspects of interior schemes as well as artifacts (Bitner, 1992). In a restaurant, the color schemes of the dining area’s walls, ceiling/wall decorations, pictures/ paintings, plants/flowers, tableware (e.g., glass and silverware), linens (e.g., table cloths and napkin), floor coverings, and quality furniture (e.g., dining table and chair) can all play an important part in delivering an image and in creating an overall aesthetic impression. In addition, from a customer’s viewpoint, these can be important environmental cues to evaluate their overall experience in an operation.
Spatial layout. The physical environment in service settings is the purposeful environment that exists to fulfill customers’ specific needs and wants, so effec-tive spatial layout of the physical surroundings is particularly important (Bitner, 1992). Spatial layout refers to the arrangement of objects, such as furniture and equipment, according to the needs of the service delivery process (Nguyen & Leblanc, 2002). Efficiency of layout in service settings facilitates the fulfillment of functional needs and affects the comfort of the customer (Wakefield & Blodgett, 1994). Spatial layout of the environment (e.g., table and seating arrangements) would be highly salient to customers in a restaurant where ample space is essential for moving around and sitting in comfort. An effective layout of the physical environment keeps restaurant customers from feeling crowded.
comfortable temperature, low noise level, and adequate lighting, all harmoniz-ing with other elements in a restaurant, may result in customers havharmoniz-ing more favorable perceptions of an operation and evaluating their experiences more positively.
Price Perception
Many studies in marketing suggest that the variability in product/service performance across different consumption experiences increases customer uncertainty. This uncertainty leads to decreased reliance on prior expectations of the product/service. In this situation, from the customer’s point of view, price is often used as a cue in their expectations of the product/service performance (Dodds, Monroe, & Grewal, 1991; Mattila & O’Neill, 2003). Furthermore, cus-tomers tend to use price as a cue in evaluating their experiences with a product/ service and in shaping their attitude toward a provider (Bolton & Lemon, 1999; Varki & Colgate, 2001). The role of the price in influencing customer behaviors would be more salient to the restaurant industry because customer experiences will not be identical; high human involvement while delivering services ensures differences in experience. This variability in restaurant services may foster the use of price as a cue of expectation, evaluation, and decision making.
Zeithaml (1988) defined price as “what is given up or sacrificed to obtain a product” (p. 10). Price is distinguished as objective price and perceived price (Jacoby & Olson, 1977). While objective price is the actual price of a product/ service, perceived price indicates the price as encoded by the customer (Jacoby & Olson, 1977). It is important to note that the objective price of a product/ service becomes meaningful to the customer after the customer’s subjective interpretation (Oh, 2000). A firm in a particular type of restaurant industry offers a wide variety of products/services, and the prices of these products vary widely. The complexity of such a pricing environment makes it inappropriate to use the objective price of a product in determining the role of price (Chen, Gupta, & Rom, 1994). Customers do not know/remember the actual price of a specific product/service, but they encode the price in ways that are meaningful to them (Zeithaml, 1983). Customer price perception rather than actual price, therefore, was used in this study.
Customer Satisfaction
satisfaction as “an evaluation that the chosen alternative is consistent with prior beliefs with respect to that alternative” (p. 501). These conceptualizations all suggest that customer satisfaction is an overall judgment process of the per-ceived discrepancy between prior expectation and actual consumption.
Customer Loyalty
Some researchers suggest that customer loyalty comprises both a behavioral dimension and an attitudinal dimension (Julander, Magi, Jonsson, & Lindqvist, 1997; Kandampully & Suhartanto, 2000). While the behavioral dimension con-siders consistent repeat patronage or repeat purchase frequency, the attitudinal dimension considers psychological (decision-making or evaluative) commit-ment toward the store/brand (Julander et al., 1997; Kandampully & Suhartanto, 2000). That is, loyalty is a consequence of consistent repeat patronage/repeat purchase frequency of a single store/brand as well as favorable attitude.
However, in recent years, many researchers have emphasized the overall disadvantage of including the behavioral dimension in assessing the level of customer loyalty (Back, 2005; Dick & Basu, 1994; Getty & Thompson, 1994; Tepeci, 1999). The behavioral dimension disregards decision-making processes, which do not differentiate brand loyalty from simple repeat purchasing behavior (Dick & Basu, 1994). That is, repeat purchases are not always the outcome of a psychological (decision-making or evaluative) commitment to the brand/store (Tepeci, 1999). Furthermore, measuring customer loyalty with the behavioral dimension included frequently involves improper multiplication of attitudinal and behavioral attributes (Back, 2005).
Especially in the hospitality industry, the attitudinal approach to assessing the level of customer loyalty should be more focused (Back, 2005; Schall, 2003). Unlike the manufactured (or consumer good) industry, repeat purchase frequ-ency would not be an adequate indicator of customer loyalty because loyalty in the hospitality field involves attitudinal and emotional commitment to a provider/brand (Schall, 2003). Many customers have multiple memberships in various branded restaurants or hotels (Mattila, 2001). Repeat purchases may not always indicate that the customer keeps on recommending or maintaining a favorable attitude toward the provider (Bowen & Chen, 2001). Accordingly, in this study, the attitudinal approach was used to assess restaurant customer loyalty by specifically gauging a particular range of potential behaviors triggered by overall experiences in a specific restaurant. Once a customer is deeply committed or has strong intentions to repurchase, recommend, and spend more, he/she is likely to remain loyal to a company (Getty & Thompson, 1994).
Research Hypotheses
emotionally/physiologically as well as cognitively (Bitner, 1992). In particular, a firm’s physical surroundings elicit emotional/physical responses as well as cog-nitive responses such as customer beliefs/perceptions (Bitner, 1992; Golledge, 1987). In a cognitive viewpoint, the physical environment is described as a form of nonverbal communication, which is also called object language (Rapoport, 1982). As an example, many environmental clues (e.g., type of office furniture, décor, artifacts, appearance of assistants and lawyer) in a lawyer’s office can deliver messages to clients (Bitner, 1992). That is, these environmental clues affect a potential client’s beliefs or perceptions about whether a lawyer’s service is reliable or unreliable, the price for the lawyer’s service is reasonable or unrea-sonable, and the lawyer is successful or unsuccessful (Bitner, 1992). It would be similar in the restaurant industry. Because customers in the restaurant industry pursue an entertaining or pleasurable atmosphere to enhance their dining experi-ence and their expectations about physical environments are high (Raajpoot, 2002; Ryu, 2005), various environmental cues in a restaurant could also affect customer cognitive beliefs. Thus, in a competitive market environment, restau-rant operators strive to create innovative and exciting designs that set them apart from the competition (Hamaker, 2000; Raajpoot, 2002). Indeed, the physical set-ting of a restaurant may enable customers to cognitively evaluate, categorize, and distinguish among similar types of restaurants (Bitner, 1992).
The logic underlying the relationship between the physical environment and perceived value also supports the link between physical environment and price perception. Various nonverbal cues in the physical environment (e.g., décor, furniture, layout, and ambience) communicate to a customer that the service offering’s nature and value, including service prices, are reasonable during an initial visit (Nguyen & Leblanc, 2002). In investigating business traveler behav-iors in luxury hotel settings, Mattila (1999) found that a hotel’s physical envi-ronment, including the guest room, is important to a customer’s value perception. This value is comparison/tradeoff between perceived quality/benefits in the product/service and the price paid (sacrifice) (Monroe, 1990). Accordingly, the significant relationship between physical surroundings and price perception can be inferred in that this value perception is highly associated with the perceived reasonableness of the price a customer pays to get the benefits (Oh, 2000).
Hypothesis 1: Décor and artifacts have a positive effect on price perception. Hypothesis 2: Spatial layout has a positive effect on price perception. Hypothesis 3: Ambient conditions have a positive effect on price perception.
Many previous empirical studies have shown how the physical environ-ment influences customer satisfaction and predicts postpurchase behaviors (Hui et al., 1997; Knutson & Patton, 1995; Mattila & Wirtz, 2001; Wakefield & Blodgett, 1994). In examining customer behaviors in the restaurant industry, Knutson and Patton (1995) found five essential components of service quality and stressed the importance of physical surroundings, such as décor and arti-facts, in influencing customer satisfaction and postpurchase behavior. Dube et al. (1999) found that quality of service involving physical surroundings such as guest room design/cleanliness correlated highly with guest satisfaction in the hotel industry. Wakefield and Blodgett’s (1994) findings suggested that service/ retail facilities, specifically designed to add some level of excitement or arousal to the service experience, as in an upscale/family restaurant, should provide ample space to facilitate exploration and stimulation within physical surround-ings. This effective layout induces a positive customer evaluation of overall consumption experiences. Hui et al. (1997) noted that creating favorable ambi-ence such as playing music in the (service) environment is like adding a favor-able feature to a product (or service), and the likely outcome is a more positive evaluation of the environment. Mattila and Wirtz (2001) investigated the main effect of matching ambient stimuli on consumer behaviors in retail settings. Their findings indicated that the matching ambient stimuli, specifically when ambient scent and music are congruent in quality, led to high evaluations of the store environment, high satisfaction level, and favorable behavioral responses.
Services often deliver benefits that are intangible and difficult to predict/ assess before actual purchase/consumption. For example, some restaurant ser-vices (e.g., food quality) cannot be anticipated and judged until those elements have been experienced. Thus, restaurant customers try to overcome their uncer-tainty by seeking and selecting one or more indicators (cues/stimuli) to help them predict and evaluate the overall dining experience. Innovative and exciting physical designs may provide important clues for predicting and positively evaluating their dining experiences in a restaurant.
Hypothesis 4: Décor and artifacts have a positive effect on customer satisfaction. Hypothesis 5: Spatial layout has a positive effect on customer satisfaction. Hypothesis 6: Ambient conditions have a positive effect on customer satisfaction.
services. Price perceptions were evaluated as fair or unfair. Their findings indi-cated that customer perceptions of price fairness/unfairness (payment equity) significantly affected their overall satisfaction and behavioral intentions in both industries. Using empirical data from the banking industry in New Zealand and the United States, Varki and Colgate (2001) tested the role of price perception in explaining customer postpurchase behaviors. Their findings indicated that whereas price perception measured on an absolute scale was not a significant predictor of satisfaction and behavioral intentions for the U.S. sample, price perception assessed on a comparative basis was significantly associated with customer satisfaction, likelihood of doing more business, and recommending the bank for the New Zealand sample. Customer feelings about the reasonableness of price may capture evaluated price perception (Martins & Monroe, 1994). According to Sirohi, McLaughlin, & Wittink (1998), this affects customer loy-alty. Moreover, price perception may be a way to enhance a firm’s profit level as well as a customer’s level of satisfaction, and increasing the perception that price is reasonable is also highly associated with both customer retention and firm success (Ranaweera & Neely, 2003). Hence, based on these theoretical and empirical supports, it can be inferred that price perception is a significant driver of customer satisfaction and loyalty in the restaurant industry.
Hypothesis 7: Price perception has a positive effect on customer satisfaction. Hypothesis 8: Price perception has a positive effect on customer loyalty.
Many researchers have provided empirical evidence of a positive relation-ship between customer satisfaction and loyalty (Cronin & Taylor, 1992; Fornell et al., 1996). Fornell et al.’s (1996) findings indicated that enhancing satisfac-tion level contributed to building customer loyalty in terms of repurchase likeli-hood and price tolerance given repurchase. Cronin and Taylor’s (1992) findings revealed that satisfaction is a critical determinant of positive behavioral inten-tions in various service sectors (e.g., fast food, banking, and dry cleaning). Whereas the possible outcomes, when dissatisfied consumers have the ability (or motivation) to act, are to complain to the provider, to switch to another pro-vider, and to spread negative WOM, satisfied customers are likely to remain loyal to the provider by engaging in positive WOM behaviors, by repatronizing the service/product, by spreading positive WOM, and by spending more (Fornell et al., 1996; McDougall & Levesque, 2000). Although using satisfac-tion is not the only strategy, a fundamental way to improve customer loyalty is to enhance customer satisfaction levels. Thus, a major component in any cus-tomer loyalty program in the restaurant industry is satisfaction.
Hypothesis 9: Customer satisfaction has a positive effect on customer loyalty.
METHOD
Measurements
The study constructs were all measured with multiple items closely follow-ing previous studies (Bitner, 1992; Garbarino & Johnson, 1999; Mehrabian & Russel, 1974; Nguyen & Leblanc, 2002; Oh, 2000; Wakefield & Blodgett, 1996; Zeithaml, Berry, & Parasuraman, 1996). Three components of the physical environment were measured with 17 items using a 7-point Likert-type scale. Specifically, décor and artifacts were assessed using 8 items (i.e., paintings/ pictures, plants/flowers, ceiling décor, wall décor, colors, quality of furniture, quality of floor, and the linens/tableware), spatial layout was assessed using 3 items (i.e., overall layout, table/seating arrangements, and seating comfort), and ambient conditions were assessed using 6 items (i.e., lighting, background music, air quality, temperature, aroma, noise level). Price perception was measured with two items using a 7-point Likert-type scale (e.g., “The price at this restaurant is reasonable”). A 7-point Likert-type scale with three items was used to measure customer satisfaction (e.g., “Overall, I am satisfied with this restaurant”). Finally, customer loyalty was assessed using a 7-point Likert-type scale with three items (e.g., “I would like to come back to this restaurant in the future”).
Data Collection
A field survey approach was used in this study. The data were collected from customers at three full-service restaurants, which offer acceptable ambience in northwestern and southeastern states in the United States. A convenience sam-pling approach was used. A total of 475 questionnaires were distributed to res-taurant customers. After deleting incomplete responses, 279 cases were coded for data analysis, representing an effective response rate of 58.74%. Among 279
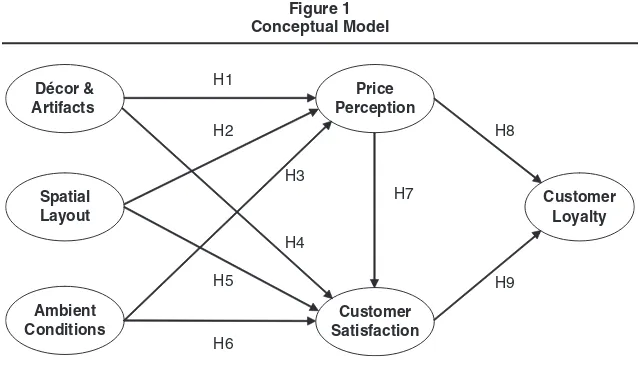
Figure 1 Conceptual Model
Décor & Artifacts
Ambient Conditions
Customer Satisfaction
Customer Loyalty Spatial
Layout
Price Perception
H1
H2
H3
H4
H6 H5
H8
responses, male customers represented 40.6%; female respondents represented 59.4%. Approximately 39.8% were younger than 30 years of age, 34.6% were between the ages of 31 and 50 years, and 25.6% were older than 51 years. Their average age was 38.61 years.
Analysis
The collected data were analyzed using SPSS for Window 11.0 and AMOS 5. Following the procedure suggested by Anderson and Gerbing (1988), a measure-ment model was estimated before the structural model. A confirmatory factor analysis (CFA) was used to assess the measurement model and to test data qual-ity, including reliability and construct validity checks. structural equation model-ing (SEM) was conducted to assess overall fit of the proposed model and test hypotheses. The partial/full mediating roles of price perception and customer satisfaction were investigated through modeling comparisons following the pro-cedure suggested by Baron and Kenny (1986).
RESULTS
Item Purification and Measurement Model
Prior to analysis, the data were screened to ascertain if there were any viola-tions of the assumpviola-tions underlying the general linear model. Results of evalu-ation of assumptions using univariate tests of normality led to transformevalu-ation of the variables to reduce skewness. Because all variables showed significant negative skewness, a square root transformation was used on these variables. Tests for multivariate outliers revealed four significant cases, Mahalanobis’s
D(25) > 52.62, p< .001. These cases were excluded from further analyses, leav-ing a final sample of 275 cases. Examination of residual scatterplots and normal-probability plots did not reveal any further violations of normality, linearity, or homoskedasticity.
To refine all measures for the structural model, a measurement model was estimated using the maximum likelihood estimation method. The initial 25 items developed for measurement were subjected to a CFA. Based on the results of the CFA, four items were deleted because of low factor loadings and low squared multiple correlations. Specifically, a total of 2 items of décor and arti-facts (i.e., “Flooring is of high quality” and “The linens and tableware are attrac-tive”) and 2 items of ambient conditions (i.e., “Air quality is good” and “Noise level is unpleasant”) were removed. The results of CFA on the remaining 21 items showed an excellent fit to the data (χ2= 360.88, df= 174, p< .001, χ2/df=
2.074, root mean square error of approximation [RMSEA] = 0.063, comparative fit index [CFI] = 0.991, normed fit index [NFI] = 0.982), and the measurement model fit was significantly improved (∆χ2 = 311.42, ∆df = 86, p < .001).
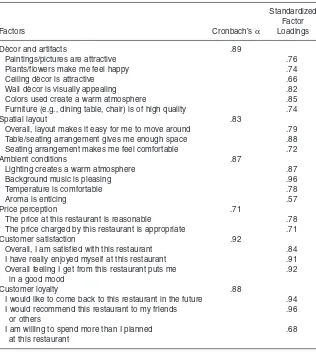
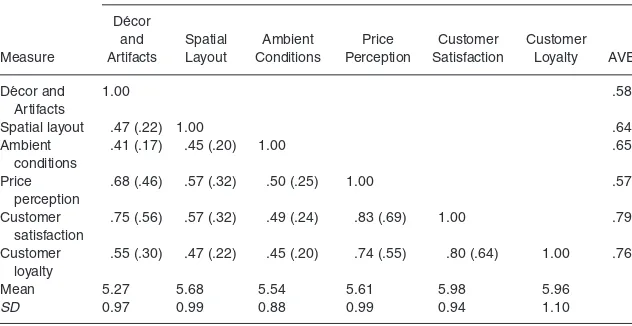
Cronbach’s alpha estimates were between .71 and .92, multiple measures in this study are reliable for assessing each construct (Nunnally, 1978). A construct validity test was conducted using the factor loadings within the constructs, aver-age variance extracted (AVE), and the correlation between constructs. As shown in Table 1, all standardized factor loadings emerged fairly high, ranging from .57 to .96. This showed that the measurement had convergent validity (Anderson & Gerbing, 1988). As shown in Table 2, convergent validity was also indicated because all AVE values exceeded Hair, Anderson, Tatham, and Black’s (1998) suggested cutoff of .50. Fornell and Larcker (1981) indicated that discriminant validity exists when the proportion of variance extracted in each construct exceeds the square of the coefficient representing its correlation with other con-structs. All AVE values were greater than the squared correlations between constructs, indicating adequate discriminant validity.
Table 1
Standardized Confirmatory Factor Loadings
Standardized
Factor
Factors Cronbach’s α Loadings
Décor and artifacts .89
Paintings/pictures are attractive .76
Plants/flowers make me feel happy .74
Ceiling décor is attractive .66
Wall décor is visually appealing .82
Colors used create a warm atmosphere .85
Furniture (e.g., dining table, chair) is of high quality .74
Spatial layout .83
Overall, layout makes it easy for me to move around .79 Table/seating arrangement gives me enough space .88 Seating arrangement makes me feel comfortable .72
Ambient conditions .87
Lighting creates a warm atmosphere .87
Background music is pleasing .96
Temperature is comfortable .78
Aroma is enticing .57
Price perception .71
The price at this restaurant is reasonable .78 The price charged by this restaurant is appropriate .71
Customer satisfaction .92
Overall, I am satisfied with this restaurant .84 I have really enjoyed myself at this restaurant .91 Overall feeling I get from this restaurant puts me .92 in a good mood
Customer loyalty .88
I would like to come back to this restaurant in the future .94 I would recommend this restaurant to my friends .96 or others
Structural Model Comparisons
Structural equation modeling to assess the proposed conceptual model was conducted using the maximum likelihood estimation method. Chi-square value of the model (χ2=
486.62, df= 180, p< .001) and other goodness of fit indices (RMSEA = 0.079; CFI = 0.985; NFI = 0.976) revealed that the model fit the data reasonably well. This proposed structural model was then compared with the alternative model. Recent research in several fields supports the direct relation-ship between the physical environment and customer postpurchase behavior (Knutson & Patton, 1995; Wakefield & Blodgett, 1994, 1996). Thus, in the comparison model, the direct effects of three components of the physical envi-ronment on customer loyalty were considered by adding the three paths from décor and artifacts, spatial layout, and ambient conditions on customer loyalty. The results showed that the chi-square value was 480.91 (df= 177, p< .001), the CFI was .985, NFI was .976, and RMSEA was .079. In comparing this model with the hypothesized structural model, no significant differences appeared (∆χ2=
5.71, ∆df= 3, p> .05). That is, adding the direct paths from the three components of physical environments to customer loyalty did not signifi-cantly improve the model fit. In addition, whereas the indirect effects of décor and artifacts (βDA-PP/CS-CL= .49, t= 9.10, p< .01), spatial layout (βSL-PP/CS-CL= .23,
t= 5.41, p< .01), and ambient conditions (βAC-PP/CS-CL= .19, t= 4.71, p< .01) on
customer loyalty in the proposed model were all significant, the added paths in the comparison model were all insignificant at the level of .05. Thus, the origi-nal model was kept for further aorigi-nalyses.
Table 2
Measure Correlations, the Squared Correlations, and Average Variance Extracted (AVE)
Correlations Between Latent Constructs (Squared)a
Décor
and Spatial Ambient Price Customer Customer Measure Artifacts Layout Conditions Perception Satisfaction Loyalty AVE
Décor and 1.00 .58
Artifacts
Spatial layout .47 (.22) 1.00 .64 Ambient .41 (.17) .45 (.20) 1.00 .65 conditions
Price .68 (.46) .57 (.32) .50 (.25) 1.00 .57 perception
Customer .75 (.56) .57 (.32) .49 (.24) .83 (.69) 1.00 .79 satisfaction
Customer .55 (.30) .47 (.22) .45 (.20) .74 (.55) .80 (.64) 1.00 .76 loyalty
Mean 5.27 5.68 5.54 5.61 5.98 5.96
SD 0.97 0.99 0.88 0.99 0.94 1.10
a. Correlation coefficients are estimates from AMOS 5. All were significant at .01 level. Model measure-ment fit: χ2= 360.88 (df= 174, p< .001), root mean square error of approximation [RMSEA] = 0.063,
Empirical Testing of Hypothesized Paths
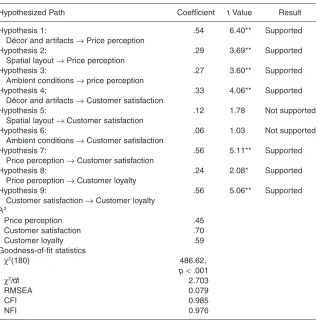
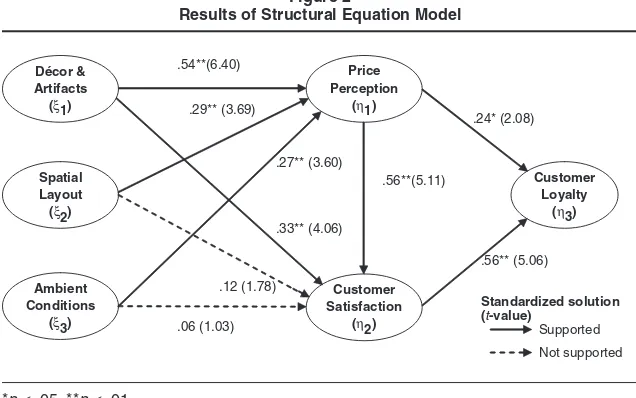
Hypotheses were tested based on the proposed structural model. The fit of the model indicated that the conceptual model is parsimonious and fits well (see Table 3), so it provides a good basis for testing the hypothesized paths. The parameter estimates were assessed using the maximum likelihood estimation. Figure 2 presents standardized path coefficients and t values for the proposed conceptual model.
Hypotheses 1, 2, and 3 were supported, indicating customer price perception was a positive function of the physical environment. The relationships between each component of the physical environment and price perception were all sig-nificant (Hypothesis 1, γ11= .54, t= 6.40, p< .01; Hypothesis 2, γ12= .29, t= 3.69,
p< .01; Hypothesis 3, γ13= .27, t= 3.60, p< .01). The three components of the
Table 3
Structural Parameter Estimates
Hypothesized Path Coefficient t Value Result
Hypothesis 1: .54 6.40** Supported
Décor and artifacts → Price perception
Hypothesis 2: .29 3.69** Supported
Spatial layout → Price perception
Hypothesis 3: .27 3.60** Supported
Ambient conditions → price perception
Hypothesis 4: .33 4.06** Supported
Décor and artifacts → Customer satisfaction
Hypothesis 5: .12 1.78 Not supported
Spatial layout → Customer satisfaction
Hypothesis 6: .06 1.03 Not supported
Ambient conditions → Customer satisfaction
Hypothesis 7: .56 5.11** Supported
Price perception → Customer satisfaction
Hypothesis 8: .24 2.08* Supported
Price perception → Customer loyalty
Hypothesis 9: .56 5.06** Supported
Customer satisfaction → Customer loyalty
R2
Price perception .45
Customer satisfaction .70
Customer loyalty .59
Goodness-of-fit statistics
χ2(180) 486.62,
p< .001
χ2/df 2.703
RMSEA 0.079
CFI 0.985
NFI 0.976
Note: RMSEA = root mean square error of approximation; CFI = comparative fit index; NFI = normed fit index.
physical environments accounted for 45% of variance in price perception. The findings suggest that a restaurant firm should carefully design the physical envi-ronment to improve the customer’s perceived reasonableness of the price.
Simply comparing the standardized correlation coefficients and t values is not enough to verify statistical difference between strengths of paths. Thus, the Fisher test was conducted to decide whether standardized coefficients (γ11,γ12, and γ13) have statistically different strengths. This test is an intensive way to compare paths in terms of strength. Two standardized correlation coefficients among three were compared using Fisher’s Z transformation in sequence. The results indicated that the path from décor and artifacts to price perception had a significantly different strength from the other two paths (p< .001). Moreover, the correlation coefficient and t value of this variable (γ11= .54, t= 6.40) were greater than the others (γ12 = .29, t = 3.69; γ13= .27, t= 3.60). Thus, we can conclude that décor and artifacts was the most significant predictor of price perception among the three components of the physical environment. Two cor-relation coefficients (spatial layout → price perception vs. ambient condition → price perception) showed no significant differences in strength (p> .05).
Décor and artifacts had a significant positive effect on customer satisfaction (Hypothesis 4, γ21= .33, t= 4.06, p< .01), supporting Hypothesis 4. However, spatial layout and ambient conditions had no significant direct effects on customer satisfaction (Hypothesis 5, γ22= .12, t= 1.78, p> .05; Hypothesis 6 γ23= .06, t=
indicated that customer satisfaction level increases when price is considered rea-sonable. The three components of physical environments and price perception explained 70% of the variance in customer satisfaction.
Finally, the direct effect of price perception and customer satisfaction on customer loyalty was statistically significant (Hypothesis 8, β31= .24, t= 2.08,
p< .05; Hypothesis 9, β32= .56, t= 5.06, p< .01), supporting Hypotheses 8 and
9. This result was consistent with previous findings that price perception and satisfaction are significant predictors of customer loyalty (Bolton & Lemon, 1999; Ranaweera & Neely, 2003; Varki & Colgate, 2001). Both price perception and satisfaction accounted for 59% of the total variance of customer loyalty.
Mediation Analysis
Further analysis tested the mediating role of price perception between cus-tomer satisfaction and the three components of physical environment. The proposed model was reestimated by constraining the direct effect of price per-ception on customer satisfaction (set to zero). In comparing this constrained model (χ2= 529.84, df= 181, p< .001) to the original model (χ2= 486.62, df=
180, p< .001), chi-square differed significantly (∆χ2= 43.22, ∆df= 1, p< .001),
thus indicating the proposed model (mediating model) fit was significantly bet-ter. In particular, the mediating role of price perception between décor and arti-facts and customer satisfaction was investigated. In the mediating model, γ11, β21,
and γ21 were significant; thus the proposed model met Baron and Kenny’s (1986)
first three conditions for testing mediation. Their next condition would be satis-fied if the parameter estimate between décor and artifacts and customer satisfac-tion in the mediating model is less strong (partial mediasatisfac-tion) or insignificant (full mediation) compared with the parameter estimate in the constrained model. Because the direct path from décor and artifacts to satisfaction in the mediating model is less strong (γ21= .33, t= 4.06, p< .01) than the path in the constrained
model (γ21 = .65, t = 8.96, p< .01), price perception was a partial mediator.
Furthermore, the mediating role of price perception between spatial layout/ambient conditions and satisfaction was tested. The direct paths from spatial layout/ ambient conditions to satisfaction were not significant (γ22= .12, t= 1.78, p> .05; γ23= .06, t= 1.03, p> .05; Hypotheses 5 and 6), and the other two essential
con-ditions were met in the mediating model (Baron & Kenny, 1986). Because the paths from spatial layout/ambient conditions to satisfaction were significant in the constrained model (γ22= .29, t= 4.75, p< .01; γ23= .21, t= 3.76, p< .01),
price perception can be regarded as a full mediator in the relationships between spatial layout/ambient conditions and customer satisfaction.
In the same way, when testing the mediating role of customer satisfaction, the mediating model was re-estimated by setting the direct effect of price perception on customer loyalty to zero (χ2= 496.67, df= 181, p< .001). Because β
21, β32,
and β31were significant, Baron and Kenny’s (1986) first three conditions were
met. The direct path in the constrained model was stronger (β31= .80, t= 12.30,
p< .01) than the path in the mediating model (β31= .24, t= 2.08, p< .05). In
model (∆χ2= 10.05, ∆df= 1, p< .01). Thus customer satisfaction did indeed act
as a partial mediator in the relationship between price perception and loyalty. This finding implies that price perception has both direct and indirect effects on customer loyalty.
DISCUSSION AND IMPLICATIONS
Our research has provided empirical evidence of the development of cus-tomer loyalty in the restaurant industry through the physical environment, price perception, and customer satisfaction. A total of nine hypotheses were devel-oped and tested using structural equation modeling. Of the nine hypotheses, seven were upheld (Hypotheses 1, 2, 3, 4, 7, 8, and 9). However, two of them were not supported because price perception completely mediated the effects of spatial layout and ambient conditions on customer satisfaction (Hypotheses 5 and 6). In particular, décor and artifacts, spatial layout, and ambient conditions had a significant effect on price perception. Whereas décor and artifacts sig-nificantly influenced customer satisfaction itself, spatial layout and ambient conditions did not have a direct effect on satisfaction. Price perception proved to be an important predictor of satisfaction, directly/indirectly influencing cus-tomer loyalty.
This study extends and moves beyond the previous research in several ways. First, the current study examined the formation of customer loyalty by adopting a multidimensional view of the physical environment and by integrat-ing price perception. Although a number of studies have examined the role of the physical environment and price perception in explaining consumer behav-iors (Hamaker, 2000; Kim, Lee, & Yoo, 2006; Oh, 2000; Varki & Colgate, 2001; Wakefield & Blodgett, 1996), consumer research has neither verified the physi-cal environment–price perception relationship nor explored the possible influ-ence of such relationship on subsequent consumer behaviors. The findings emphasize the importance of the physical environment, price perception, and customer satisfaction in understanding how customer loyalty develops. For researchers, the demonstrated relationships between such variables offer insight into how customers develop their intentions to revisit, recommend, and spend more than they planned. Thus, researchers in the restaurant industry should incorporate such constructs into loyalty studies (e.g., loyalty theory building).
whether the physical environment influences outcome variables directly or indi-rectly. According to Bitner’s (1992) conceptual framework, customers in a spe-cific service firm cognitively, emotionally, and physiologically respond to their physical surroundings. That is, the perceived quality of the physical surround-ings indirectly causes customers to behave in certain ways because of their internal responses. Consistent with Bitner’s (1992) theoretical framework, our results revealed that all components of the physical environment indirectly influenced customer approach behavior, which is congruent with aspects of customer loyalty in this study, through customer cognitive response (i.e., price perception) and satisfaction. Thus, in this study, the indirect effect of the physi-cal environment on outcome variables was evident in a restaurant setting. This result goes beyond the previous research that has mainly focused on the direct influence of the physical environment on outcome variables.
Third, only a few research studies have considered the different levels of importance among the components of the physical environment in predicting outcome variables. In addition, unlike much prior research that has tended to use standardized coefficients or t values to compare the strengths of regression paths, the current study employed the Fisher test to identify the difference in terms of strengths of paths. The importance of the décor and artifacts was sta-tistically verified through this intensive way. The results from the current study suggest that research in other segments of the restaurant industry should also examine the different level of importance among the dimensions of the physical environment. For example, spatial layout would be more important than other components in the quick-service/quick-casual restaurant segments because cus-tomers in such segments tend to value convenience.
Managerial Implications
The results of the current study also have implications for restaurant marketers and managers. First, price perception simultaneously influenced customer satis-faction and customer loyalty. Therefore, restaurateurs must provide customers with reasonableness of perceived price. One management approach is to offer high or, at least, appropriate quality of physical environment to customers, as indicated by the findings in this study. In addition, restaurateurs might control the perception of price by successful menu pricing. Consumer perception of price reasonableness in a restaurant primarily depends on menu price. Customers are not willing to revisit a restaurant when they believe that the prices on the menu are unreasonably high (Kim et al., 2006). Thus, providing pleasing and innovative atmosphere and high quality of service/food to restaurant customers is necessary to improve price perception.
therefore, should allocate resources primarily for fascinating décor and artifacts of the physical dining environment. For ambience and spatial layout, manage-ment can control the physical elemanage-ments representing ambience (e.g., background music, light, aroma, temperature) and spatial layout (e.g., seating arrangement) with little expense. For example, restaurateurs can easily control background music, varying its volume (loud to soft), genre (classical or jazz), and tempo (fast to slow) based on customer preferences. Restaurateurs should carefully consider such physical elements related to ambience as a marketing and opera-tional tool to induce positive cognitive reactions and to improve customer experi-ences with their restaurants.
Finally, as previously discussed, both price perception and customer satis-faction were important mediating variables in the conceptual model, and both price perception and customer satisfaction showed high effect on customer loyalty. In particular, price perception was a mediating variable between cus-tomer satisfaction and the three components of physical environment. Price perception fully mediated the effect of spatial layout and ambient conditions and partially mediated the effect of décor and artifacts on customer satisfaction judgment. This indicated that the effect of physical environment on customers’ evaluation of their experiences is maximized when they perceive the price paid for services is appropriate. Little research has been done on the verification of the mediating role of price perception. This finding suggested that price per-ception could be a useful concept to both researchers and restaurant marketers whose primary strategies focus on creating pleasant or exciting physical sur-roundings and thus increasing customer satisfaction to build customer loyalty. Furthermore, customer satisfaction appears to be a partial mediator in the relationship between price perception and customer loyalty. This finding sup-ports the results of the previous study that customer satisfaction is an impor-tant summary of customer decision-making processes (Mooradian & Olver, 1997). Customers may perceive that the price is reasonable at a specific restau-rant, and they may positively evaluate their experience with the restaurant. However, they may still not hold strong behavioral intentions unless they are satisfied with their experience at the restaurant. Overall, to maximize the posi-tive impact of price perception on customer loyalty, restaurateurs should enhance customer satisfaction levels.
Limitations and Future Research
also conducted as another research approach to examine the effect of multicom-ponents of the physical environment in the future study.
The total number of samples used for the data analysis in the present study (275 cases) was greater than the absolute minimum sample size, which exceeds the number of correlations/covariances in the input data matrix, and greater than Hair et al.’s (1998) recommended size ranging from 200 to 400 when using SEM with the maximum likelihood estimation method. However, Hair et al. (1998) argued that a minimum ratio of five cases for each estimated parameter is more typically considered to be adequate. Considering the number of esti-mated parameter in this study (72), the sample size was relatively small. Thus, increasing sample size is recommended for future study to more appropriately estimate the study model.
This study focuses only on the relationships between physical environment, price, customer satisfaction, and loyalty. The proposed model can be extended to include social interaction theory and various customer internal responses. Research indicates that all social interactions such as customer and employee interactions and relationship formation in interpersonal services are highly affected by environmental conditions (Bennett & Bennett, 1970; Bitner, 1992). In addition, customers’ perceived physical environment elicits emotional and physi-ological responses, and a cognitive response to physical surroundings may also influence emotional and physiological responses (Wakefield & Blodgett, 1994). For example, according to a stimulus–organism–response paradigm (Mehrabian & Russel, 1974), the environment creates an emotional response in individuals, which in turn elicits either approach or avoidance behavior. Thus, for future study, including the social interaction theory and various internal responses in the proposed model may enrich a marketer’s understanding of how customer loyalty develops in the restaurant industry.
The moderating roles of personal and situational factors in forming customer loyalty were not considered in the present study. Many researchers of consumer behavior have indicated that, in all behavioral relationships, the strength of the relationship between variables is influenced by personal characteristics (e.g., individual personality traits, gender, ethnic background, income, and education) and situational characteristics (e.g., an individual’s plan or purpose for being in the environment; Evanschitzky & Wunderlich, 2006; Mehrabian & Russel, 1974). Hence, for future study, examining the potential effects of personal and situational factors would provide additional insight into the relationships among study constructs and would make an interesting extension of this study.
REFERENCES
Anderson, J. C., & Gerbing, D. W. (1988). Structural equation modeling in practice: A review and recommended two-step approach. Psychological Bulletin, 103, 411-423. Back, K. J. (2005). The effects of image congruence on customers’ brand loyalty in the
Baker, J. (1987). The role of the environment in marketing services. In J. A. Czepeial, C. A. Congram, & J. Shanahan (Eds.). The services challenges: Integrating for com-petitive advantage (pp. 79-84). Chicago: American Marketing Association.
Baron, R. M., & Kenny, D. A. (1986). The moderator-mediator variable distinction in social psychological research: Conceptual, strategic, and statistical considerations. Journal of Personality and Social Psychology, 51, 1173-1182.
Bennett, D. J., & Bennett, J. D. (1970). Making the scene. In G. Stone & H. Farberman (Eds.), Social psychology through symbolic interactionism (pp. 190-196). Waltham, MA: Ginn-Blaisdell.
Bitner, M. J. (1992). Servicescapes: The impact of physical surroundings on customers and employees. Journal of Marketing, 56(2), 57-71.
Bolton, R. N., & Lemon, K. N. (1999). A dynamic model of customers’ usage of services: Usage as an antecedent and consequence of satisfaction. Journal of Marketing Research, 36, 171-186.
Booms, B. H., & Bitner, M. J. (1982). Marketing services by managing the environment. Cornell Hotel and Restaurant Administration Quarterly, 23(May), 35-39.
Bowen, J. T., & Chen, S. (2001). The relationship between customer loyalty and cus-tomer satisfaction. International Journal of Contemporary Hospitality Management, 13, 213-217.
Chen, L. J., Gupta, A., & Rom, W. (1994). A study of price and quality in service opera-tions. International Journal of Service Industry Management, 5(2), 23-34.
Cronin, J. J., Jr., & Taylor, S. A. (1992). Measuring service quality: A reexaminantion and extension. Journal of Marketing, 56(3), 55-68.
Dick, A. S., & Basu, K. (1994). Customer loyalty: Toward an integrated conceptual framework. Journal of the Academy of Marketing Science, 22, 99-113.
Dodds, W. B., Monroe, K. B., & Grewal, D. (1991). Effects of price, brand, and store infor-mation on buyers’ product evaluations. Journal of Marketing Research, 28, 307-319. Dube, L., Johnson, M. D., & Renaghan, L. M. (1999). Adapting the QFD approach to
extended service transactions. Production and Operations Management, 8, 301-317. Engel, J. F., & Blackwell, R. D. (1982). Consumer behavior. New York: Dryden Press. Evanschitzky, H., & Wunderlich, M. (2006). An examination of moderator effects: The
four stage loyalty model. Journal of Service Research, 8, 330-345.
Fornell, C., Johnston, M. D., Anderson, E., Cha, J., & Bryant, B. E. (1996). The American customer satisfaction index: Nature, purpose, and findings. Journal of Marketing, 60, 7-18.
Fornell, C., & Larcker, D. F. (1981). Evaluating structural equation models with unobserv-able variunobserv-ables and measurement error. Journal of Marketing Research, 18(1), 39-50. Garbarino, E., & Johnson, M. S. (1999). The different roles of satisfaction, trust, and
commitment in customer relationships. Journal of Marketing, 63, 70-87.
Getty, J. M., & Thompson, K. N. (1994). The relationship between quality, satisfaction, and recommending behaviour in lodging decision. Journal of Hospitality & Leisure Marketing, 2(3), 3-22.
Golledge, R. G. (1987). Environmental cognition. In S. Daniel & A. Irwin (Eds.), Environmental psychology (pp. 131-174). New York: Wiley.
Hair, J. F., Anderson, R. E., Tatham, R. L., & Black, W. C. (1998). Multivariate data analysis (8th ed.). Upper Saddle River, NJ: Prentice Hall.
Hui, M. K., Dube, L., & Chebat, J. (1997). The impact of music on consumer’s reaction to waiting for services. Journal of Retailing, 73, 87-104.
Hunt, H. K. (1977). CS/D-overview and future research directions. In K. H. Hunt (Ed.), Conceptualization and measurement of consumer satisfaction and dissatisfaction (pp. 455-488). Cambridge, MA: Marketing Science Institute.
Jacoby, J., & Olson, J. C. (1977). Consumer response to price: An attitudinal, informa-tion processing perspective. In Y. Wind & P. Greenberg (Eds.), Moving ahead with attitude research (pp. 73-86). Chicago: American Marketing Association.
Julander, C., Magi, A., Jonsson, J., & Lindqvist, A. (1997). Linking customer satisfac-tion to financial performance data. In B. Edvardsson, S. W. Brown, R. Johnston, & E. E. Scheuing (Eds.), Advancing service quality: A global perspective (pp. 301-310). Karlstad, Sweden: University of Karlstad.
Kandampully, J., & Suhartanto, D. (2000). Customer loyalty in the hotel industry: The role of customer satisfaction and image. International Journal of Contemporary Hospitality Management, 12, 346-351.
Kim, W., Lee, Y., & Yoo, Y. (2006), Predictors of relationship quality and relationship out-comes in luxury restaurants. Journal of Hospitality & Tourism Research, 30, 143-169. Knutson, B. J., & Patton, M. E. (1995). Restaurants can find gold among silver hair:
Opportunities in the 55+ market. Journal of Hospitality & Leisure Marketing, 1(3), 79-90.
Kotler, P. (1973). Atmospherics as a marketing tool. Journal of Retailing, 49(4), 48-64. Ladhari, R., Brun, I., & Morales, M. (2008). Determinants of dining satisfaction and
post-dining behavioral intentions. International Journal of Hospitality Management, 27, 563-573.
Martins, M., & Monroe, K. B. (1994). Perceived price fairness: A new look at an old con-struct. In C. Allen & D. R. John (Eds.), Advances in Consumer Research (pp. 75-78). Provo, UT: Association for Consumer Research.
Mattila, A. S. (1999). Consumers’ value judgments. Cornell Hotel and Restaurant Administration Quarterly, 40(1), 40-46.
Mattila, A. S. (2001). Emotional bonding and restaurant loyalty. Cornell Hotel and Restaurant Administration Quarterly, 42(6), 73-79.
Mattila, A. S., & O’Neill, J. W. (2003). Relationships between hotel room pricing, occu-pancy, and guest satisfaction: A longitudinal case of a midscale hotel in the United States. Journal of Hospitality & Tourism Research, 27, 328-341.
Mattila, A. S., & Wirtz, J. (2001). Congruency of scent and music as a driver of in-store evaluations and behavior. Journal of Retailing, 77, 273-289.
McDougall, G., & Levesque, T. (2000). Customer satisfaction and future intentions: The role of perceived value and service quality. Journal of Services Marketing, 14, 392-410. Mehrabian, A., & Russel, J. A. (1974). An approach to environmental psychology.
Cambridge: MIT Press.
Menon, S., & Kahn, B. (2002). Cross-category effects of induced arousal and pleasure on the Internet shopping experience. Journal of Retailing, 78, 12-31.
Monroe, K. B. (1990). Pricing: Making profitable decisions (2nd ed.). New York: McGraw-Hill.
Mooradian, T. A., & Olver, J. M. (1997). I can’t get no satisfaction: The impact of person-ality and emotion on postpurchase processes. Psychology & Marketing, 14, 379-392. Nguyen, N., & Leblanc, G. (2002). Contact personnel, physical environment and the
Nunnally, J. C. (1978). Psychometric theory. New York: McGraw-Hill.
Oh, H. (2000). The effect of brand class, brand awareness, and price on customer value and behavioral intentions. Journal of Hospitality & Tourism Research, 24, 136-162.
Parasuraman, A., & Grewal, D. (2000). The impact of technology on the quality-value-loyalty chain: A research agenda. Journal of Academic of Marketing Science, 28, 168-174.
Raajpoot, N. (2002). TANGSERV: a multiple item scale for measuring tangible quality in foodservice industry. Journal of Foodservice Business Research, 5, 109-127. Ranaweera, C., & Neely, A. (2003). Some moderating effects on the service
quality-customer retention link. International Journal of Operations & Production Man-agement, 23, 230-248.
Rapoport, A. (1982). The meaning of the built environment. Beverly Hills, CA: Sage. Reichheld, F. F., & Sasser, W. E. (1990). Zero defections: Quality comes to services.
Harvard Business Review, 68(5), 2-9.
Reimer, A., & Kuehn, R. (2005). The impact of servicescape on quality perception. European Journal of Marketing, 39, 785-808.
Russel, J. A., & Pratt, G. (1980). A description of affective quality attributed to environ-ment. Journal of Personality and Social Psychology, 38, 311-322.
Ryu, K. (2005). DINESCAPE, emotions, and behavioral intentions in upscale restau-rants. Unpublished doctoral dissertation, Kansas State University, Manhattan, KS. Ryu, K., & Jang, S. (2007). The effect of environmental perceptions on behavioral
inten-tions through emointen-tions: The case of upscale restaurants. Journal of Hospitality & Tourism Research, 31, 56-72.
Schall, M. (2003). Best practices in the assessment of hotel-guest attitudes. Cornell Hotel and Restaurant Administration Quarterly, 44(2), 51-65.
Sirohi, N., McLaughlin, E. W., & Wittink, D. R. (1998). A model of consumer percep-tions and store loyalty intenpercep-tions for a supermarket retailer. Journal of Retailing, 74, 223-245.
Spreng, R. A., Mackenzie, S. C., & Olshavsky, S. W. (1996). A reexamination of the determinants of consumer satisfaction. Journal of Marketing, 60, 15-52.
Tepeci, M. (1999). Increasing brand loyalty in the hospitality industry. International Journal of Contemporary Hospitality Management, 11, 223-229.
Varki, S., & Colgate, M. (2001). The role of price perceptions in an integrated model of behavioral intentions. Journal of Service Research, 3, 232-240.
Wakefield, K. L., & Blodgett, J. G. (1994). The importance of servicescapes in leisure service settings. Journal of Services Marketing, 8(3), 66-76.
Wakefield, K. L., & Blodgett, J. G. (1996). The effects of the servicescape on customers’ behavioral intentions in leisure service setting. Journal of Services Marketing, 10(6), 45-61.
Wakefield, K. L., & Blodgett, J. G. (1999). Customer response to intangible and tangible service factors. Psychology & Marketing, 16, 51-68.
Yang, Z., & Peterson, R. T. (2004). Customer perceived value, satisfaction, and loyalty: The role of switching costs. Psychology & Marketing, 21, 799-822.
Yi, Y. (1990). A critical review of consumer satisfaction. In V. Zeithaml (Ed.), Review of marketing (pp. 68-122). Chicago: American Marketing Association.
Zeithaml, V. A. (1983). Conceptualizing and measuring consumer response to price. In R. P. Bagozzi & A. M. Tybout (Eds.), Advances in consumer research (pp. 612-616). Ann Arbor, MI: Association for Consumer Research.
Zeithaml, V. A. (1988). Consumer perceptions of price, quality, and value: A means-end model and synthesis of evidence. Journal of Marketing, 52, 2-22.
Zeithaml, V. A., Berry, L. L., & Parasuraman, A. (1996). The behavioral consequences of service quality. Journal of Marketing, 60, 31-46.
Submitted December 3, 2007
Final Revision Submitted May 9, 2008 Accepted May 20, 2008
Refereed Anonymously
Heesup Han, PhD (e-mail: [email protected]), is an assistant professor in the Department of Tourism Management, College of Business Administration, Dong-A University, Busan, Korea. Kisang Ryu, PhD (e-mail: [email protected]), is an assistant professor in The Lester E. Kabacoff School of Hotel, Restaurant and Tourism Administration at the University of New Orleans, New Orleans, LA.
by Kisang Ryu on October 14, 2009
http://jht.sagepub.com
Downloaded from