ASSESSMENT OF GLOBAL WIND ENERGY RESOURCE UTILIZATION POTENTIAL
M. Ma a, B. He a, *, Y. Guan a, H. Zhang a, S. Song b
a
School of Resources and Environment, University of Electronic Science and Technology of China, Xiyuan Ave, Chengdu, China - ([email protected], [email protected], [email protected], [email protected])
b
Chengdu Engineering Corporation Limited, North Huanhua Road, Chengdu, China - [email protected]
KEY WORDS: Wind energy resource, Assessment, Global, Utilization potential, Remote sensing, ERA-Interim, Data mining
ABSTRACT:
Development of wind energy resource (WER) is a key to deal with climate change and energy structure adjustment. A crucial issue is to obtain the distribution and variability of WER, and mine the suitable location to exploit it. In this paper, a multicriteria evaluation (MCE) model is constructed by integrating resource richness and stability, utilization value and trend of resource, natural environment with weights. The global resource richness is assessed through wind power density (WPD) and multi-level wind speed. The utilizable value of resource is assessed by the frequency of effective wind. The resource stability is assessed by the coefficient of variation of WPD and the frequency of prevailing wind direction. Regression slope of long time series WPD is used to assess the trend of WER. All of the resource evaluation indicators are derived from the atmospheric reanalysis data ERA-Interim with spatial resolution 0.125°. The natural environment factors mainly refer to slope and land-use suitability, which are derived from multi-resolution terrain elevation data 2010 (GMTED 2010) and GlobalCover2009. Besides, the global WER utilization potential map is produced, which shows most high potential regions are located in north of Africa. Additionally, by verifying that 22.22% and 48.89% operational wind farms fall on medium-high and high potential regions respectively, the result can provide a basis for the macroscopic siting of wind farm.
* Corresponding author
1. INTRODUCTION
In recent years, climate change and air pollution caused by the burning of fossil fuels have become the focus of global attention. Speeding up to promote energy revolution and urge clean and renewable energy to replace the traditional energy are imminent (Twidell and Weir, 2015). As a kind of renewable energy, WER has become an important choice for many countries to cope with climate change and adjust their energy structure, due to its characteristics of rich reserves, easy development and utilization. However, influenced by climate background and geographical environment, WER has a strong regional distribution (Hau, 2013). Therefore, mining and obtaining the utilization potential of WER becomes a prerequisite before develop it.
In previous studies, several different WER assessment methods have been developed, including the statistical method based on the observation data of Land-Based Station or wind tower, the numerical simulation method based on meteorological model, the retrieval method based on the Synthetic Aperture Radar (SAR) image, and the statistical method based on the atmospheric reanalysis data. Traditional method of WER assessment is statistic or interpolation, which requires a sufficiently dense observation data (Archer and Jacobson, 2003). In spite of the simple method, the data’s density is also difficult to meet the demand on a global scale. Meanwhile, the station also lack continuous spatial coverage data. Using numerical simulation method for WER assessment has been popular these years, such as WRF (Weather Research and Forecasting), MM5 and CALMET (Ojrzyńska et al., 2016). These models serve a wide range of meteorological applications across scales from tens of meters to thousands of kilometres. However, this method is always applied to a specific region and the refine assessment for global WER will be a consuming work due to its heavy
computing burden and limited computing resource. Therefore, thenumerical simulation method is not suitable for global WER assessment. The method based on SAR image can provide a unique cost-effective way to estimate WER over large areas. However, it can only be applied to offshore, because it needs to determine the relationship between wind speed and sea surface backscattering coefficient (Hasager et al., 2015). So far, server atmospheric reanalysis datasets have been published, such as NECP/NCAR, JRA-55 and ERA-Interim, which are relatively new source of meteorological information, offering a potential solution to WER assessment. Many scholars obtained a large number of research achievements in atmospheric circulation mechanism and climate change based on those data.Importantly, with this approach it is possible to generate a time series of gridded atmospheric variable, including temperature, pressure and wind data (Dee et al., 2011). Whereas most researches focus on a particular region, it’s rare to study on the global scale. Therefore, this paper selects reanalysis datasets to assess the utilization potential of global WER.
slope and the land-use suitability. Finally, MCE model and the geographical information system (GIS) are used to combine a series of evaluation indicators to assess the utilization potential of WER.
2. MATERIALS AND METHODS 2.1 Data
The meteorological data used in this paper is the latest reanalysis datasets ERA-Interim, which are downloaded from the European Centre for Medium-Range Weather Forecast (ECMWF). These variables 10m U (eastward wind) and V (northward wind) wind component, near surface temperature and pressure are required in this research. ERA-Interim integrates satellite data (ERS-1, ERS-2, and QuikSCAT), conventional observation and model data by the use of four-dimension variation assimilation system. Some studies have proved that it has a better accuracy than other reanalysis datasets (Bao and Zhang, 2013; Dee et al., 2011; Mooney et al., 2011). Its meteorological data provides a variety of spatial resolution, including 3°×3°, 2.5°×2.5°, 2°×2°, 1.5°×1.5°, 1.125°×1.125°, 1°×1°, 0.75°×0.75°, 0.5°×0.5°, 0.4°×0.4°, 0.25°×0.25° and 0.125°×0.125°. Furthermore, ERA-Interim reanalysis datasets (0.125°) is the highest resolution reanalysis data until now. Auxiliary data contains terrain elevation data GMTED 2010, MODIS vegetation index products MOD13C2 downloaded from the United States Geological Survey (USGS) and the land cover data GlobalCover2009 downloaded from European Space Agency (ESA). The details of all the data that used in this paper are shown in Table 1.
Name resolution Time range
10m U/V
MOD13C2 0.05°, Monthly 2000-2012
GlobalCover2009 300m 2009
Table 1. The specific information of data
2.2 Assessment of WER richness and utilization value Wind speed can directly reflect the distribution of WER. This paper focuses on calculating the multi-years average wind speed based on U and V wind components at 10m from ERA-Interim. Also, it counts the frequency of effective wind (3-25m/s) which is the cut-in and cut-out wind speed of wind turbine to reflect the utilization value of WER.
In order to obtain the wind speed at the hub-height of the wind turbine, it is necessary to extrapolate the wind speed to a higher level. This paper uses the modified power law (Hossain et al., 2011) to extrapolate 10m wind speed at 50m and 100m. The relation can be expressed as the Eq. (1-5).
2 2 am= the modified power law exponent
z0 = the surface roughness length (SR) (m)
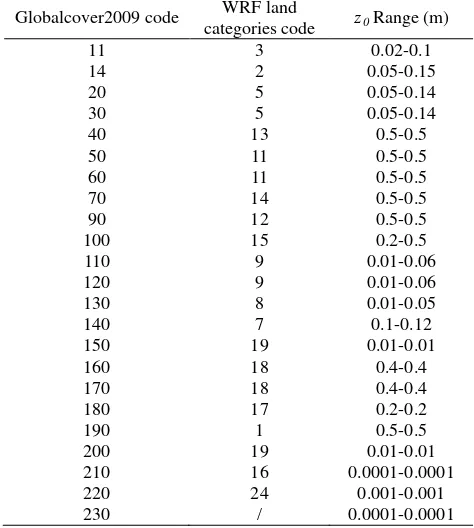
Estimating SR is necessary for extrapolate the wind speed at 10m. The relationship between Globalcover2009 categories and SR range is established, which is referred to the schemes assigning SR according to land cover categories used in WRF, it is showed in Table 2 and the SR estimation principle can be expressed as Eq. (6-8) (Li et al., 2014).
Globalcover2009 code WRF land
categories code z0Range (m)
Table 2. The correlation table between Globalcover2009 categories and surface roughness range
(1.0 ) * *
0 Frac 0min Frac 0max
z = − z + z
(6)
Frac = the ratio of VGF to annual variation of VGF VGF = Vegetation Greenness Fraction
VGFmax, VGFmin = the maximum and minimum
NDVI∞, NDVI0 = the maximum and minimum values
of NDVI in monthly MOD13C2
WPD (W/m2) is defined as an indicator which shows the capacity of wind resources (Pishgar-Komleh et al., 2015). Moreover, WPD is a better energy utilization potential indication than wind speed and the annual average WPD is calculated by Eq. (9-10).
3
2.3 Assessment of WER stability and trend
In the assessment of site selection of wind turbine, the degree of dispersion of WPD should be taken into account. Stable WPD is not only conducive to the acquisition and conversion of WER, but also can extend the life of wind turbine. The stability of WER is reflected by the frequency of prevailing wind direction and coefficient of variation. The frequency of prevailing wind direction is counted by 6-hourly wind direction which is calculated by U and V wind components at 10m. The coefficient of variation can be expressed as Eq. (11-12) (Zheng et al., 2011). The smaller coefficient of variation, the better stability of the WER.
v
The linear regression coefficient of the series WPD is also an important indicators, which is used to reflect the increase and decrease trend of WER, and it can also reflect the stability of WER to a certain extent.
2.4 Environment indicators
The natural environment indicators include the land-use suitability and slope. The land-use suitability is allocated by the basis of intensive and economical principle that using unused land as much as possible and avoiding the farmland and forest. The land-use suitability is a dimensionless indicator, which is divided into 9 grades according to GlobalCover2009 ranging from 0 to 1. The larger value is more suitable for constructing wind farm, and the allocated scheme is shown in Table 3. Slope is a technical criterion since very steep slopes of land are not suitable for wind farm installation. The main reason is slope
affects the cost of wind farm construction and maintenance (Tegou et al., 2010). This paper computed it from digital elevation model GMTED2010, and divided it into 8 grades ranging from 0 to 1 that shown in Table 4.
GlobalCover2009 code Land use type Land-use suitability
11,14 crop 0.25
20,30 crop and vegetation 0.5
40,50,60,70,90,100 forest 0.375
110,120 forest and shrub 0.625
130,150 shrub 0.75
140 grass 0.875
160,170,180 vegetation
regularly flooded 0.125
200 bare areas 1
190,210,220,230 urban, water, ice 0 Table 3. The land-use suitability
Slope (%) Value
Table 4. The slope classification
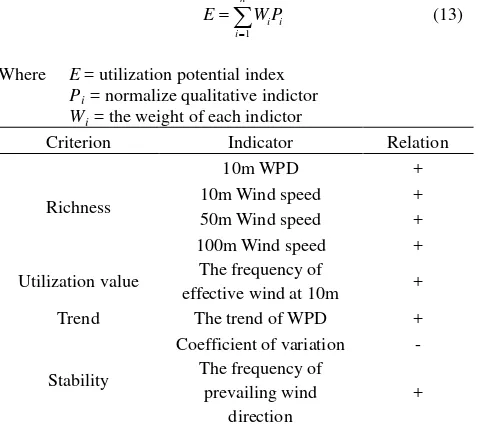
2.5 Comprehensive analysis
After calculation, a series of indicators to evaluate the utilization potential of WER has been obtained. In order to fully reflect the utilization potential of WER, the MCE model is used to combine all the indicators, and the formula is shown as Eq. (13). The relationship between the utilization potential of WER and indicators are shown in Table 5 and they can be divided into two groups: (i) positive indicators, (ii) negative indicators. Positive indicators are chosen to improve the utilization potential of WER, including the mean annual wind speed at 10, 50 and 100m, the mean annual WPD, etc. In contrast, negative indicators are the factors to restrict the utilization potential of WER. Pi = normalize qualitative indictor
Wi = the weight of each indictor
Criterion Indicator Relation
Richness
10m WPD +
10m Wind speed +
50m Wind speed +
100m Wind speed +
Utilization value The frequency of
effective wind at 10m +
Trend The trend of WPD +
Stability
Coefficient of variation - The frequency of
prevailing wind direction
Environment Slope / Land-use type suitability /
The unit and attributes of various indicators are different, so it is necessary to normalized indictors to eliminate the influence. According to the relationship between different indictor and the utilization potential of WER, different function is adopted to normalize quantitative indicators on a scale from 0 to 1, it is shown in Eq. (14-15).
Where y = the normalize quantitative indicator X = the real value of indicator
Xmax, Xmin= the maximum and minimum values of
each indicator
An equal weighted overlay is applied to all indictors to obtain the utilization potential of WER which is a dimensionless index ranging from 0 to 1. The smaller value represents the lower potential to utilize wind energy.
3. RESULTS
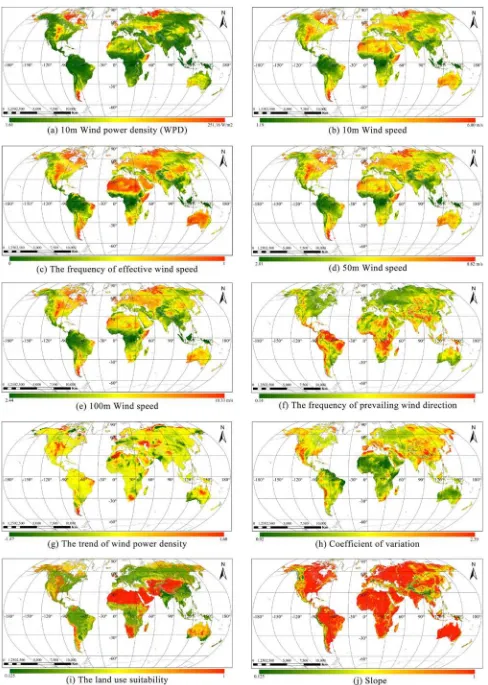
Based on the ERA-Interim reanalysis datasets and remote sensing products, 10 evaluation indicators have been produced, and all indicators were integrated with equal weights to produce the utilization potential of WER with spatial resolution 0.125°, which are shown in Figure 1-2. Additionally, a classification system with 5 categories is applied to grade the utilization potential, and the percentage of each potential area are counted, which is shown in Table 6, where L is low potential, M is medium potential and H is high potential.
Figure 2. The utilization potential of WER and validation
In North America, most of high utilization potential regions are located in central United States and north-eastern Canada. The low utilization potential regions are mainly located in west of North America. Other regions present a medium utilization potential.
In South American, eastern Brazil, southern Argentina and northern coast of South America are found to have some high utilization potential areas. The other regions of utilization potential are relatively low.
In Africa, the high utilization potential regions are mainly concentrated in North Africa and Somalia. The southern part of Africa present medium utilization potential.
In Europe, the high utilization potential regions are primarily located in Denmark, British, Irish and coastal areas of southern Sweden. But there are also large areas in southern Europe which present low utilization potential.
In Asia, the high utilization potential areas are mainly distributed in northern Russia, Turkmenistan, Kazakhstan and Uzbekistan. A large number of medium to high utilization
potential areas are distributed in China’s northwest regions. Most parts of Russia are medium utilization potential regions. In Oceania, most parts of Australian present medium to high and high utilization potential.
Potential L L-M M M-H H
Range 0-0.2 0.2-0.4 0.4-0.6 0.6-0.8 0.8-1 Area (%) 28.78 22.51 20.45 16.50 11.76
Table 6. Classification of WER utilization potential
Finally, the result is simply validated by the location of 180 wind farms around the world, which is obtained from Wikipedia and verified by Google Earth. There are 40 and 88 stations falling on medium-high and high potential regions respectively that shown in Figure 2. More details about the count of station in each potential region can be found in Table 7. From the validation result, the outcome of this paper is credible and can be used as the basis for the macro-siting of wind farms. However, the utilization potential of wind energy resource are not well reflected at some areas which have the special climate and regional socio-economic factors.
Potential L L-M M M-H H
Count 7 23 22 40 88
Percent (%) 3.89 12.78 12.22 22.22 48.89 Table 7. Count of wind farm in each potential region
4. CONCLUSIONS
The main contents of this paper is to mine and determine the utilization potential of global wind energy resource. The evaluation model takes into account wind energy resource richness, wind energy resource utilization value, wind energy resource stability, the trend of wind energy resource and natural environment in order to obtain multi-aspect information. The MCE combined with GIS is used to mine and assess the utilization potential of wind energy resource. The result is a dimensionless value ranging from 0 to 1 with spatial resolution 0.125°. In addition, the model developed in this paper can screen the global high potential regions of wind energy utilization according to the result.
The outcome of this paper is credible and can be used as the basis for the macro-siting of wind farms.
Subsequent researches will take adding energy demand, socio-economic and humanities factors into consideration to get more realistic potential for utilization of wind energy resource.
REFERENCES
Archer, C.L., Jacobson, M.Z., 2003. Spatial and temporal distributions of U.S. winds and wind power at 80 m derived from measurements. Journal of Geophysical Research Atmospheres, 108(D9), pp. 469-474.
Bao, X., Zhang, F., 2013. Evaluation of NCEP–CFSR, NCEP– NCAR, ERA-Interim, and ERA-40 reanalysis datasets against independent sounding observations over the Tibetan Plateau. Journal of Climate, 26(1), pp. 206-214.
Peubey, C., de Rosnay, P., Tavolato, C., Thépaut, J.N., Vitart, F., 2011. The ERA-Interim reanalysis: configuration and performance of the data assimilation system. Quarterly Journal of the Royal Meteorological Society, 137(656), pp. 553-597. Hasager, C.B., Vincent, P., Badger, J., Badger, M., Bella, A.D., Peña, A., Husson, R., Volker, P.J.H., 2015. Using satellite SAR to characterize the wind flow around offshore wind farms. Energies, 8(6), pp. 5413-5439.
Hau, E., 2013. Wind Turbines. Springer, Berlin, pp. 505-547. Hossain, J., Sinha, V., Kishore, V.V.N., 2011. A GIS based assessment of potential for windfarms in India. Renewable Energy, 36(12), pp. 3257-3267.
Li, Q., Cai, X., Song, Y., 2014. Research of the distribution of national scale surface roughness length with high resolution in China. Plateau Meteorology, 33(2), pp. 474-482.
Mooney, P.A., Mulligan, F.J., Fealy, R., 2011. Comparison of ERA-40, ERA-Interim and NCEP/NCAR reanalysis data with observed surface air temperatures over Ireland. International Journal of Climatology, 31(4), pp. 545-557.
Ojrzyńska, H., Kryza, M., Wałaszek, K., Szymanowski, M.,
Werner, M., Dore, A.J., 2016. High-resolution dynamical downscaling of ERA-Interim using the WRF regional climate model for the area of poland. Part 2: model performance with respect to automatically derived circulation types. Pure and Applied Geophysics, 174(2), pp. 1-24.
Pishgar-Komleh, S.H., Keyhani, A., Sefeedpari, P., 2015. Wind speed and power density analysis based on Weibull and Rayleigh distributions (a case study: Firouzkooh county of Iran). Renewable and Sustainable Energy Reviews, 42, pp. 313-322.
Tegou, L.I., Polatidis, H., Haralambopoulos, D.A., 2010. Environmental management framework for wind farm siting: methodology and case study. Journal of Environmental Management, 91(11), pp. 2134-2147.
Twidell, J., Weir, T., 2015. Renewable Energy Resources. Routledge, London, pp. 4-9.