Bhutan 2017
Acronyms
AD Auto disable
AEFI Adverse events following immunization
AFP Acute flaccid paralysis
BCG Bacillus Calmette-Guérin vaccine
CES Coverage evaluation survey
cMYP Comprehensive multi-year plan
CRS Congenital rubella syndrome
DHS Demographic health survey
DT Diphtheria tetanus toxoid, pediatric
DTP Diphtheria – tetanus – pertussis vaccine
DTP-Hib-HepB Pentavalent vaccine
DTP-Hib-HepB3 3rd dose pentavalent vaccine
EPI Expanded programme on immunization
GDP Gross domestic product
HCW Health care worker
HepB Hepatitis B vaccine
Hib Haemophilus influenzae type b
HPV Human papilloma virus
IgM Immunoglobulin M
IPV Inactivated poliovirus vaccine
JE Japanese encephalitis
JE_Live-Atd JE live attenuated vaccine
JRF WHO UNICEF joint reporting form
LB Live birth
M Measles
MCV1 First dose measles containing vaccine
MCV2 Second dose measles containing vaccine
MICS Multiple indicator cluster survey
MMR Measles mumps rubella vaccine
MNT Maternal and neonatal tetanus
MR Measles rubella vaccine
NCIP National committee on immunization practices
NID National immunization day
NTAGI National technical advisory group on immunization
NPEV Non-polio enterovirus
NT Neonatal tetanus
OPV Oral poliovirus vaccine
bOPV Bivalent OPV
tOPV Trivalent OPV
PCV Pneumococcal conjugate vaccine
SEAR WHO South-East Asia Region
SIA Supplementary immunization activities
SNID Subnational immunization day
Td Tetanus diphtheria toxoid; older children, adults
TT Tetanus toxoid
TT2+ 2 or more doses TT
VDPV Vaccine derived poliovirus
VPD Vaccine preventable diseases
WCBA Women of child bearing age
Contents
Impact of rouine immunizaion
Page
No.
EPI history 5
Basic informaion 2016 Table 1 5
Immunizaion schedule 2016 Table 2 5
Naional immunizaion coverage 1980 - 2016 Figure 1 6
Immunizaion system highlights Table 3 6
DTP3 coverage, diphtheria and pertussis cases 1980 - 2016 Figure 2 7 Reported cases of vaccine preventable diseases 2011 - 2016 Table 4 7
DTP-Hib-HepB3 coverage by district 2015 Figure 3 7
DTP-Hib-HepB3 coverage by district 2016 Figure 4 7
Towards measles eliminaion and rubella/congenital rubella
syndrome control
Page
No.
MCV1 and MCV2 coverage, measles and rubella cases, 1980-2016 Figure 10 11
MCV supplementary immunizaion aciviies Table 7 11
MCV1 coverage by district 2015 Figure 11 12
MCV1 coverage by district 2016 Figure 12 12
MCV2 coverage by district 2015 Figure 13 12
MCV1 coverage by district 2016 Figure 14 12
Immunity against measles – immunity proile by age in 2016 Figure 15 12 Subnaional risk assessment for measles and rubella Figure 16 12 Sporadic and outbreak associated measles cases by month 2011 - 2016 Figure 17 13 Immunizaion status of conirmed (laboratory and Epi linked) measles outbreak
associated cases by age 2011 – 2016 Figure 18 13
Quality of ield and laboratory surveillance for measles and rubella 2012 - 2016 Table 8 14 Performance of laboratory surveillance 2012 - 2016 Table 9 14 WHO supported laboratory network for VPD surveillance Figure 19 15
Maternal and neonatal tetanus eliminaion is sustained
Page
No.
TT2+ coverage and NT cases 1980 - 2016 Figure 5 8
Polio-free status is maintained
Page
No.
AFP surveillance indicators 2011 - 2016 Table 5 9
Non-polio AFP rate by district 2015 Figure 6 9
Non-polio AFP rate by district 2016 Figure 7 9
Adequate stool specimen collecion percentage by district 2015 Figure 8 10 Adequate stool specimen collecion percentage by district 2016 Figure 9 10
WHO South-East Asia Region
EPI history
• EPI launched on 15 November 1979
• TT for pregnant women introduced in 1983
• HepB vaccine introduced in 1997
• DTP-HepB vaccine introduced in 2003
• AD syringes introduced in 2003
• MR vaccine introduced in 2006
• DTP-Hib-HepB vaccine introduced in 2009
• HPV vaccine introduced in 2010
• HepB birth dose introduced in 2012
• TT vaccine replaced by Td vaccine in 2012
• IPV vaccine introduced in 2015
• tOPV to bOPV switched on 25 April 2016
• MMR vaccine introduced in October 2016.
Source: cMYP 2014-2018 and VPDP/MOH
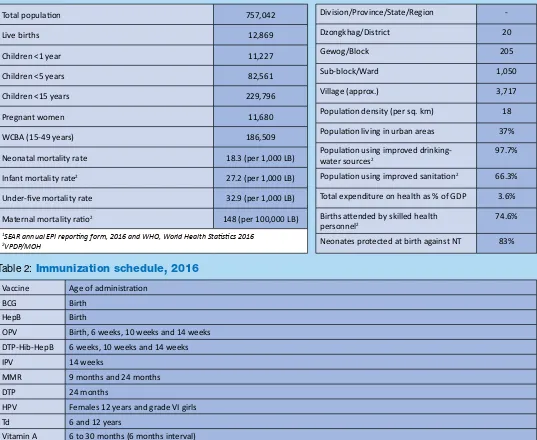
Table 1:
Basic information
12016
Total populaion 757,042
Live births 12,869
Children <1 year 11,227
Children <5 years 82,561
Children <15 years 229,796
Pregnant women 11,680
WCBA (15-49 years) 186,509
Neonatal mortality rate 18.3 (per 1,000 LB)
Infant mortality rate2 27.2 (per 1,000 LB)
Under-ive mortality rate 32.9 (per 1,000 LB)
Maternal mortality raio2 148 (per 100,000 LB)
1SEAR annual EPI reporing form, 2016 and WHO, World Health Staisics 2016 2VPDP/MOH
Division/Province/State/Region
-Dzongkhag/District 20
Gewog/Block 205
Sub-block/Ward 1,050
Village (approx.) 3,717
Populaion density (per sq. km) 18
Populaion living in urban areas 37%
Populaion using improved drinking-water sources2
97.7%
Populaion using improved sanitaion2 66.3%
Total expenditure on health as % of GDP 3.6%
Births atended by skilled health personnel2
74.6%
Neonates protected at birth against NT 83%
Table 2:
Immunization schedule, 2016
Vaccine Age of administraionBCG Birth
HepB Birth
OPV Birth, 6 weeks, 10 weeks and 14 weeks
DTP-Hib-HepB 6 weeks, 10 weeks and 14 weeks
IPV 14 weeks
MMR 9 months and 24 months
DTP 24 months
HPV Females 12 years and grade VI girls
Td 6 and 12 years
Vitamin A 6 to 30 months (6 months interval) Source: WHO/UNICEF JRF,, 2016
Table 3:
Immunization system highlights
cMYP for immunizaion 2014-2018
NTAGI fully funcional
Spending on vaccines inanced by the government 41%
Spending on rouine immunizaion programme inanced by the government 24% Updated micro-plans that include aciviies to improve immunizaion coverage 20 districts (100%) Naional policy for health care waste management including waste from immunizaion aciviies in place
Naional system to monitor AEFI in place
Most recent EPI CES Naional Health Survey 2012
>80% coverage for DTP-Hib-HepB3 20 districts (100%)
>90% coverage for MCV1 16 districts (80%)
>10% drop-out rate for DTP-Hib-HepB1 to DTP-Hib-HepB3 1 district (5%)
Source: WHO/UNICEF JRF, 2016
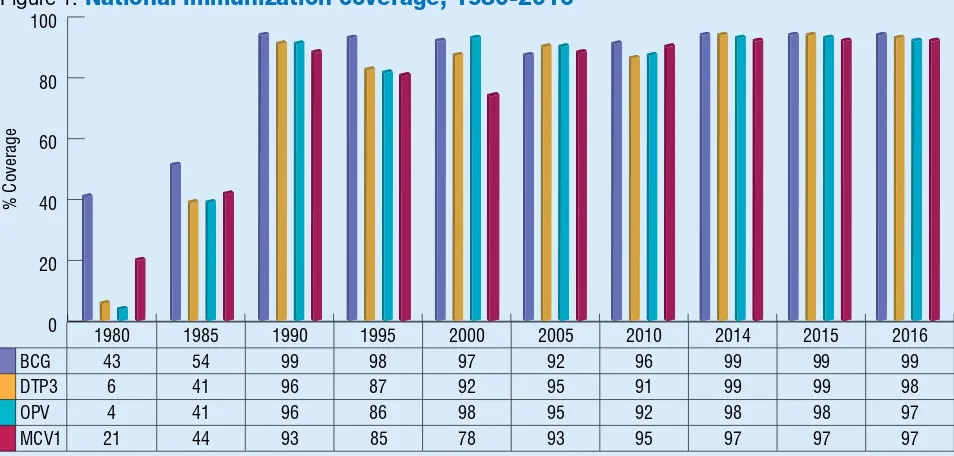
Figure 1:
National immunization coverage, 1980-2016
% Coverage
Source: WHO/UNICEF esimates of naional immunizaion coverage, July 2017 revision
1980 1985 1990 1995 2000 2005 2010 2014 2015 2016
BCG 43 54 99 98 97 92 96 99 99 99
DTP3 6 41 96 87 92 95 91 99 99 98
OPV 4 41 96 86 98 95 92 98 98 97
MCV1 21 44 93 85 78 93 95 97 97 97
Figure 3:
2015
Figure 4:
2016
Source: SEAR annual EPI reporing form, 2016 (administraive data) Source: SEAR annual EPI reporing form, 2015 (administraive data)
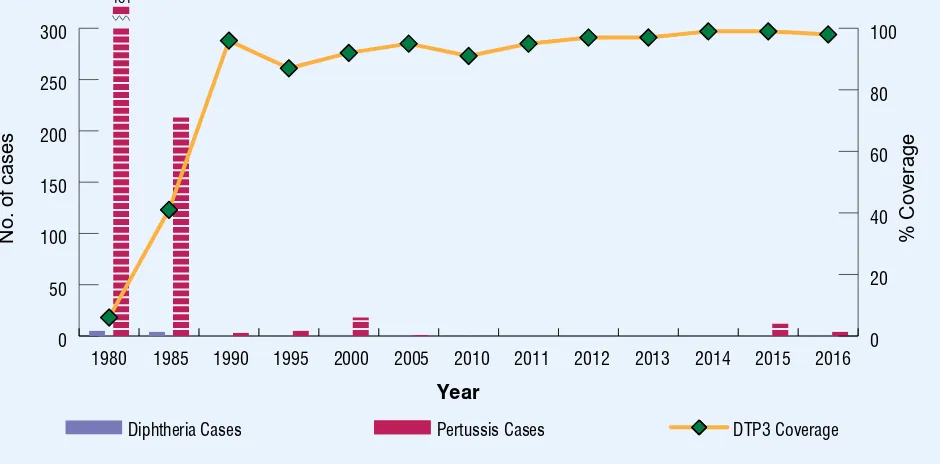
Figure 2:
DTP3 coverage
1, diphtheria and pertussis cases
2, 1980-2016
Year
Diphtheria Cases Pertussis Cases DTP3 Coverage
%
1WHO/UNICEF esimates of naional immunizaion coverage, July 2017 revision 2WHO vaccine-preventable diseases: monitoring system 2016
Table 4:
Reported cases of vaccine preventable diseases, 2011-2016
Year Polio Diphtheria Pertussis NT(% of all tetanus) Measles Rubella Mumps JE CRS
2011 0 0 0 0 10 3 262 3 ND
Source: WHO/UNICEF JRF, (muliple years) ND=No data
DTP-Hib-HepB3 coverage by district
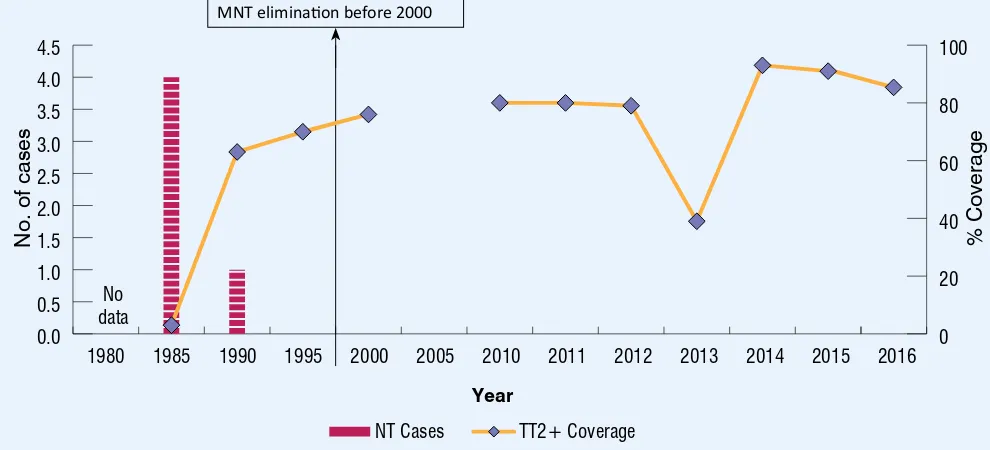
Figure 5:
TT2+ coverage
1and NT cases
2, 1980-2016
1WHO/UNICEF JRF, Country oicial esimates, 1980-2016 2WHO vaccine-preventable diseases: monitoring system 2016
Maternal and
neonatal tetanus elimination is sustained
1980 1985 1990 1995 2000 2005 2010 2011 2012 2013 2014 2015 2016
%
NT Cases TT2+ Coverage
0.0
MNT eliminaion before 2000
Table 5:
AFP surveillance performance indicators, 2011-2016
Indicator 2011 2012 2013 2014 2015 2016
AFP cases 6 10 10 11 9 11
Wild poliovirus conirmed cases 0 0 0 0 0 0
Compaible cases 0 0 0 0 0 0
Non-polio AFP rate1 2.74 5.14 4.52 4.84 4.18 5.11
Adequate stool specimen collecion percentage2 83% 70% 80% 73% 67% 73%
Total stool samples collected 7 21 11 22 16 20
% NPEV isolaion 0 0 0 9 0 0
% Timeliness of primary result reported3 71 100 100 100 100 100
1Number of discarded AFP cases per 100,000 children under 15 years of age.
2Percent with 2 specimens, at least 24 hours apart and within 14 days of paralysis onset. 3Results reported within 14 days of sample received at laboratory.
Figure 6:
2015
Figure 7:
2016
Polio-free
status is maintained
Last clinically-conirmed polio case was reported in 1986.
Non-polio AFP rate by district
<1 1 – 1.99
>2 No non-polio AFP case
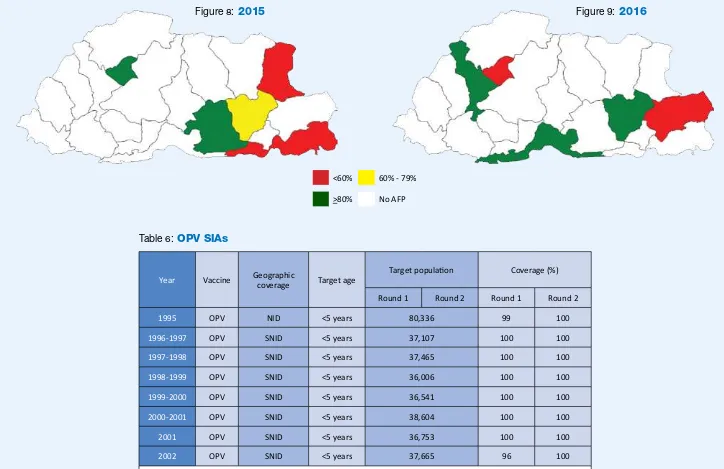
Table 6:
OPV SIAs
Year Vaccine Geographic
coverage Target age
Target populaion Coverage (%)
Round 1 Round 2 Round 1 Round 2
1995 OPV NID <5 years 80,336 99 100
1996-1997 OPV SNID <5 years 37,107 100 100
1997-1998 OPV SNID <5 years 37,465 100 100
1998-1999 OPV SNID <5 years 36,006 100 100
1999-2000 OPV SNID <5 years 36,541 100 100
2000-2001 OPV SNID <5 years 38,604 100 100
2001 OPV SNID <5 years 36,753 100 100
2002 OPV SNID <5 years 37,665 96 100
Source: WHO/UNICEF JRF, (muliple years)
Figure 9:
2016
Figure 8:
2015
Adequate stool specimen collection % by district
<60% 60% - 79%
>80% No AFP
Towards
measles elimination and rubella/CRS control
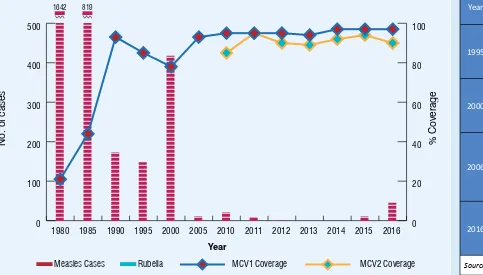
Figure 10:
MCV1 and MCV2 coverage
1, measles and rubella cases
2, 1980-2016
Measles Cases Rubella MCV1 Coverage MCV2 Coverage
2016
No. of cases
Year
1WHO/UNICEF esimates of naional immunizaion coverage, July 2017 revision 2WHO vaccine-preventable diseases: monitoring system 2016
Table 7:
MCV SIAs
Year Anigen Geographic
coverage Target group Target Coverage %
1995 M naionwide 9 months to
15 years 69,285 100%
2000 M naionwide 9 months to
15 years 214,128 100%
2006 MR naionwide
9 months to 14 years children and
15 years to 44 years
women
338,040 98%
2016 MR subnaional 418 100%
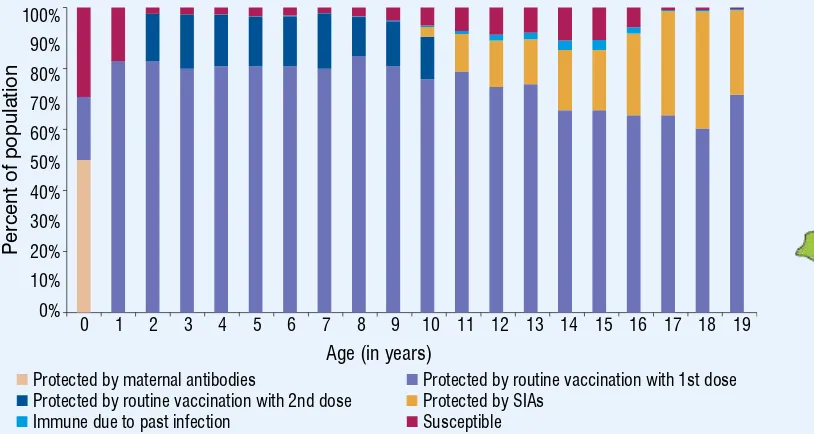
0 1 2 3 4 5 6 7 8 9 10 11 12 13 14 15 16 17 18 19
Percent of population
Age (in years)
Protected by maternal antibodies Protected by routine vaccination with 1st dose Protected by routine vaccination with 2nd dose Protected by SIAs
Immune due to past infection Susceptible 0%
Figure 15:
Immunity against measles - immunity profile by age in 2016
* Modeled using MSP tool ver 2 assuming the schedule and MCV coverage remain unchanged and no SIAs between 2009 & 2016.
<80% 80% - 89% 90% - 94% >95%
Figure 12:
2016
Figure 13:
2015
Figure 14:
2016
Source: SEAR annual EPI reporing form, 2016 (administraive data)
Source: SEAR annual EPI reporing form, 2016 (administraive data)
Figure 11:
2015
Source: SEAR annual EPI reporing form,
2015 (administraive data) Source: SEAR annual EPI reporing form, 2015 (administraive data)
Figure 16:
Sub-national risk assessment - measles and rubella
MCV1 coverage by district
MCV2 coverage by district
Source: developed using WHO risk assessment tool based on JRF & ARF data base
Figure 17:
Sporadic and outbreak associated measles cases* by month 2011-2016
Outbreak associated measles
0
*Includes laboratory conirmed and epidemiologically linked cases Source: SEAR Monthly VPD reports.
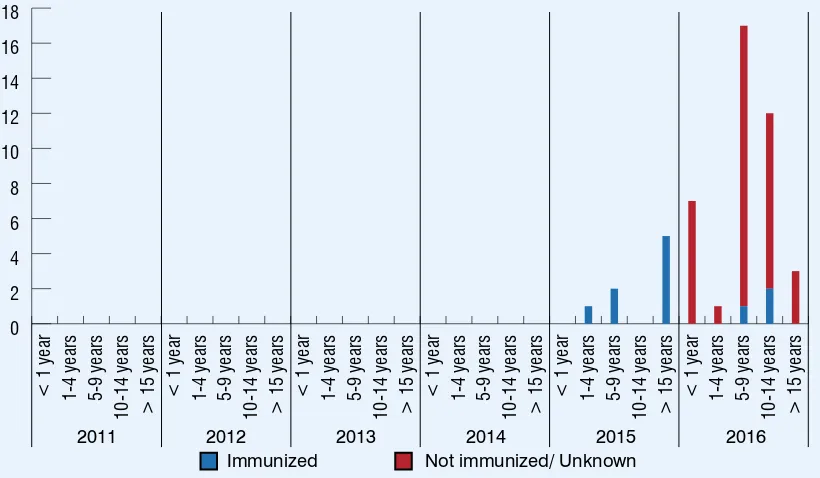
Figure 18:
Immunization status of confirmed (laboratory and EPI linked) measles
outbreak associated cases, by age, 2011-2016
> 15 years
10-14 years
5-9 years
1-4 years
< 1 year
> 15 years
10-14 years
5-9 years
1-4 years
< 1 year
> 15 years
10-14 years
5-9 years
1-4 years
< 1 year
> 15 years
10-14 years
5-9 years
1-4 years
< 1 year
> 15 years
10-14 years
5-9 years
1-4 years
< 1 year
> 15 years
10-14 years
5-9 years
1-4 years
< 1 year
2011 2012 2013 2014 2015 2016
Immunized Not immunized/ Unknown
0
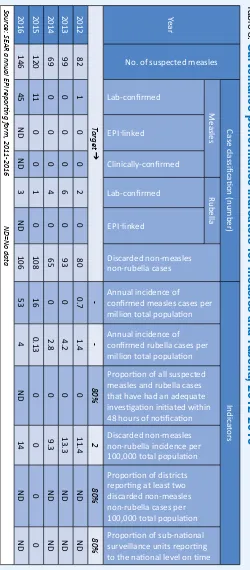
Table 8:
Surveillance performance indicators for measles and rubella, 2012-2016
Year
No. of suspected measles
Case classiic
Discarded non-measles non-rubella cases
Annual incidence of
conirmed measles cases per million total populaion
Annual incidence of
conirmed rubella cases per million total populaion Proporion of all suspected
measles and rubella cases that have had an adequate
invesigaion iniiated within 48 hours of noiicaion
Discarded non-measles non-rubella incidence per
100,000 total populaion Proporion of districts reporing at least two
discarded non-measles non-rubella cases per
100,000 total populaion Proporion of sub-naional surveillance units reporing to the naional level on ime Lab-conirmed
AR annual EPI reporing f
orm, 2011-2016
ND=No dat
a
Year
Serum specimen collected from suspected measles cases
Serum specimen received in laboratory
within 5 days of collecion
Specimen
posiive for
measles IgM
Specimen
posiive for
rubella IgM
% Results within 4 days of receipt
% Posiive cases
tested for viral
detecion
AR annual EPI reporing f
orm, 2012-2016
ND=No dat
a
Table 9:
Performance of laboratory surveillance, 2012-2016
Figure 19:
WHO supported laboratory network for VPD surveillance
Public Health Laboratory
• Naional measles/rubella laboratory
For contact or feedback:
Expanded Programme on Immunizaion Ministry of Health, Thimphu, Bhutan Tel: +975-2-332296, Fax: +975-2-332296 Email: [email protected]
www.health.gov.bt
Immunizaion and Vaccine Development (IVD)
WHO-SEARO, IP Estate, MG Marg, New Delhi 110002, India Tel: +91 11 23370804, Fax: +91 11 23370251
Email: [email protected]