255 (2000) 247–260
www.elsevier.nl / locate / jembe
Measurement of ingestion rate of Hydrobia ulvae (Pennant)
on intertidal epipelic microalgae: the effect of mud snail
density
a ,* b b
´
Gerard F. Blanchard , Jean-Marc Guarini , Laurent Provot ,
b b
Pierre Richard , Pierre-Guy Sauriau
a
´
Laboratoire de Biologie et Environnement Marins(LBEM), Universite de La Rochelle, Institut du Littoral,
´
Avenue Michel Crepeau, 17042 La Rochelle Cedex, France b
Centre de Recherche en Ecologie Marine et Aquaculture(CREMA) de L’Houmeau,
UMR10 CNRS-IFREMER, B.P. 5, 17137 L’Houmeau, France
Received 13 June 2000; received in revised form 12 September 2000; accepted 19 September 2000
Abstract
The individual mean ingestion rate of Hydrobia ulvae was measured experimentally in controlled microcosms, in the dark to avoid primary production during measurement and at constant temperature. The experimental design was based on the addition of prelabelled epipelic microalgae to microcosms in a constant proportion with unlabelled diatoms, and in such a way that algal food availability was not a limiting factor within the range of tested densities (0.3 to 4.1
22
snails cm ). Results show that the individual mean ingestion rate decreased significantly from
21 21 21 21 22
26.661.1 ng Chl a snail h to 22.461.0 ng Chl a snail h between 0.7 and 3 snails cm . We hypothesize that this sharp decrease (the threshold density was between 1.4 and 2.5 snails
22
cm ) may account for a density-dependent effect. We have tested this hypothesis by using a simple random walk model including basic behavioural processes such as a break in feeding activity when two individuals contact each other. The model represents quantitatively well the threshold effect, suggesting that behavioural processes have to be taken into account for estimating a global feeding activity of H. ulvae populations. 2000 Elsevier Science B.V. All rights reserved.
Keywords: Intertidal mudflat; Feeding ecology; Microphytobenthos; Hydrobia ulvae; Ingestion rate; Be-havioural processes
*Corresponding author. Tel.:133-5-4645-8552; fax:133-5-4645-8264.
E-mail address: [email protected] (G.F. Blanchard).
1. Introduction
Microphytobenthos is the main source of primary production in intertidal mudflats (Admiraal, 1984; Colijn and De Jonge, 1984; De Jonge and Colijn, 1994; Blanchard and Cariou-Le Gall, 1994; Cariou-Le Gall and Blanchard, 1995; Guarini et al., 2000). It directly supplies deposit-feeders, especially gastropods like Hydrobia spp. (Fenchel et al., 1975; Kofoed, 1975; Fenchel and Kofoed, 1976; Lopez and Levinton, 1978; Jensen and Siegismund, 1980; Levinton and Bianchi, 1981; Bianchi and Levinton, 1984; Forbes and Lopez, 1986; Morrisey, 1987), which are often a dominant inhabitant of intertidal mudflats as reported by Barnes (1981) and Reise (1985) for Hydrobia ulvae (Pennant).
´
In Marennes-Oleron Bay, France, Hydrobia ulvae is the most common deposit-feeder
22
in intertidal mudflats, where it can reach high densities up to 50,000 individuals m (Sauriau, 1987; Sauriau et al., 1989). A large fraction of microphytobenthos primary production is thus assumed to flow directly to this deposit-feeding compartment while, in return, the grazing pressure of H. ulvae is likely to have a strong impact on microphytobenthic biomass dynamics, as suggested by Cariou-Le Gall and Blanchard (1995). To estimate both this flux and this grazing pressure, the relevant variable to measure is the ingestion rate of H. ulvae on microphytobenthos. However, few data are available on this aspect because the snail feeding activity has generally been assessed indirectly through either its effect on diatom standing stocks (Morrisey, 1988), its production of fecal pellets (Levinton, 1979a) or its oxygen consumption (Jensen and Siegismund, 1980).
The ingestion rate will depend on several controlling factors and, in particular, there are good reasons to believe that the population density of Hydrobia ulvae will decrease its individual mean ingestion rate since it has already been demonstrated that it decreases its mean growth rate (Morrisey, 1987). Similar results were also found by Levinton (1979a) and Levinton and Bianchi (1981) for Hydrobia ventrosa (Montagu) and
Hydrobia totteni, respectively.
The objective of this article is therefore twofold: (1) testing an easy-to-use protocol for accurately estimating the individual mean ingestion rate of Hydrobia ulvae on epipelic microalgae in experimentally-controlled microcosms, and (2) assessing the effect of H. ulvae density on the individual mean ingestion rate. Contrary to field conditions where deposit-feeders in general are assumed to be food-limited (Levinton, 1972; Lopez and Levinton, 1987), rates were estimated under non-limiting food conditions; therefore, our experiment is primarily designed to investigate the competition for space on the basis of behavioural processes (Barnes, 1981; Levinton, 1979a); a simple random walk model is further developed to support the reliability of our assumptions from a quantitative point of view.
2. Materials and methods
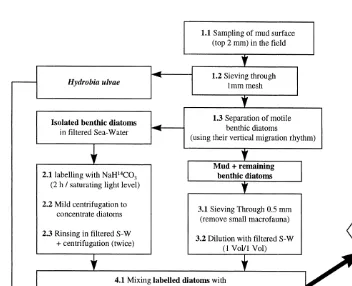
2.1. General protocol (see Fig. 1 for a description of the different steps)
Fig. 1. General protocol. Main steps in sample processing from sampling to radioactivity measurement.
intertidal mudflat located in the Aiguillon Bay, along the atlantic coast of France (468159
N, 18109 W). The mean grain size was less than 10mm. The top 1–2 mm of mud was gently scraped and stored in plastic boxes until further processing in the laboratory; samples were brought back to the laboratory within 1 h (step 1.1).
Hydrobia ulvae snails were then separated from the sediment by sieving through a
extract all microalgae, and a significant amount of diatoms still remains in the mud after the separation step (step 1.3).
14 21
To label isolated microalgae (step 2.1), NaH CO3 (40–50 mCi mmol stock solution) was added to 500 ml of the suspension to reach a final concentration of about
21
0.4mCi ml . The suspension was then placed at 208C under saturating light conditions during 2 h, with continuous mixing using a magnetic stirrer — to homogenize the suspension and ensure an even labelling of microalgae. After the incubation period, the microalgal suspension was centrifuged (3500 rev. / min during about 3 min) to
concen-14
trate diatoms (step 2.2); the supernatant containing unused C-bicarbonate was discarded. Filtered sea water was then added to the pellet to rinse diatoms; this step was repeated twice (step 2.3).
The mud used for the separation of microalgae was further sieved through a 0.5-mm mesh to remove small macrofauna (step 3.1) and was diluted with GF / F filtered sea water (1:1 v / v, step 3.2). Labelled and rinsed diatoms were then mixed with this diluted mud and homogenized (step 4.1). Therefore, as only part of the diatoms are labelled, the method assumes that labelled diatoms are ingested in the same proportion as unlabelled diatoms. This allows to convert the ingested radioactivity into ingested Chl a since the total amounts of radioactivity and Chl a contained in each microcosm were known (see
21
formula hereafter). The Chl a to radioactivity ratio can be calculated (ng Chl a dpm ) (step 4.2). Chl a was measured fluorometrically (Lorenzen, 1966).
Experimental microcosms were set up in clear tissue culture flasks. They aim at reproducing low-tide conditions. Thirty ml of mud containing labelled diatoms were introduced in these microcosms with Hydrobia ulvae (step 5). The incubation (feeding time) was stopped by the addition of formalin (to reach a final concentration of 2.5%), and the mud contained in microcosms was sieved through a 0.5 mm mesh to retrieve H.
ulvae snails (step 6). Animals were then carefully rinsed and dried overnight at about
508C. Snails were placed in scintillation vials with 750ml of Soluene-350 (Packard) for 72 h at 508C to solubilize tissues (step 7). Twelve ml of Hionic-fluor (Packard) were then added for counting radioactivity in a Packard Tri-Carb scintillation counter.
The ingestion rate of Hydrobia ulvae was determined as the amount of radioactivity ingested per snail and per hour. To convert radioactivity into Chl a we used the conversion ratio (CR) determined at step 4.2:
Ingestion rate 5 ingested radioactivity 3 CR
21 21 21 21 21
(ng Chl a snail h ) (dpm snail h ) (ng Chl a dpm )
2.2. Control experiments
2.2.1. Experiment 1
The method assumes an accumulation of radioactive material into Hydrobia ulvae proportional to the incubation time. In other words, we assume that labelled microalgae accumulate in the gut at a constant rate, and that egestion of radioactive material does not occur during incubation.
to avoid photosynthesis occurring, at 208C. Every 20 min, incubation was stopped in
14
three microcosms by adding formalin and the amount of C-diatoms accumulated in snails was measured. All measurements were corrected for non-ingestive processes by subtracting radioactivity fixed in formalin-killed controls.
2.2.2. Experiment 2
The method also assumes a conservative behaviour of label in diatoms, i.e. no loss of radioactivity from prelabelled microalgae due to respiration and excretion during incubation with snails.
To check for conservativity of label, a suspension of labelled diatoms was prepared according to step 2 of the protocol presented in Fig. 1. Then, three 1-ml replicates of the rinsed labelled diatoms were filtered on GF / F fiber glass filters every hour until 4 h after the end of labelling. If radioactivity is lost from diatoms through respiration or excretion during the 4-h period following labelling, then the amount of radioactivity on GF / F filters should decrease as a function of time.
2.3. Effect of Hydrobia ulvae density on ingestion rate
It was tested in two experiments.
2.3.1. Experiment 3
22
Five densities were tested (0.3, 0.7, 1.4, 2.5 and 4.1 snails cm ); we used the same range of densities as in Morrisey (1988), which amounts to 25, 59, 118, 210 and 344 snails per microcosm, respectively. Four replicates and one formalin-killed control were used at each density. The incubation time was 1 h in the dark at 208C in a temperature-controlled room. At the end of the incubation period, 20 H. ulvae were picked at random and processed according to steps 6 and 7 of the protocol (Fig. 1) to count ingested
21 21
radioactivity. Ingestion rates were only expressed as dpm snail h .
2.3.2. Experiment 4
A second experiment was performed in the same conditions to assess the flux of Chl a from microphytobenthos to gastropods. Only two densities were tested (0.7 and 3 snails
22
cm ). Seven replicates and three formalin-killed controls were used at each density.
21 21 21 21
Mean ingestion rates were expressed as ng Chl a snail h and mg C snail h using a conversion ratio (C / Chl a) of 50 (De Jonge, 1980).
3. Results and discussion
21
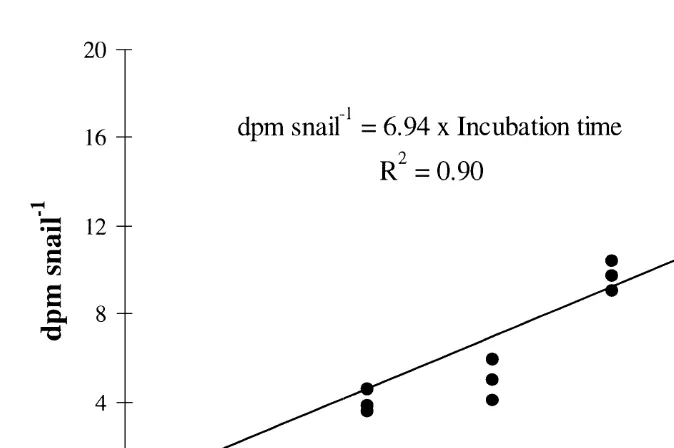
Fig. 2. Accumulation of radioactivity in the gut of H. ulvae (dpm snail ) offered radioactive food (benthic microalgae) as a function of time. The duration of the experiment was 2 h. The slope of the linear
21 21 accumulation represents the individual mean ingestion rate (dpm snail h ).
3.1. Controls
Results of experiment 1 confirm that labelled diatoms accumulated linearly in the gut of Hydrobia ulvae over 2 h (Fig. 2) in agreement with the main assumption of our method. Therefore, there was no evidence of a significant egestion of recently ingested radioactive material. This further indicates that the mean ingestion rate of H. ulvae on epipelic diatoms can be calculated over the same period of time. However, as the amount of ingested labelled diatoms is already high after 1 h (Fig. 2), the incubation time for experiments 3 and 4 was set to 1 h. This is slightly longer than the estimated 30–40 min for the gut residence time by Fenchel (Lopez and Kofoed, 1980).
14
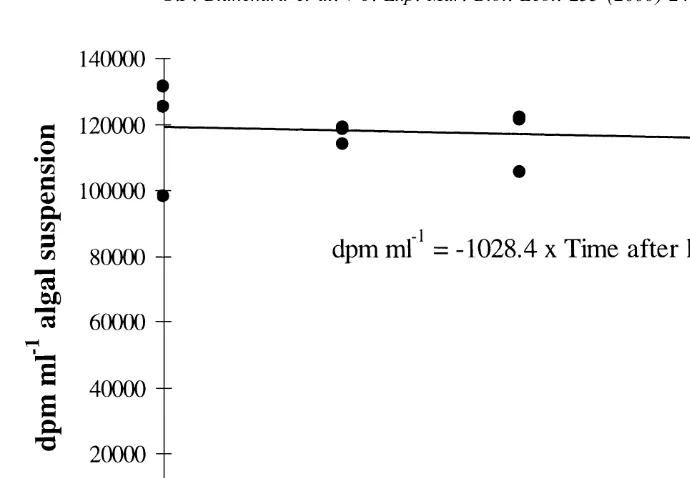
Results of experiment 2 show that the amount of C accumulated in labelled diatoms did not change during the 4 h following labelling (Fig. 3). The slope of the regression line is not significantly different from zero (P50.55). We thus conclude that radioactivi-ty was not lost from labelled diatoms during incubation with snails.
3.2. Effect of density on ingestion rate
22
When density was lower than 1.5 snails cm the ingestion rate was ca. 18 dpm
21 21 21 21
Fig. 3. Intracellular radioactivity monitoring during 4 h after labelling benthic microalgae. A fixed amount of 21 labelled microalgal suspension is filtered through GF / F filters and radioactive levels are reported as dpm ml suspension.
among treatments (P50.079); therefore, the density of H. ulvae seems to have a negative effect on individual ingestion rate on epipelic diatoms: there is apparently a
22
threshold effect between 1.4 and 2.5 snails cm . However, because of the lack of data
22
between 1.4 and 2.5 snails cm , we cannot state whether it is a stepwise decrease or a more smoothed drop in the individual ingestion rate; obviously, further investigations are necessary in this range of densities. Experiment 4 was carried out to provide an estimate of ingestion rate as a Chl a flux from microphytobenthos to mud snails (since in experiment 3 we only looked at relative ingestion rates and we expressed them as dpm
21 21
snail h ). As expected, the ingestion rate was significantly lower (t-test; P50.02) at
22 21 21
a density of 3 snails cm (22.3861.04 ng Chl a snail h ) than at a density of 0.7
22 21 21
snails cm (26.6461.14 ng Chl a snail h ), that is a 16% decrease (Fig. 5); this
21 21
amounts to ingestion rates of 1.12 and 1.33mg C snail h , respectively. These rates are consistent with those previously measured by Forbes and Lopez (1989): they found
21 21
rates in the range 0.506–1.174mg C snail h for Hydrobia truncata (Vanatta) fed on microalgae.
The depressed ingestion rates at higher densities in our microcosms are unlikely to be due to food limitation since calculations from experiment 4 show that only 0.4 and 1.2% of total microalgal biomass was ingested during the incubation by all snails at 0.7 and 3
22
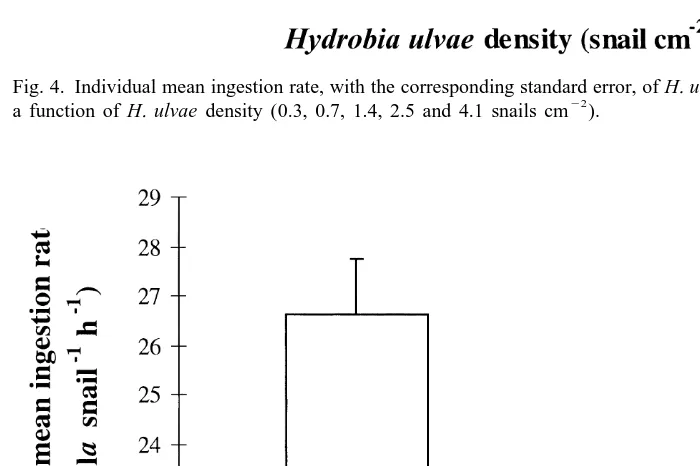
21 21 Fig. 4. Individual mean ingestion rate, with the corresponding standard error, of H. ulvae (dpm snail h ) as
22 a function of H. ulvae density (0.3, 0.7, 1.4, 2.5 and 4.1 snails cm ).
21 Fig. 5. Individual mean ingestion rate, with the corresponding standard error, of H. ulvae as ng Chl a snail
21 22
Table 1
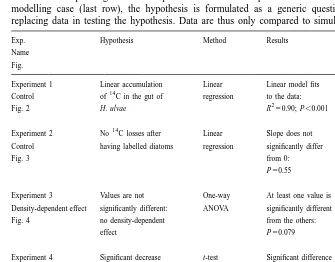
Synoptic table of the different hypotheses, tested by experiments, statistical methods and one model, and their corresponding results. Interpretations constitute important links between experiments. In the modelling case (last row), the hypothesis is formulated as a generic question since concepts are replacing data in testing the hypothesis. Data are thus only compared to simulations
Exp. Hypothesis Method Results Interpretation Name
Fig.
14 Experiment 1 Linear accumulation Linear Linear model fits No C egestion
14
Control of C in the gut of regression to the data: during 2 h 2
Fig. 2 H. ulvae R 50.90; P,0.001
14
Experiment 2 No C losses after Linear Slope does not No change in the specific Control having labelled diatoms regression significantly differ activity of labelled Fig. 3 from 0: diatoms during incubation
P50.55 time
Experiment 3 Values are not One-way At least one value is Apparently, a Density-dependent effect significantly different: ANOVA significantly different threshold effect
22 Fig. 4 no density-dependent from the others: around 1.5 snails cm
effect P50.079
Experiment 4 Significant decrease t-test Significant difference Confirmation of a between two densities P50.02
22 threshold effect (0.7 and 3 snails cm ) Fig. 5
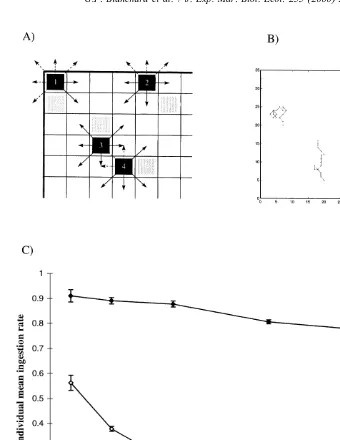
Modelling 1 Are collisions between snails, Individual-based Quantitative agreement Density-dependent effect Behaviour responsible for the observed model between observations is likely to come from Fig. 6 density-dependence effects? and simulated values collisions between snails
22
feeding behaviour of Hydrobia ulvae when its density increases up to 2–3 snails cm : there is an increase in climbing and emigration. Levinton (1979b) also observed that crawling and feeding rates of Hydrobia ventrosa were depressed with increasing density while floating increased. The latter was interpreted as an adaptation to escape crowded conditions.
We propose to develop a model to test whether it is possible to account quantitatively for the decrease in individual ingestion rate (with the threshold effect) when only very simple behaviours are considered. Such a model simply aims at supporting the reliability of our assumptions.
3.3. The behavioural model
distribut-ed. (2) Consequently, any physical contacts between snails — as an obstacle to crawling — may inhibit their activity for a short period of time; Levinton (1979a) indeed observed a decrease of the crawling rate of Hydrobia ventrosa as a function of crowding. It is then hypothesized that the increase in snail density will increase the probability of contacts between snails, hence, decrease their crawling rate as well as their individual ingestion rate during a fixed amount of time.
To test these hypotheses we have built an individual-based simulation model, discrete in space and time, where space is divided in cells; one cell can only support one individual, and each individual can move randomly from one cell to any of the adjacent ones with the same probability. It is called a random walk model using cellular automata formalism; such models have been largely used in marine ecology to estimate, e.g. particle dispersion (Okubo, 1975), animal behaviour (Lizon et al., 1998; Rosenberg et al., 1997; Keiyu et al., 1994) or the number of phytoplankton cell contacts in a turbulent flow (Yamazaki et al., 1991).
In the present case, the random walk is justified by the fact that individuals are maintained in a homogenous and unknown environment, of which they have a limited perception. We have derived from these conditions a number of basic rules for the motion of individuals in the two-dimensional space (Fig. 6A): (1) the probability for a snail to move to an adjacent cell is 1 / 7 since we assume that an individual does not crawl back to the cell it occupied at the previous time-step (actually, each individual keeps in memory the position of the previous two cells); (2) an individual will move only if the randomly chosen cell (random process) is not already occupied by another individual; (3) coprophagy on fecal pellets is not accounted for because duration of the experiment was too short for pellets to be produced, and fresh fecal pellets are not consumed by snails (Lopez-Figueroa and Niell, 1987); (4) boundaries of the simulated area are represented by the microcosm limits (the walls of the incubation flasks); (5) when the random walk of snails directs them towards and against a wall, they stop moving (hence grazing) until the random process brings them back within the simulated area (reflecting boundary conditions). This is consistent with the behavioural capabilities of Hydrobia ulvae as reported by Barnes (1981). Individuals are not allowed to escape definitely from the simulation area. The magnitude of this ‘wall effect’ is ca. 5% in terms of activity decrease (separate simulation not shown) and does not affect the relative change of individual ingestion rate as a function of mud snail density.
Another hypothesis which may be tested is that food accessibility could be limited; therefore, in a separate simulation, we have taken into account the fact that, when crawling, snails may create mucus tracks which prevent other snails from eating algal cells; this assumes to keep individual trajectories into memory where cells cannot be used for grazing any more.
21
crawling rate was assumed to be close to 0.2 cm min as found by Forbes and Lopez (1986) on a related species (Hydrobia truncata). This value corresponds to an equivalent distance of ca. 60 cells visited during the 1-h simulation time.
Fig. 6C presents simulations of the relative individual ingestion activity of snails as a function of snail density. The relative individual mean activity ranges from 1 (corre-sponding to the activity of one completely free individual in an unlimited open space) to 0 (corresponding to the absence of activity in a space where all cells are occupied by individuals). Thirty trials are performed for each density.
According to our hypotheses, the simulation (Fig. 6C, curve with full symbols) confirms the observed experimental results, that is a decrease of the individual ingestion rates as a function of mud snail density and, most important, in the same proportions (about 15%). Particularly, there seems to be a threshold effect between 1.4 and 2.5 snails
22
cm . This result is important insofar as it points out a non-trivial characteristic of the system already observed in experimentally-controlled conditions. This means that such a simple model, based only on a basic behavioural process, can account for a significant part of the observed phenomenon. So, it may be considered as an interesting tool for investigating the effect of behavioural processes on the feeding activity of H. ulvae, by integrating both quantitative and qualitative information. As a result, this model can further test the presumed effect of other processes, such as the limited access to microalgae due to the production of mucus tracks by mud snails (Fig. 6C, curve with open symbols): results clearly show that this hypothesis is unrealistic under our experimental conditions in microcosms since an exponential decrease of the individual ingestion rate is to be expected as a function of mud snail density.
4. Conclusion
Results show that under non-limiting food conditions, Hydrobia ulvae reduces its individual ingestion rate as a result of space limitation. Our behavioural hypothesis, as tested in the model, may explain the experimental results in our microcosms character-ized by homogenous conditions. However, the extrapolation to field conditions to assess the grazing pressure at the scale of the ecosystem and correlatively the possibility of H.
ulvae food-limitation — based on the measurement of individual mean ingestion rates —
is still difficult because of the heterogeneity of the mudflat at different temporal and spatial scales: additional mechanisms have to be investigated, e.g. interactions between snail feeding behaviour, the problem of pelletization of the sediment, diel rhythm of feeding activity, sediment characteristics and accessibility of food.
Acknowledgements
References
Admiraal, W., 1984. The ecology of estuarine sediment-inhabiting diatoms. In: Round, F.E., Chapman, G. (Eds.). Progress in Phycological Research, Vol. 3. Biopress, Bristol, pp. 269–322.
Barnes, R.S.K., 1981. Behavioural activities and ecological strategies in the intertidal gastropod Hydrobia
ulvae. In: Jones, N.V., Wolff, W.J. (Eds.), Feeding and Survival Strategies of Estuarine Organisms. Plenum
Publishing, pp. 79–90.
Bianchi, T.S., Levinton, J.S., 1984. The importance of microalgae, bacteria and particulate organic matter in the somatic growth of Hydrobia totteni. J. Mar. Res. 42, 431–443.
Blanchard, G.F., Cariou-Le Gall, V., 1994. Photosynthetic characteristics of microphytobenthos in Marennes-´
Oleron Bay, France: preliminary results. J. Exp. Mar. Biol. Ecol. 182, 1–14.
Cariou-Le Gall, V., Blanchard, G.F., 1995. Monthly measurements of pigment concentration from an intertidal ´
muddy sediment of Marennes-Oleron Bay, France. Mar. Ecol. Prog. Ser. 121, 171–179.
Colijn, F., De Jonge, V.N., 1984. Primary production of microphytobenthos in the Ems-Dollard Estuary. Mar. Ecol. Prog. Ser. 14, 185–196.
De Jonge, V.N., 1980. Fluctuations in the organic carbon to chlorophyll a ratios for estuarine benthic diatom populations. Mar. Ecol. Prog. Ser. 2, 345–353.
De Jonge, V.N., Colijn, F., 1994. Dynamics of microphytobenthos biomass in the Ems estuary. Mar. Ecol. Prog. Ser. 104, 185–196.
Fenchel, T., Kofoed, L.H., 1976. Evidence for exploitative interspecific competition in mud snails
(Hydro-biidae). Oikos 27, 367–376.
Fenchel, T., Kofoed, L.H., Lappalainen, A., 1975. Particle size selection of two deposit-feeders: the amphipod
Corophium volutator and the prosobranch Hydrobia ulvae. Mar. Biol. 30, 119–128.
Forbes, V.E., Lopez, G.R., 1986. Changes in feeding and crawling rates of Hydrobia truncata (Prosobranch:
Hydrobiidae) in response to sedimentary chlorophyll-a and recently egested sediment. Mar. Ecol. Prog. Ser.
33, 287–294.
Forbes, V.E., Lopez, G.R., 1989. The role of sediment particle size in the nutritional energetics of a surface deposit-feeder. I. Ingestion and absorption of sedimentary microalgae by Hydrobia truncata (Vanatta). J. Exp. Mar. Biol. Ecol. 126, 181–192.
Guarini, J.-M., Blanchard, G.F., Gros, Ph., Gouleau, D., Bacher, C., 2000. Dynamic model of the short-term variability of microphytobenthic biomass on temperate intertidal mudflats. Mar. Ecol. Prog. Ser. 195, 291–303.
Jensen, K.T., Siegismund, H.R., 1980. The importance of diatoms and bacteria in the diet of Hydrobia species. Ophelia 17, 193–199.
Keiyu, A.Y., Yamazaki, H., Strickler, J.R., 1994. A new modelling approach for zooplankton behaviour. Deep-Sea Res. (II Top. Stud. Oceanogr.) 41, 171–184.
Kofoed, L.H., 1975. The feeding biology of Hydrobia ventrosa (Montagu). I. The assimilation of different components of the food. J. Exp. Mar. Biol. Ecol. 19, 233–241.
Levinton, J.S., 1972. Stability and trophic structure in deposit-feeding and suspension-feeding communities. Am. Naturalist 106, 472–486.
Levinton, J.S., 1979a. Deposit-feeders, their resources, and the study of resource limitation. In: Livingston, J. (Ed.), Ecological Processes in Coastal and Marine Systems. Marine Science, Vol. 10, pp. 117–141. Levinton, J.S., 1979b. The effect of density upon deposit-feeding populations: movement, feeding and floating
of Hydrobia ventrosa Montagu (Gastropoda: Prosobranchia). Oecologia 43, 27–39.
Levinton, J.S., Bianchi, T.S., 1981. Nutrition and food limitation of deposit-feeders. I. The role of microbes in the growth of mud snails (Hydrobiidae). J. Mar. Res. 39, 531–545.
Lizon, F., Seuront, L., Lagadeuc, Y., 1998. Photoadaptation and primary production study in tidally mixed coastal waters using a Lagrangian model. Mar. Ecol. Prog. Ser. 169, 43–54.
Lopez, G.R., Kofoed, L.H., 1980. Epipsammic browsing and deposit-feeding in mud snails (Hydrobiidae). J. Mar. Res. 38, 585–599.
Lopez, G.R., Levinton, J.S., 1978. The availability of microorganisms attached to sediment particles as food for Hydrobia ventrosa (Montagu) (Gastropoda: Prosobranchia). Oecologia (Berlin) 32, 263–275. Lopez, G.R., Levinton, J.S., 1987. Ecology of deposit-feeding animals in marine sediments. Q. Rev. Biol. 62,
Lopez-Figueroa, F., Niell, F.X., 1987. Feeding behaviour of Hydrobia ulvae (Pennant) in microcosms. J. Exp. Mar. Biol. Ecol. 114, 153–167.
Lorenzen, C.J., 1966. A method for the continuous measurement of in vivo chlorophyll concentration. Deep-Sea Res. 13, 223–227.
Morrisey, D.J., 1987. Effect of population density and presence of a potential competitor on the growth rate of the mud snail Hydrobia ulvae (Pennant). J. Exp. Mar. Biol. Ecol. 108, 275–295.
Morrisey, D.J., 1988. Differences in effects of grazing by deposit-feeders Hydrobia ulvae (Pennant) (Gastropoda: Prosobranchia) and Corophium arenarium Crawford (Amphipoda) on sediment microalgal populations. II. Quantitative effects. J. Exp. Mar. Biol. Ecol. 118, 43–53.
Okubo, A., 1975. Diffusion and ecological problems: mathematical models. In: Biomathematics, Vol. 10. Springer-Verlag, Berlin.
Reise, K., 1985. Tidal Flat Ecology. An Experimental Approach to Species Interactions. Springer-Verlag, Berlin.
Riera, P., Richard, P., 1996. Isotopic determination of food source of Crassostrea gigas along a trophic ´
gradient in the estuarine bay of Marennes-Oleron. Estuar. Coast. Shelf Sci. 42, 347–360.
Rosenberg, R., Nilsson, H.C., Hollertz, K., Hellman, B., 1997. Density-dependent migration in an Amphiura
filiformis (Amphiuridae, Echinodermata) infaunal population. Mar. Ecol. Prog. Ser. 159, 121–131.
´ ´ ´
Sauriau, P.-G., 1987. Les mollusques non-cultives du bassin de Marennes-Oleron: quantification et repartition ´
geographique des stocks. Haliotis 16, 527–541.
´ ´
Sauriau, P.-G., Mouret, V., Rince, J.-P., 1989. Organisation trophique de la malacofaune benthique non cultivee
´ ´
du bassin ostreicole de Marennes-Oleron. Oceanol. Acta 12, 193–204.