6
NOSE Mitsuhiro
1. Introduction
In many developing countries the area of forest is continually decreasing. The accompanying degradation of the forest habitat occurs, too, despite efforts (selective logging) to prevent deforestation. Many difficulties arise due to the conflicting interests between shareholders and forest communities. The administrative sector was restricted from entering the protected area, though the local people continue to live there. But forest management policies have recently begun to address the needs of local forest-dwelling people.
Devolution policy has become increasingly common worldwide as a result of well-documented widespread abuses of centralized policy. In Indonesia this caused a great deal of confusion and resulted in increases in illegal logging (Kato, 2004). A recent study examines the relationship between devolution policy and forest management in China, India and the Philippines (David, et al., 2003). In the case of Indonesia, it would appear that devolution failed from the outset, because most stakeholders were unfamiliar with the changes in legislation.
After independence in 1947, India adopted federal systems and centrally-managed economy. The authority of the central government is considered to be relatively strong compared to other federal countries in the world (Sato, 1994). Trends in Indian forest policies were already reviewed at north state (Nagamine, 2002). The beginnings and problems of Joint Forest Management (JFM) were researched in this paper. It was already pointed that many Indian researchers have studied trends in forest policy and management (Masuda, et al., 2003). As described below, India has maintained its forest area statistically, whereas the area of natural forest has been in constant decline (Mazane, 2001). It suggests that various factors have resulted in the maintenance of forest area by afforestation and reforestation. But no previous studies have explored ways of maintaining the quality of forest habitats in India, particularly from a financial perspective.
2. Methods
This research was conducted from 7th to 26th, August 2004 in New Delhi, and Thiruvananthapuram, Kerala, India. Documents and statistical information were collected from the libraries of the administrative sectors and research institutes listed below. Staffs from these institutions were interviewed as part of this research.
New Delhi
1) Ministry of Environment and Forest 2) India Agricultural Research Institute 3) Tata Research Institute
Thiruvananthapuram
1) Kerala Forest and Wildlife Department 2) Centre for Development Studies
3. E conomic background in India
3.1 Historical overview
The Indian economy changed after the start of the Gulf War in 1990. In the 1980s, economic freedom policies had been introduced gradually (Kaneko, 1993) within each industry, i.e. the steel, chemical, electrical machinery, electronics and automobile industries. Increased freedom for import of technologies affected the dynamics of these industries. The central government charged the custom on imported products to promote the capital intensive industry, meanwhile they eased the import restriction of fundamental, intermediate and capital goods which were necessary for production. This policy led the industry’s dependence on various imported goods. At the same time, the rupee was devalued in the late 1980s, resulting in a decrease in exports and an increase in imports. Thus the deficit of current accounts brought about the expansion of financial deficit.
the trade deficit widened. Foreign currency reserves reached more than 10 billion dollars in 2003 due to a large amount of trade and revenue of emigration.
3.2 E conomic growth
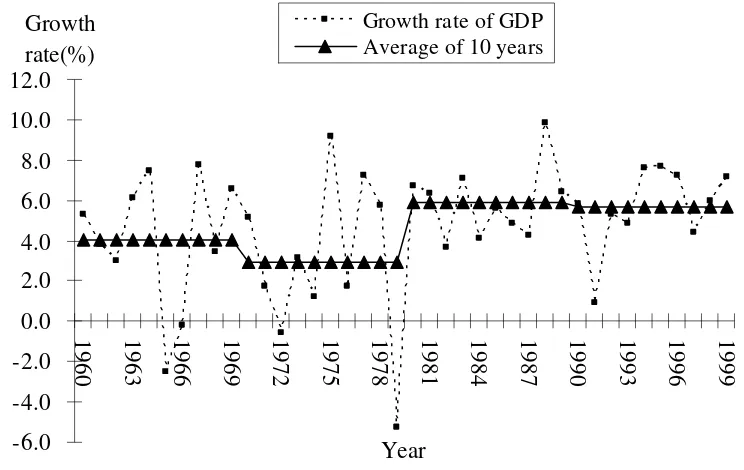
Gross Domestic Product (GDP) is affected directly and indirectly by the economic policy (Figure 6.1). In the 1960s and 1970s, GDP growth fluctuated greatly, as agricultural production was affected by an unstable climate. The famine occurred at several states until the 1970s. According to the t-test (r=0.05), the GDP growth rate between the 1970s and 1980s varied widely. From 1980 onwards, however, the GDP growth rate stabilized, ranging from 4 to 8%, with a few exceptions.
-6.0
-4.0
-2.0
0.0
2.0
4.0
6.0
8.0
10.0
12.0
1960
1963
1966
1969
1972
1975
1978
1981
1984
1987
1990
1993
1996
1999
Year
Growth
rate(%)
Growth rate of GDP
Average of 10 years
F igure 6.1. Growth rate of GDP and its average
Source: Centre for Monitoring Indian Economy (2004)
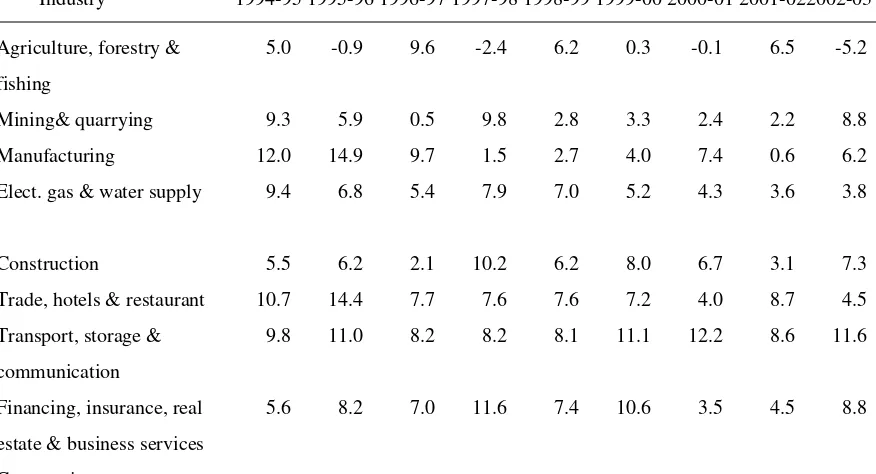
Table 6.1. Gross Domestic Product by Economic Activity (at constant (1993-94) prices)
Unit: %
Industry 1994-95 1995-96 1996-97 1997-98 1998-99 1999-00 2000-01 2001-022002-03
Agriculture, forestry & fishing
5.0 -0.9 9.6 -2.4 6.2 0.3 -0.1 6.5 -5.2
Mining& quarrying 9.3 5.9 0.5 9.8 2.8 3.3 2.4 2.2 8.8
Manufacturing 12.0 14.9 9.7 1.5 2.7 4.0 7.4 0.6 6.2
Elect. gas & water supply 9.4 6.8 5.4 7.9 7.0 5.2 4.3 3.6 3.8
Construction 5.5 6.2 2.1 10.2 6.2 8.0 6.7 3.1 7.3
Trade, hotels & restaurant 10.7 14.4 7.7 7.6 7.6 7.2 4.0 8.7 4.5 Transport, storage &
communication
9.8 11.0 8.2 8.2 8.1 11.1 12.2 8.6 11.6
Financing, insurance, real estate & business services
5.6 8.2 7.0 11.6 7.4 10.6 3.5 4.5 8.8
Economic growth in India has been uneven from state to state. Data for GSDP (Gross State Domestic Products) from the 1980s onwards is not readily available, but it is clear that growth rates differ from state to state (Figure 6.2). GSDP fell below zero three occasions in the 1980s because the proportion of agriculture and the allied service industries rose sharply to over 34% in 1986-87. As this figure fell below 30%, GSDP stabilized in the 1990s. This constant level of GSDP was brought about by an increase in the proportion of service industries, which by 1996-97 accounted for over half of all economic activities.
4. Public F inance of the F ederal and State Governments
4.1 Central Government
4.1.1. Huge increase in revenue receipts and revenue expenditure
The long-term budgets of the Central Government are given in Table 6.2 (Datt, R. et al., 2004), which shows the growth of receipts and disbursements for the past 50 years. From this table, the following trends can be seen.
Receipts and expenditure in both the revenue account and capital accounts have risen sharply. Revenue receipts showed a 30-fold increase in the 30-year period between 1950 and 1980 (Rs. 4.06 billion in 1950-51 to Rs. 128.3 billion in 1980-81). In the 21-year period between 1981 and 2002, revenue receipts showed a 15-fold increase (Rs. 128.3 billion to Rs. 201.45 billion).
Table 6.2. Budgets of the Central Government since 1950-51
Unit: Rs. billion
1950-51 1980-81 2001-02
Revenue Account
Receipts 406 12.83 201.45
Expenditure 3.47 14.54 301.61
Revenue surplus(+) +0.59
Revenue deficit(-) -1.71 -100.16
Capital Account
Receipts 1.20 8.77 161.00
Disbursements 1.82 9.63 60.84
Deficit/Surplus -0.62 -0.86 100.16
Over-all budgetary deficit -0.03 -2.57 Nil
4.1.2. Mounting deficit in the revenue account
Until the mid-1970s, current receipts exceeded current expenditure, resulting in a current account surplus, known as revenue surplus. However, the current expenditure has risen much faster than the current revenue account; for instance, in 1980-81, revenue deficit was 1.71 billion, rising to Rs. 100.16 billion in 2002. As a portion of GDP, the gross deficit of the Central Government in 2000-01 is estimated at 5.1% as compared to 8.2% during 1985-90 and 6.1% during 1991-96 (Machiraju, 2002).
4.2. States
A budget for each state is prepared annually (Datt, R et al., 2004). Table 6.3 shows a breakdown of budgets for all states since 1951-52. The rise in state revenue has been dramatic; in 1951-52 the figure stood at Rs. 3.96 billion, rising to Rs. 16.29 billion in 1980-81, and exceeding Rs. 237.95 billion in 2000-01. The most important reasons for this increase are:
1) An expansion in civil administration
2) Higher salaries and wages due to the rise in prices and the cost of living 3) An increase in the provision of government services.
Table 6.3. Current Revenues and Expenditure of the States
Unit: Rs. billion
1951-52 1980-81 2000-01
Revenue Account
Receipts 3.96 16.29 237.95
Expenditure 3.92 14.81 291.52
Revenue surplus(+) +0.04 +1.48
Revenue deficit(-) -53.57
Capital Account
Receipts 1.37 5.58 111.59
Disbursements 1.89 7.96 55.68
Deficit/Surplus -0.52 -2.38 +55.91
Over-all budgetary deficit -0.48 -9.00 +2.34
4.3 F inancial Relationship between the Central and State Governments
A complex budgetary system has evolved for the Central and State Governments in order to reduce the economic gap between individual states (Sato, 1994). The transfer of funds from the Central Government to individual states occurs in the following ways (Kaneko, 1994);
4.3.1. F inancial transfer through the financial committee-Non Plan Outlay
1) Tax sharing: a constant ratio except for personal income tax and federal consumption tax.
2) Grants-in-aid: the part which fulfills the gap between receipts and expenditure of each state as to tax sharing
4.3.2. F inancial transfer through the plan committee-Plan Outlay
1) Financial transfer in terms of a plan project approved by the Central Government (consisting of loans and subsidies)
4.3.3. Discretional transfer by the Ministries of Central Government-Plan Outlay
1) Central Sponsored Scheme (CSS) 2) Central Sector Scheme
4.3.4. F oreign support (free and charged)
India has received financial support from many international organizations. For example, the Japan Bank for International Cooperation (JBIC) provides concessional long-term, low-interest funds (ODA loans) for self-help efforts in developing countries (JBIC, 2004). The total of ODA loans has been estimated in the region of RS. 880 billion. This external assistance is passed on to the concerned states as Additional Central Assistance (ACA) in order to recast the original terms and conditions (Jain, 2004). ACA is given to the states on the same terms and conditions as Central Plan assistance, i.e. as 70% loan and 30% grant for general states. This system is sure to impose a financial burden on the Central Government.
5. F orest Legislation and Organization
5.1. Central Government
Since after the Government of India Act 1935, when forests were transferred to state government ownership and control, the main responsibilities of the Inspector General of Forests were to advise the Central Government on forestry matters and to supervise the operations of forest research institutes and colleges (Ministry of Environment & Forests, 1999). After independence in 1949, the role of the Central Government in the development of the forest sector increased considerably with the expansion of forestry activities through five-year plans and donor-supported projects.
Minister of State
Secretary
Divisions Associated Units Autonomous Agencies
F igure 6.3. Main Organization Chart of the Ministry of Environment & Forests (1987)
Source: Ministry of Environment and Forests (1988) Forest Survey and Utilization
Forest Conservation
Forest Research, Education and Training
Botanical Survey of India
Forest Survey of India
Zoological Survey of India
Central Board for Prevention & Control of Water Pollution
Forests have been deemed as a shared responsibility of the Central Government and the states since 1976 when the 42nd amendment of Indian Constitution was made (Nagamine, 2002). Until 1984, forestry at the Central Government level was the responsibility of the Department of Agriculture and Cooperation, Ministry of Agriculture. The Inspector General of Forests supervised implementation of forest policy, unification of state policy and forestry education (Shinohara, 1985). In 1984, the Ministry of Environment and Forests was formed in the Union Government and responsibility for forestry and wildlife matters were transferred to this ministry. A part of its organizational chart at that time is shown in Fig. 6.3. They had many divisions and Associated Units under the Secretary, of which only 4 divisions out of 16 appear to be directly related to forestry. This ministry manages both utilized and protected forest areas, wildlife conservation being the responsibility of another division. In addition to these divisions are numerous sub-divisions, Associated Units (supporting bodies) and Autonomous Agencies related to research activity, etc.
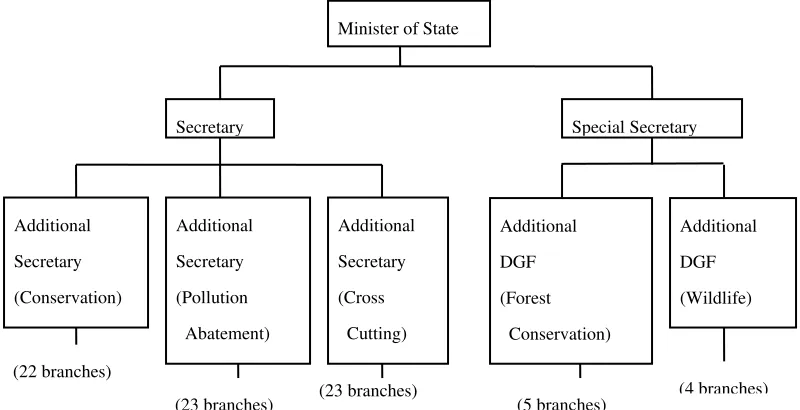
The Ministry of Environment and Forests has increased the number of divisions and branches with the expansion of its remit. The organization is divided into four parts, i.e., Conservation, Pollution Abatement, Cross Cutting, and Forest Conservation & Wildlife (Figure 6.4). A further division, the Forest Protection Division was created in the 1990s. Thepolicy support and review of forest policy is the responsibility of the Forest Policy division, a sub-division of the Department of Forest Conservation & Wildlife.
Minister of State
Secretary Special Secretary
F igure 6.4. Organization Chart of the Ministry of Environment & Forests (2003)
Source: Ministry of Environment and Forests (2004)
Prior to the change of organization, the Wildlife Protection Act was introduced in 1972 (Mohandas, 2001). At that time, many wild animals and birds had already become extinct and others were at imminent risk of extinction. The Wild Birds and Animals Act 1912, has become completely outmoded. The existing state laws are also outdated. Therefore, there is an urgent need for the introduction of comprehensive legislation
providing for the protection of wild animals and birds. The Forest Conservation Act came into effect in 1980 (Kaneko, 1994). Under this Act, an approval from the Central Government is required before any forestland (noted as such in government records) is diverted for non-forestry purposes. Current forest policy is articulated in the National Forest Policy, 1988, and has been extended to all states (Ministry of Environment & Forests 1999). Emphasis on “joint management” involving rural populations in forest management is encouraged, together with farm forestry and agro-forestry schemes on private land. Thus, these conservation measures were enacted at almost the same time as when the organization was changed to its present style.
5.2. Kerala State
Since 1950, forest management has become more evolved and systematic, with measures taken to control soil erosion, the appointment of a special officer for surveys and demarcation to address serious concerns over encroachment (PTR-KFD, 2003). The first step towards wildlife protection in the State was through the formation of the Bird Protection Committee in 1953, before the Central Government acknowledged the existence of any problem. The Kerala Forest Act was formulated for the entire state of Kerala in 1961. Under Article 3, the Kerala Government may assign any land as Reserved Forests (Mohandas, 2001). In addition, the Government may also exercise its powers in any forest or wasteland not at its disposal, e.g. burning or clearing of vegetation.
Principal Chief Conservator of Forest
Additional Principal Chief Conservator of Forest
F igure 6.5. Kerala Forest Department Organization Chart 2001-2002
Source: Kerala Forest Department (2004) Chief Conservator
(Administration)
Chief Conservator
(Vigilance)
Chief Conservator
(World Bank Project)
Chief Conservator (Development)
Chief Conservator (Social Forestry)
Chief Conservator
In 1966, the Game Department created in 1940 was merged with the Forest Department, becoming the KFD (KFD, 2003). The administration sector had three territorial areas, referred to as “circles”. The Evaluation and Vigilance Wing came under the control of the Chief Conservator of Forests in 1976 (Kerala Forest & Wildlife Department, 1976). Since its establishment, the KFD has grown, adding several divisions, such as Administration, Vigilance, and World Bank Project, controlled by the Principal Chief Conservator of Forest (Figure 6.5). The field organization of the KFD has divided the circles, establishing “divisions” and “ranges” (JICA, 2003). Each Chief Conservator of Forest supervises their respective field organization.
6. F orest F inance of the Public Sector
6.1. Central Government and States
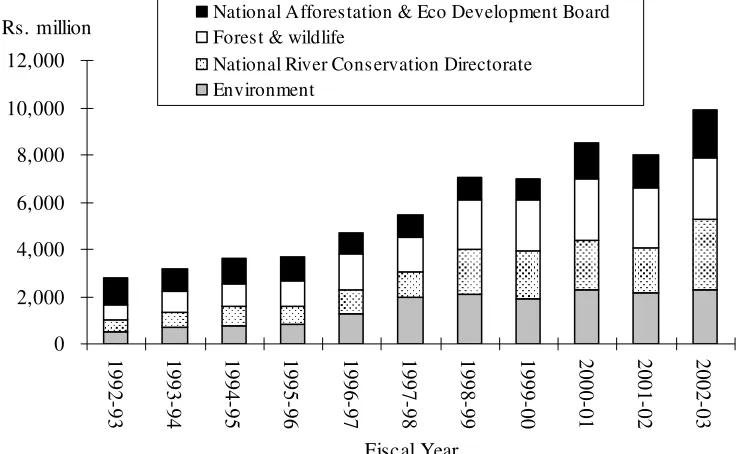
Financial support from the public sector is necessary to maintain forest resources and rural development. Budget planning is done for the fiscal year, which runs from April 1 to March 31(Ministry of Environment & Forests, 1999). It is desirable that funding is made available on time, and unspent funds carried over. If this does not occur, a rush to spend funds towards the end of the fiscal year is inevitable – a similar problem to that seen in Japan. However, according to a central government hearing, financial allocation is flexible enough for any surplus to move freely from one sector to another. The contents of the annual plan outlay for the Central Government are indicated in Fig. 6.6. Expenditure in 2002-2003 was approximately 3.6 times that for 1992-93 because of a favorable economic growth. The share of forest & wildlife has increased, whereas that for National Afforestation & Eco Development Board has fallen in the last decade.
0
Rs. million National Afforestation & Eco Development BoardForest & wildlife
National River Conservation Directorate Environment
F igure 6.6. Annual Plan Outlays
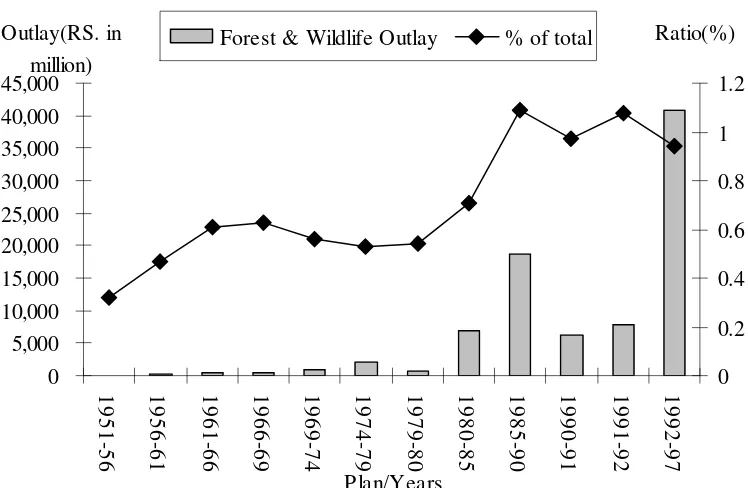
The main planning system in India covering all sectors is the Five Year Plan (Ministry of Environment & Forests, 1999). The system of five year plans (FYPs) started in 1951. Planning at the national level is the responsibility of the Planning Commission. The outlay for the Central Government was restricted in the 8th and 9th FYP (1992 and 1997). Outlay for forestry and wildlife under FYPs and annual plans are shown in Fig. 6.7. The outlay responsibilities are assigned to each state by the Indian Constitution (Mundle, 1997). A large share of central government spending is allocated to state governments, and this share has tended to rise over time. The figure shows that between the first and sixth FYPs, the percentage share of expenditure for forestry ranged from 0.32% to 0.71%, continuing to rise to over 1% during the seventh FYP (1985-1990). Expenditure for forest and wildlife was only Rs. 76 million in the first FYP in 1951, increasing to Rs. 40,820 million in the eighth FYP in 1992.
0 Forest & Wildlife Outlay % of total
F igure 6.7. Forestry under the Five Year Plans
Source: Ministry of Environment & Forests (1999)
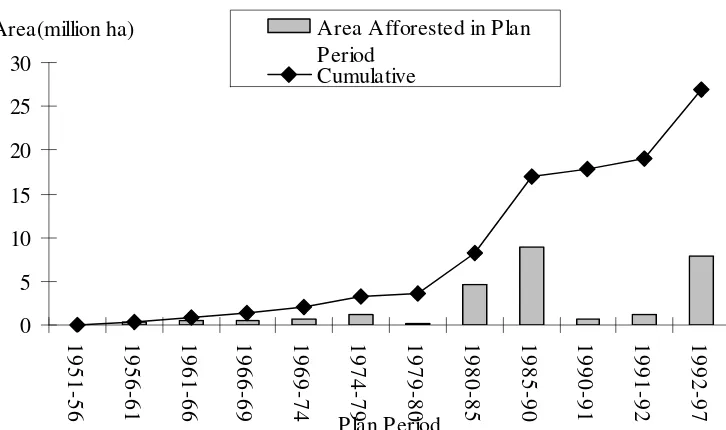
As public finance has increased, the area of plantation has risen correspondingly. The area of plantation for past plan periods is given in Fig.6.8. In the past 30 years, the cumulative total plantation was only 3.54 million ha while in the sixth plan alone, the area of plantation rose by 4.65 million ha. The introduction of internationally-aided social forestry projects (Ministry of Environment & Forests, 1999) enabled this sharp increase. As plan outlay increased steeply, the area of plantation increased almost at the same time. By contrast, in Thailand, the area of forests halved despite a rise in budget allocation for the forestry department up to the monetary crisis in 1997(Sato, 2002). It is thought that the authority of the Central Government is
0
Area(million ha) Area Afforested in Plan Period
F igure 6.8. Progress of Afforestation through Successive Plans
Source: Ministry of Environment & Forests (1999)
6.2. Kerala State
The outlay for forest and wildlife of the KFD increased consistently from the first FYP (Fig.6.9).
F igure 6.9. Outlay under different five year plans and annual plans
Source: Kerala Forest Department (2004)
since the 1960s (Fig.6.10), whereas this trend in plantation did not occur throughout the rest of India until the 1970s. Hardwood includes teak, rose-wood and mahogany, and softwood includes Eucalyptus, pine and rubber. In addition, the percentage of mixed plantation has increased since the 1980s, which is desirable.
0
area(ha) Hard Wood Soft Wood Mixed Plantation & other trees Other
10 15 20
F igure 6.10. Growth in the area under forest plantations in Kerala
Source: Kerala Forest Department (1992, 2003)
Note: Hard Wood indicates teak and mahogany, etc. Soft Wood indicates Eucalyptus and pine, etc.
0
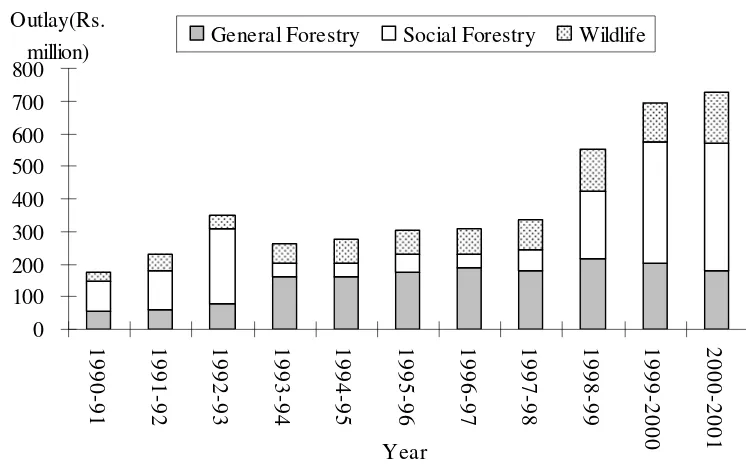
million) General Forestry Social Forestry Wildlife
F igure 6.11. Trends in outlay of Kerala forest department
Source: Kerala Forest Department (2003)
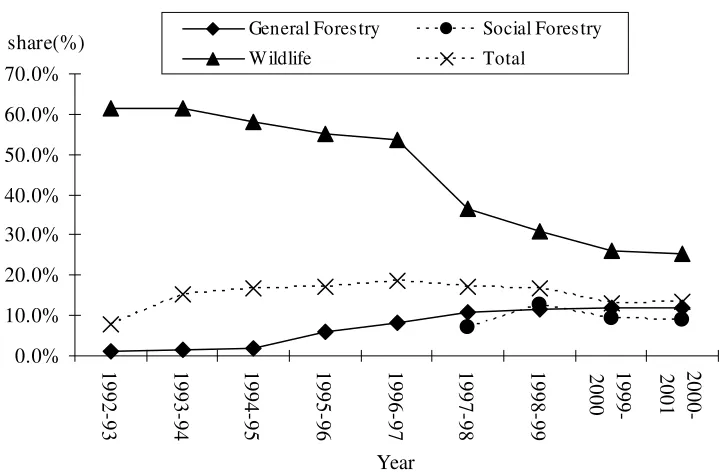
These expenditures are independent of state revenue, and is a fixed share of the CSS funding from the Central Government. The CSS was introduced to redress the imbalance between states. Individual central government ministries and state advisors decide which sector to allocate funds too. The percentage of the CSS funds by industry sector in the 1990s is indicated in Fig.6.12.
Source: Kerala Forest Department (2003)
"General forestry" raises the ratio gradually while "Wildlife" shows a gradually decreasing tendency According to a state hearing; financial assistance from the Central Government has decreased overall. "Social forestry" is funded by the World Bank so it has maintained its high level of funding.
7. Discussion
By contrast, Kerala State introduced a similar concept earlier than other states. The area of plantation has increased consistently since the 1960s as Kerala state has long recognized the importance of diverse forest habitats. The State Government was able to institute change because the federal system had been adopted in India, and the creation of forest resources was made possible by afforestation in Kerala. Moreover, in the latter half of the 1990s, expenditure on social forestry increased thanks to external funding. Further research is necessary to examine the financial relationship between administrative sectors and local bodies, as well as the activities and role of the panchayat in forest policy and management.
Acknowledgements
I must appreciate Dr. Sanjay Kumar and Mr. Sanjeev K. Chadha at Ministry of Environment & Forests, Mr. P. Prasada Babu and Mr. K. G. Mohanan Pillai at Department of Forest & Wildlife in Kerala. They cooperated with my research greatly, though they were busy for work. I wish to thank Associate Prof. Masuda Misa, who invited me to join the study project and gave me precious opportunities to research the Indian forest policy. I would also like to thank Associate Prof. Tani Yukako., Ms. Ellyn Kathalina Damayanti and Asano Sayaka. They went with me to the study site and gave me useful information. Mr. Inoue Tomofumi took care of us in New Delhi, while he was busy in daily work at Embassy of Japan in India. I can’t forget his hospitality. Ms. Tsujita Yuko, who is a researcher at the Institute of Developing Economies, was very kind in giving me statistical data and some fundamental hints to improve this paper. This research was completed thanks to the warmhearted assistance of the members of the laboratory in the University of Tsukuba.
References
Datt, R. and K. P. M. Sundaram, 2004. Indian Economy. S. Chand & Company LTD. New Delhi.
Edmunds, D. and E. Wollenberg, 2003. Local Forest Management: The Impacts of Devolution Policies. Earthscan Publishers. London.
JBIC, 2004. JBIC ODA Loans: Roles and Activities in India. Japan Bank for International Cooperation. Tokyo.
Jain, N. K., 2000. Report of the eleventh Finance Commission for 2000-2005. Special supplement No.3 of 2000 to JMJ Book Info. New Delhi.
KFD, 1976. Administration Report of the Forest Department: For the Year 1976-77. Kerala Forest & Wildlife Department. Thiruvananthapuram.
KFD, 2003. A Brief Outline of Biodiversity Conservation Strategy and Action Plan for Kerala. Kerala Forest & Wildlife Department. Thiruvananthapuram.
Kaneko, M., 1993. Indo ni okeru zaisei akaji sakugensaku to sono eikyo. The OECF research quarterly 79: 77-109. In Japanese.
chihou zaisei(zenpen). Study for Developmental Assistance 1(2): 111-142. Tokyo. In Japanese.
Kato, G., 2004. Forestry Sector Reform and Change in the Distribution of Natural Resource Rent. In Y. Sato (Ed.),
Reorganizing the Indonesian Economy: Structure, Institutions and Actors. The Institute of Developing Economies, Tokyo: 295-345. In Japanese.
Machiraju, H. R., 2002. Indian Financial System. Second Edition. Vikas Publishing House PVT LTD. New Delhi. Masuda, M. & J. Mishiba, 2003. Creation of Forest Reserves and Change of the Role in India.. Bulletin of Agricultural
and Forestry Research Center 19: 1-40. In Japanese.
Mazane, K., 2001. Kaihatsu to kankyou: Indo senjyuu-minnzoku, mou hitotsu no sentakushi wo motomete. Sekai Shiso-sha. Kyoto. In Japanese.
MoEF, 1999. National Forestry Action Programme India. Vol.1: Status of Forestry in India. Ministry of Environment & Forests. New Delhi.
Mohandas, T. P., 2001. Laws of Forests in Kerala. Shukla Law Agencies. Kochi.
Mundle, S., 1997. Public Finance: Policy Issues for India. Oxford University Press. New Delhi.
Nagamine, R., 2002. Dokuritsuikou no shinrin seisaku. In H. Yanagisawa (Ed). Gendai Minami Asia: 4. Kaihatsu to kankyou. Tokyo University Press. Tokyo. In Japanese.
PTR-KFD, 2003. India Ecodevelopment Project: Periyar Tiger Reserve – A General Introduction. Report #1. World Bank Mission: April – May 2003. Periyar Tiger Reserve – Kerala Forest Department. Thekkady.
Sato, H., 1994. Indo keizai no chiiki bunseki. Kokon-Shoin. Tokyo. In Japanese.
Sato, J., 2002. The Politics of Scarce Resources: Conservation and Development in Rural Thailand. Tokyo University Press. Tokyo. In Japanese.
Shinohara, T., 1985. Recent Indian Forestry I. Monthly Report of Forest Owner’s Association 282: 2-16. In Japanese. World Bank, 2004. Implementation Completion Report on a Credit to India for the Kerala Forestry Project. Report No: