Bambang Suprayitno
Fakultas Ekonomi, Universitas Negeri Yogyakarta e-mail: [email protected]
Abstract
This research investigates the trade creation and trade diversion of Indonesia manufactures import from extra and intra ASEAN countries after ASEAN economic integration. Using regression analy-sis, the study suggests that Indonesia manufactures import has been diverted from extra ASEAN countries both in short run and long run. In the short run, the ASEAN economic integration does not result in trade creation for Indonesia manufactures import from intra-ASEAN countries. This might stems from the insignificant difference Common Effective Preferential Tariff (CEPT) and Most Favoured Nation (MFN) tariffs and the existence of non-tariff barriers.
Keywords:Economic integration, trade creation, trade diversion, Indonesia manufactures
JEL classification numbers: F15, O14
INTRODUCTION
In the last two decades the economic poli-cies and studies associated with regional and global international trade policy were growing rapidly. It is characterized by bi-lateral cooperation among countries to im-prove the quantity and quality of interna-tional trade. The increasing awareness of the benefits as well as the costs of interna-tional trade and economic globalization has encouraged a number of neighbouring countries or within a region to form re-gional economic cooperation such as the ASEAN Free Trade Area (AFTA) and the Asia-Pacific Economic Cooperation (APEC). Through economic integration it is ex-pected to reduce or even eliminate the trade barriers, both tariff and non-tariff barriers (NTBs), which may exist between member countries. Thus, the mobility of goods and services as well as trade and investment between countries within a certain region becomes more increasingly and borderless.
Globalization opens new nuances in economic relations across countries in the world. This condition widens the possibil-ity for an economy to expand its market without being limited by geographical boundaries or territories. A European com-pany reaching Asian, Africa and Latin America markets or establishing production unit in its market area has raised the multi-national company. To some extent it boosts the world economy as well as domestic economy even though the benefits are largely still enjoyed by the country of ori-gins of the multinational company.
same time to capture the opportunities of these developments.
An open economy is inseparable from import activities. The gap of domestic consumption and investment could be met by importing foreign goods and services. In Indonesia the import is one of the most im-portant components in economic develop-ment especially in accelerating industriali-zation based-economic growth. This indus-trialization strategy was initially set to im-port substitution industries which its devel-opment cannot be separated from the wind-fall profits earned by the government due to the oil boom in the 1980s. In fact, however, the import substitution strategy had created high import dependence. Through the de-velopment of ASEAN economic integra-tion, Indonesia import is automatically af-fected by this development. The elasticity of import will change with respect to the various variables that influence import.
Based on those facts it is necessary to further study how the integration of ASEAN's influence is on the elasticity of the factors that affect ASEAN trade and invest-ment. The economic integration will allow
for the trade creation or trade diversion to-wards ASEAN countries. If there is an in-crease in the proportion of the trade from outside the region to the ASEAN countries then it is called as trade creation. In contrast, when there is diversion of trade from its original trade partner countries towards out-side the area then it is a trade diversion. This research will identify how the influence the ASEAN economic integration towards the import elasticity of influencing variables. In addition it will also be able to ascertain whether there is trade creation or trade di-version in Indonesia's manufacturing im-ports along ASEAN economic integration.
Import is a demand (consumption, investment and government spending) of domestic for foreign goods and services. The domestic demand is strongly influ-enced by its level of income. In a macro context, the level of income is known as the Gross Domestic Product (GDP), thus it di-rectly affects the import. This can be seen clearly when the crisis hit Indonesia in 1997-1998. Indonesia's import had de-creased drastically due to a decrease in real GDP of Indonesia (Figure 1).
0 1 0 0 2 0 0 3 0 0 4 0 0 5 0 0 6 0 0 7 0 0 8 0 0
1 9 8 0 1 9 8 5 1 9 9 0 1 9 9 5 2 0 0 0 2 0 0 5
M E X M IN M T O T
Notes: (1) Figures are in USD100 million, 2000 Constant Prices. (2) MEX is
Ex-tra ASEAN Imports, and MIN is Intra ASEAN Import.
Source: UN Comtrade.
The demand for foreign goods is also affected by the real exchange rate of the countries that conduct international trade activities. If the real exchange rate (IDR against USD) decreases or depreci-ates then the Indonesia's import value will drop substantially.
In a closed economy system in which no association with the foreign sec-tor, domestic expenditure is only met by consuming domestic goods and services. Therefore, private consumption (C), in-vestment (I), as well as government spend-ing (G) must be fulfilled by goods and ser-vices produced domestically. Consequently an excess domestic production or lack of domestic production will happen. In other words, there would be no goods and ser-vices from overseas or imports and there would be no domestic goods and services sent to abroad or exports.
In contrast to closed economy, when a country adopt an open economy system there will be changes in its macro economy. Demand for goods and services consist of domestic demand and foreign demand (X). In addition, absorption by do-mestic residents is not only for dodo-mestic aggregate demand (denoted Z) and domes-tic absorption (denoted A). Aggregate de-mand comes from domestic and foreign demand for domestic goods and services (Z = Yd + X). Meanwhile the domestic absorp-tion is the total demand of domestic goods and services from domestic and foreign goods and services (A=Yd+M) (De Grauwe, 1985). It is influenced by the amount of income (Y). The greater is the income, the greater is the demand for goods and ser-vices that directly affect the amount of im-port. Thus there is a positive relationship between level of income and the amount of imports.
In addition to income, real ex-change rate ( ) of a country also affects the amount of export and import. In the current international trade, foreign exchange is not only functioning as a medium of exchange but it is also treated as a tradeable com-modity. As a result, there is flexibility on the price of foreign currency. This price flexibility is indicated by the fluctuation in nominal exchange rate (e).
The fluctuation of exchange rate di-rectly does not affect on trade. However it depends on the price of domestic goods and foreign goods. When the exchange rate in-creases, the import does not automatically increase if the price of imported goods and services is increasing (foreign price index increases) or if the price of domestic goods and services is decreasing (domestic price index decreases). Thus, imports are more influenced by real exchange rate of the do-mestic currency against foreign currency rather than by the nominal exchange rate. In the real exchange rate already includes the nominal exchange rate and relative prices of domestic and foreign goods and services.
Real exchange rate ( ) is formulated by multiplying the nominal exchange rate (e in USD/IDR) with the ratio between the domestic price index (Pd) and the foreign price index (Pf) (Dornbusch and Fischer,
or in terms of IDR/USD the real exchange rate is
PdPf e. =
ε (2)
USD/IDR) decreases the price of foreign goods are more expensive thereby encour-aging domestic residents to reduce sumption of foreign goods or increase con-sumption of domestically produced goods (Dornbusch and Fischer, 1994, pp. 160). But when the exchange rate is in IDR/USD then the relation will be reversed or nega-tively related against imports. When the IDR/USD increases it indicates that IDR is depreciated so that it will reduce consump-tion of foreign goods.
In general, when some countries create regional economic integration it will create two effects namely trade diversion and trade creation. Trade diversion arises when the trade of the member countries divert to the third parties. In contrast, trade creation will affect economic activity in the area and boost the creation of income (SESRTCIC, 2000, pp. 71). The trade di-version will cause negative impacts for countries outside the region. In contrast the trade creation will lead to benefits for the members of the trade agreement.
An economic integration will pro-mote free trade area (FTA). The FTA in a region then allows for the diversion of trade from outside into the area. As revealed by Susastro (2004), an FTA could bring trade diversion. Because the application of pref-erential tariffs, the price of a good of mem-ber countries will be cheaper than the price of goods coming from outside FTA, even though their actual production costs are cheaper. So the FTA could lead to trade diversion. The theory says that trade diver-sion is a negative impact because of lower world economic welfare. Meanwhile, the benefit of FTA is because of trade creation. That is the FTA increase the trade both among the members and non members be-cause of efficiency increase. Further Susas-tro suggests that when the FTA policy was for granting special treatment rather than increasing efficiency and competitiveness, then the FTA only gives a negative impact.
The impact is a diversion of trade to the previous trading partners.
Trade diversion from the original partners who produce goods efficiently to trading partners of the FTA member that are inefficient will happen when the prices of goods and services in the region are cheaper. This occurs when the difference between in-ternal and exin-ternal tariff are large enough. However, trade diversion can not easily hap-pen, especially for economic integration of AFTA because the differences between AFTA preferential tariff and the MFN are not too large (Cosbey et al., 2004, pp. 31).
As revealed by Cuyvers et al. (2005), the AFTA raises questions about its contribution to social welfare. Most authors and other researchers agree that AFTA pro-vides more impact on political stability in the region. However, they have lack of agreement of a positive impact on the economy of the Southeast Asian region. Cuyvers et al. (2005) also state that the welfare gains are obtained more from natu-ral trading partners rather than from the member of AFTA. Furthermore, if the di-version of trade far exceeds the creation of trade within the region it will cause de-creasing economic welfare. The contribu-tion of inter-regional trade in ASEAN’s far exceeds the intra-ASEAN trade during the past three decades. Thus, theoretically the AFTA will likely lead to trade diversion effects of ASEAN countries.
ef-fect will appear when the barriers are re-duced due to substantially increase in the size of the market so that arises economies of scale, improved efficiency due to com-petition and increasing investment.
Basically, the AEC (ASEAN Eco-nomic Community) is same as a free trade area like other economic integration. With the globalization there will be freer mobility of economic factors. People often exagger-ate losses from globalization instead they realize the benefits of globalization.
Most part of the world including many Asian countries is benefited from globalization, but not for Africa (Soesastro, 2004). In Indonesia it is real fact that there are still a lot of poverty which is not reached by globalization or even their economy are crushed by globalization. However this negative impact is what is always highlighted. This could occur be-cause the positive impact of globalization is not concentrated but more spread. The cheaper air fare, easier enjoying the enter-tainment and news with the internet, easier obtaining scholarship, the proliferation of automobile workshops that would absorb a lot of labor, the emergence of brand motor-cycle manufacturers of China so we have many choices are all about positive impact of globalization. In fact it was possible that the fall of Suharto was considered as direct or indirect result of globalization.
The rapid economic cooperation of developed countries in Europe (European Union) and North America (North Ameri-can Free Trade Area or NAFTA) will result on difficulty for Indonesia because of vari-ous restrictions they apply for the outsiders of the region. Therefore, Indonesia, the Asia and Southeast Asia have the same in-terest to secure their domestic market in their region. It also should foster cohesive-ness of ASEAN countries to unify vision so as to seize the dominance of China export and investment as well as improving eco-nomic competitiveness.
Economically, the AEC opens a new market for Indonesia. Indonesia's ex-port markets in ASEAN countries are not more than 20 percent while the rest comes from outside the ASEAN region. Around 0-5 percent tariff scheme among ASEAN countries was in place since January 2002 and it was reduced to 0 percent for the six older ASEAN countries in 2010 and subse-quently in 2015 for the four new members. This condition will be largely benefited to Indonesia considering the number of multi-national companies like Unilever relocates its factory to Indonesia on the reason of cheaper labour costs. This multinational company can export goods to the ASEAN countries, thus it will increase the value of Indonesia’s exports.
A free trade area can not be sepa-rated from investment activities. As noted previously that the free area of the AEC is not only free trade in goods and services but it is also the mobility of factors of pro-duction. Capital is no exception. The inves-tors have authority to put capital in any countries which yield higher return under the supportive local or domestic regulation. This opportunity is widely opened to ASEAN countries. Investors will not dis-tinguish whether Indonesia is republics or Malaysia and Thailand that are monarchy. Investors just consider whether profitable or not if the capital is invested, in Indone-sia, MalayIndone-sia, Thailand, Singapore, or even Myanmar. The key to investment is the ef-ficiency and productivity.
Efficient bureaucracy, infrastruc-ture, supportive of business taxes, cheaper and productivity of labour, abundant natu-ral resources, and stable and conducive po-litical conditions are positive indicators for the investment target. This country is thus called as having a competitive advantage which is the advantage owned by a manu-facturer than the others because the goods produced have advantages over other simi-lar products (Robertua, 1995).
To supply goods and services to In-donesia, then companies like Unilever (which in fact is a Dutch company) does not have to produce goods in the Netherlands but it could produce in Indonesia. Moreover to supply goods to Indonesia does not need to set up factories in Indonesia if it is found to be inefficient. It could be in Vietnam or Malaysia. If Indonesia is able to attract mul-tinational companies to produce in Indonesia then Indonesia will benefit from this condi-tion. Tax revenues will increase resulting employment in the industry and other
re-lated industries. These industries that have linkages with multinational companies are not only as raw materials supplier or back-ward linkage industries but also the business sectors that have forward linkage like the insurance industry, transportation, distribu-tion, and so forth.
This is still questionable whether the merger of various countries in AFTA for the AEC will have little effect in im-proving economic welfare of the region. This happens due to too low difference be-tween the tariff level in AFTA (0-5 per cent with the CEPT scheme) and the MFN tariff (Cosbey et al., 2004). This little difference in real terms can be eliminated even by non-tariff barriers. The barriers arise when the institution related to the implementation of AFTA (customs, port authorities) do not perform well. As a result, various levies and complicated customs procedures will generate its own costs which amount is same as or even more than the normal tariff (MFN).
Table 1: CEPT Tariff
Country 1993 1994 1995 1996 1997 1998 1999 2000 2001 2002 2003 Brunai D. 3.78 2.64 2.54 2.02 1.61 1.37 1.55 1.26 1.17 0.96 1.04 Indonesia 17.27 17.27 15.22 10.39 8.53 7.06 5.36 4.76 4.27 3.69 2.17 Malaysia 10.79 10 9.21 4.56 4.12 3.46 3.2 3.32 2.71 2.62 1.95 Philippine 12.45 11.37 10.45 9.55 9.22 7.22 7.34 5.18 4.48 4.13 3.82
Singapore 0.01 0.01 0.01 0.01 0 0 0 0 0 0 0
Thailand 19.85 19.84 18.16 14.21 12.91 10.24 9.58 6.12 5.67 4.97 4.63 ASEAN6 11.44 10.97 10 7.15 6.38 5.22 4.79 3.64 3.22 2.89 2.39
Cambodia 10.39 10.39 8.89 7.94
Lao PDR 5 7.54 7.07 7.08 6.72 5.86
Myanmar 2.39 4.45 4.43 4.57 4.72 4.61
Vietnam 0.92 4.59 3.95 7.11 7.25 6.75 6.92 6.43
ASEAN10 7.03 6.32 4.91 5.01 4.43 4.11 3.84 3.33
Source: Secretary of ASEAN, in Hapsari and Mangunsong, 2006.
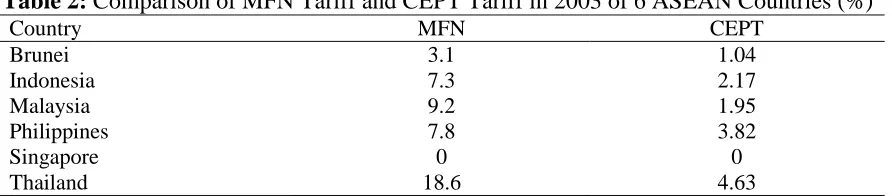
Table 2: Comparison of MFN Tariff and CEPT Tariff in 2003 of 6 ASEAN Countries (%)
Country MFN CEPT
Brunei 3.1 1.04
Indonesia 7.3 2.17
Malaysia 9.2 1.95
Philippines 7.8 3.82
Singapore 0 0
Thailand 18.6 4.63
Tables 1 and 2 show that the differ-ence between MFN and CEPT tariff rates is very low. It is only Thailand which im-poses large different rates (over 10 per cent) between MFN and CEPT. Some other weaknesses of the ASEAN free market are less consistency in implementing the agreement. Often there is a change the im-plementation of the free market that makes investors become disappointed and failed to plan their businesses. Until 2003, it was only Malaysia, Brunei, and Singapore that could reduce tariffs reaching 0 percent for 60 percent of the total products listed in the agreement, while Indonesia was able to re-duce tariff by 54.6 percent of total and Thailand only reduced 4.3 percent of the total. Until the end of 2006 it was only 65 percent of the products listed in the Inclu-sion List (IL) reaching 0 percent.
The highest tariff rates set in the CEPT is 5 percent which is still above the tariff of average industrial countries (as agreed in the Uruguay Round of WTO Meetings). Because there was no uniform-ity in the rates determined by some ASEAN countries, then in reality the free market of ASEAN was not a single free market. It is a free market that can be up to 45 kinds of agreement resulting from the various bilateral agreements (Ravenhill, 2007).
Previously, Cosbey (2004) also re-vealed that there was no direct relationship between free trade areas and the country's success in improving their economy. The most important key is the stability of eco-nomic and institutional or good governance in that country. It is also the elaboration and implementation of the agreement itself. To anticipate the inefficiency of a free trade area then there are some signs that highly related to the ASEAN free trade: First, In real terms, the difference in tariffs between MFN and trade area is very small given the persistence of non-tariff barriers that cause the same effect with high tariffs in the MFN; Second, amongst non-tariff barriers
are strict rules in the country of destination and large vested interest in certain traded goods; Third, there is large benefit from a cooperative relationship with remote trade areas such as ASEAN countries with the EC; Fourth, the agreement should be per-formed in a wide range rather than just fo-cusing on specific area; Fifth, the certainty of the gains from free trade area; and Sixth, the method or rule used in the free area that is as simple, liberal, and transparent as pos-sible.
The commitment to establish the AEC can be opportunity for Indonesia to become the economic leader in South East Asian region. In addition, the commitment of ASEAN economic cooperation can be used as a way to set up cooperative institu-tions like the IMF. In other words, this commitment could lead to the establish-ment of ASEAN IMF so that ASEAN countries can be more independent and not dictated by IMF.
Indonesia should be able to identify opportunities and challenges before joining AEC. Using SWOT analysis Indonesia can anticipate the obstacles and optimize the opportunities in order to survive from com-petition and open capital mobility. Here are some indicators of doing business that be-come part of a references to asses Indonesia SWOT. The data presented in Table 3 is from the data of Japanese companies doing business in several Asian countries which is at least explaining efficiency level of in-vestment.
Indone-sia and India. Managers and engineers in Thailand are paid 24 percent to 44 percent higher than that of in Indonesia. Mean-while, the mobility of professionals will be easier with AEC so that is very possible for Indonesia to have shortage of professionals. Indonesia position is actually very dominant given the human and natural re-sources abundance. With this condition, of course, Indonesia has the great economic
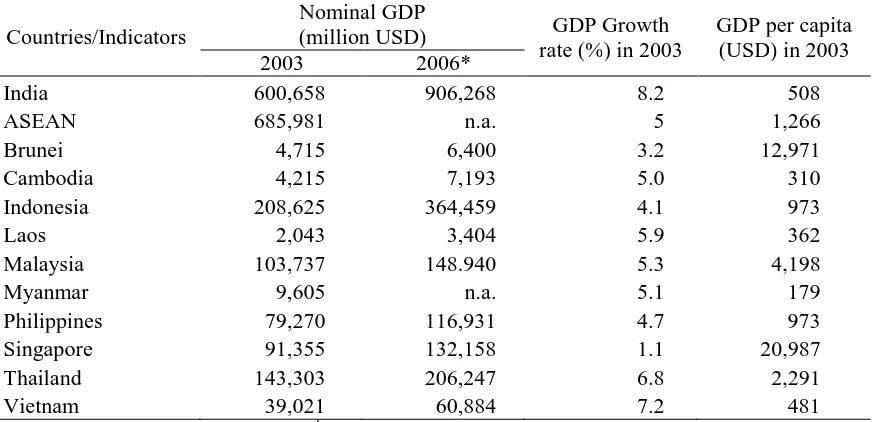
and political power and influence for the progress of ASEAN. This dominance of Indonesia's domestic economy is reflected in the share of Indonesia GDP of ASEAN which is approximately 30 percent. So the ASEAN's will be less developed without Indonesian economy (Plummer, 1996). Thus, the ASEAN economy depend a lot of on the progress of the Indonesian economy.
Table 3: Typical Costs of Japanese Companies
Countries /City Sanghai China Taipei China Thailand Bangkok Indonesia Jakarta HoChi Min Vietnam New Delhi India Monthly worker salaty
(USD) 153-261 749-1,308 163 108 101-134 138
Monthly middle
man-ager salary (USD) 593-985 1,729-2,838 671 540 524-661 753 Monthly middle
engi-neer salary (USD) 312-661 1,210-1,631 296 205 188-458 320 Rent for industrial
es-tate (USD/m2/month) 2.2 4.26 4.60 3.80-4.10 0.08 NA
Electricity Tariff for
Industry (USD/kwh) 0.03-0.10 0.05 0.04 0.04 0.05-0.07 0.08 Container Cost to Los
Angeles (USD/40 feet) 4,000 2,659 2,740 3,570 2,778 3,764 Source: Japan External, Trade Organization 2003.
Table 4: Macroeconomic Indicators, 2003 and 2006
Countries/Indicators (million USD) Nominal GDP rate (%) in 2003 GDP Growth GDP per capita (USD) in 2003
2003 2006*
India 600,658 906,268 8.2 508
ASEAN 685,981 n.a. 5 1,266
Brunei 4,715 6,400 3.2 12,971
Cambodia 4,215 7,193 5.0 310
Indonesia 208,625 364,459 4.1 973
Laos 2,043 3,404 5.9 362
Malaysia 103,737 148.940 5.3 4,198
Myanmar 9,605 n.a. 5.1 179
Philippines 79,270 116,931 4.7 973
Singapore 91,355 132,158 1.1 20,987
Thailand 143,303 206,247 6.8 2,291
Vietnam 39,021 60,884 7.2 481
Notes: * World Bank, September 14th, 2007.
METHODS
This paper analysed annual data from 1980 to 2005. The variables are Indonesia manufac-tures import from four major ASEAN coun-tries namely the Philippines, Singapore, Ma-laysia, and Thailand and from extra ASEAN, Indonesian GDP, and exchange rate of the relevant countries. Source of import data is from UN Comtrade, while the others are from International Financial Statistics.
The import model is a model as suggested by Dornbusch and Fischer (1994, pp. 161).
M = f (Y, R) (3)
M, Y, and R, is respectively imports, na-tional income represented by the GDP, the real exchange rate of IDR. Because the im-port is from outside ASEAN or extra-ASEAN imports and from extra-ASEAN coun-tries or intra-ASEAN imports, the model can be split into two models as follows. MEX = f (GDP, EREX), (4) and
MIN = f (GDP, ERIN), (5) where MEX, MIN, EREX, and ERIN are the extra-ASEAN imports, intra-ASEAN im-ports, the exchange rate of IDR against the currencies of ASEAN trading partners, and the exchange rate of IDR against the cur-rencies of intra-ASEAN trading partners, respectively. Thus the econometric models that will be estimated are
MEXt = a0 + a1GDPt + a2EREXt + et, (6)
and
MINt = b0 + b1GDPt+ b2ERINt + εt. (7)
The method of estimation is the Ordinary Least Square. This method will result in the Best Linear Unbiased Estimator or BLUE
(Gujarati, 1995, pp. 291). The models used in equations (6) and (7) are static equations in which both equations indicate long-term rela-tionship. When cointegration conditions are not met then the regressions are conducted on the difference variable such as MINt becomes
DMINt = MINt-MINt-1.
All variables in the model are coin-tegrated so that the ECM model will be used to show the relationship between short- term and long term.
DMEXt = 0 + 1DGDPt + 2DEREXt
+ 3ECTMEXt + t. (8)
DLMINt = 0 + 1DGDPt + 2DERINt
+ 5ECTMINt + t. (9)
The significant coefficient of difference variables ( 0, 1, 2, 0, 1, and 2) shows a short- term relationship. The coefficient 3 and 3 are significant indicating that the
model is indeed occurred error correction mechanism that will achieve long run equi-librium. Meanwhile, long-term coefficients will be obtained from the static model.
Thus when the cointegration condi-tions are met then the model will be esti-mated through two phases: the first is to es-timate the long-term model and the second is to estimate ECM model to obtain short-term model as well as to ensure the long-term equilibrium. ECTMEX and ECTMIN are the error correction terms that are the variable obtained from the first lag of long term resid-ual or error (-1) from equations (6) and (7) (Gujarati, 1995, pp. 728). The greater the a b-solute value of the coefficient of error correc-tion term, the more quickly is the long-term equilibrium happened because this coeffi-cient shows the speed of adjustment.
of manufactures (MEX model). While the
trade creation happens is indicated by the in-creased coefficient of GDP in manufactures
intra-ASEAN import models. In addition, to capture the structural changes will incorpo-rate the intercept dummy and slope dummy on the model estimates.
RESULTS DISCUSSION
The MWD test on the estimation of extra-ASEAN import model shows that both Z1 and Z2 are significant. It means that both log and linear models are indifference. However, if it is seen from the significance the Z1 is more significant than Z2. Thus it can be concluded that a log linear model is more appropriate for estimation. While in the selection of functional form model of intra-ASEAN imports is obtained that Z1 is significant while Z2 is not significant. So it can be concluded that the log linear model is more appropriate to estimate the model (Gujarati, 1995).
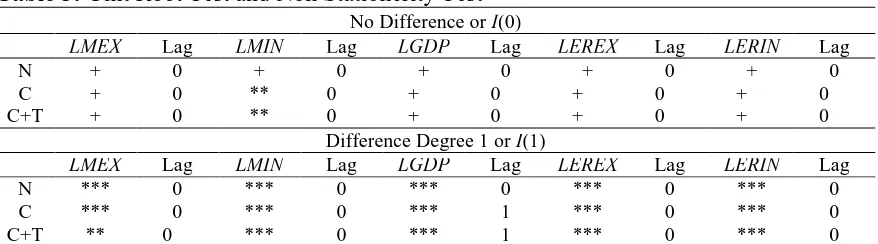
From Table 5 it can be seen that all variables used in the model are not station-ary with the exception of LMIN with 5%
significance level. Therefore, these vari-ables should be differentiated one degree to get these variables are integrated. After that all the variables become stationary.
Table 6 shows that both models of in-tra-ASEAN imports (denoted by LMIN) and
extra-ASEAN import (denoted by LMEX)
produce a stationary residual. This indicates that all variables used in both models are cointegrated even after using dummy
vari-ables produce a better level of stationarity. In the model LMIN, however, not all variables
have the same degree of integration. In con-trast, all variables of LMEX model have the
same one. Thus the LMEX model can obtain
long-term parameters (LR) and short-term
parameters (SR) while on the LMIN model
only get its SR parameters.
To obtain the long run parameter is by estimating the static LMEX model and
further doing diagnostic testing. This test is to see whether the classical assumptions are not violated. If its assumptions are met then the results of the estimation could eco-nomically be interpreted. Conversely when the assumptions are not met then the results only have statistical meaning. The results of estimation and diagnostic test are as pre-sented as follow, respectively.
LMEX = -2.68 +31.58DUM
(-0.68) (5.11)***
- 2.88DUM*LGDP + 2.68LGDP
(-4.15)*** (4.59)*** + 0.85DUM*LEREX
(1.21) –1.57LEREX
(-2.44)** (10)
R2 = 0.71, n = 26, Fstat = 9.57.
In equation (10), *, **, and *** indicate that the variables are statistically significant at 10%, 5%, and 1% level, respectively. Entries in parenthesis are the tstatistic. For the period of 1993-2005, DUM=1, and 0 otherwise.
Table 5: Unit Root Test and Non Stationerity Test No Difference or I(0)
LMEX Lag LMIN Lag LGDP Lag LEREX Lag LERIN Lag
N + 0 + 0 + 0 + 0 + 0 C + 0 ** 0 + 0 + 0 + 0 C+T + 0 ** 0 + 0 + 0 + 0
Difference Degree 1 or I(1)
LMEX Lag LMIN Lag LGDP Lag LEREX Lag LERIN Lag
N *** 0 *** 0 *** 0 *** 0 *** 0
C *** 0 *** 0 *** 1 *** 0 *** 0
C+T ** 0 *** 0 *** 1 *** 0 *** 0
Notes: (1) H0 = unit root. (2) Entries in *, ** and *** indicate that H0 is rejected at 10%, 5%, and 1% levels,
Table 6: Cointegration Test
Residual Unit Root Test No Difference or I(0)
LMEX Lag LMIN Lag
N ** 0 *** 0
Residual Unit Root Test With Dummy No Difference or I(0)
LMEX Lag LMIN Lag
N *** 1 *** 0
Table 7: Diagnostic Test for LMEX Model
Assumption Test H0 Result Indicator Remark
Non
Auto-correlation Breusch-Godfrey Serial Correlation LM Test and DW
Non- autocorrela-tion
OK Obs*R2 =7.3306
Prob=0.0256 Non Autocor-relation at 10% level
Homosce-dasticity White Heteroscedas-ticity Test Homosce-dasticity OK Obs* R
2=9.865986
Prob=0.361443 Non
Multi-collinearity Correlation of Inde-pendent Variable and R2 of Independent
Variable
OK Correlation =0.80
and partial R2 =
0,65
Non Multicol-linearity
Model Specifica-tion
Ramsey RESET Test Good OK Fstatistic=1.301845
Prob=0.296447 Normality JB test Normal Relatively
OK JBProb=0.0405 =6.4133
Tabel 8: Diagnostic Test for ECM Model of LMEX
Assumption Test H0 Result Indicator
Non
Autocorrela-tion Breusch-Godfrey Serial Correlation LM Test and DW
Non-autocorrelation OK Obs*R2=4.069071
Prob=0.130741 Homoscedasticity White Heteroscedasticity
Test Homoscedasticity OK Obs*R2=14.87601
Prob=0.188244 Non
Multicollin-earity Correlation of Independ-ent Variable and R2 of
Independent Variable
OK Correlation =0.80
and Partial R2=0,65
Model
Specifica-tion Ramsey RESET Test Good OK FProb=0.524153 statistic=1.291942
Normality JB test Normal OK JB=0.557332
Prob=0.756792
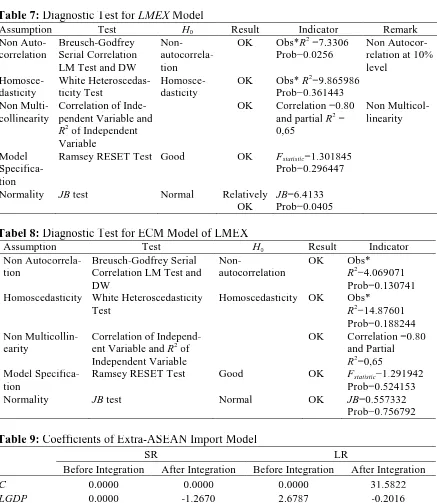
Table 9: Coefficients of Extra-ASEAN Import Model
SR LR
Before Integration After Integration Before Integration After Integration
C 0.0000 0.0000 0.0000 31.5822
LGDP 0.0000 -1.2670 2.6787 -0.2016
To obtain the short run parameters so it es-timates ECM models of LMEX.
D(LMEX)= -0.08 – 0.08DUM + 3.14D(LGDP)
(-0.68) (-0.55) (2.30)** – 1.27DUM*D(LGDP)
(-0.67)
– 0.93D(LEREX)
(-1.22)
+ 0.95DUM*D(LEREX)
(1.21)
– 0.81RSTATDUMLMEX(-1). (11)
(-3.56)***
R2 = 0.67 N = 25 Fstat = 6.01.
After model estimation, then it is per-formed diagnostic test. The diagnostic test results that model of extra-ASEAN imports meets the classical assumptions required thereby the coefficients can be inteIDR-reted economically (Table 8).
Based on those two estimations above (equation 9 and 10), the expected short run and long run parameters for extra-ASEAN import models are shortened in Ta-ble 9. It can be seen from TaTa-ble 9 that after the integration of ASEAN, the responsive-ness of Indonesian manufactures imports from extra-ASEAN countries to the GDP has changed both in the short run and long run. In the long run, the responsiveness change is very large and even changes the effect of GDP that would lead to reduction in imports
after the integration. Following the ASEAN integration the elasticity of Indonesian manu-factures import from extra-ASEAN countries with respect to exchange rates does not change either in the short run or long run. From this result it can be inferred that there is trade diversion of Indonesia manufactures import from extra-ASEAN countries in the short run and long run.
Because the variables of LMIN
model do not have the same degree of inte-gration then it is only obtained the short run parameters.
D(LMIN) = -0.06 – 0.07DUM
(-0.23) (-0.21) + 5.79D(LGDP)
(1.79)*
– 1.56DUM*D(LGDP)
(-0.40)
– 3.76D(LERIN)
(-1.90)*
+ 3.74DUM*D(LERIN). (12)
(1.82)*
R2 = 0.34, N = 25, Fstat = 1.95.
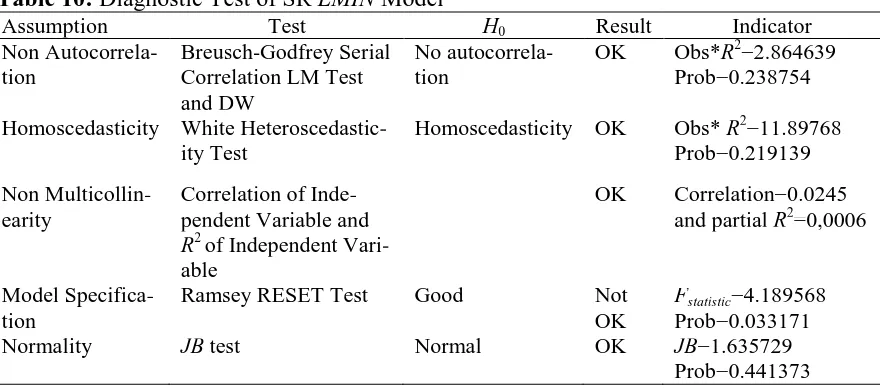
Meanwhile the diagnosis results show that the model is less precisely specified indi-cated by model specification test (Table 10). Thus it is necessary to investigate the relevant variables for the exactly model specification.
Table 10: Diagnostic Test of SR LMIN Model
Assumption Test H0 Result Indicator
Non
Autocorrela-tion Breusch-Godfrey Serial Correlation LM Test and DW
No
autocorrela-tion OK Obs*R
2=2.864639
Prob=0.238754 Homoscedasticity White
Heteroscedastic-ity Test Homoscedasticity OK Obs* R
2=11.89768
Prob=0.219139 Non
Multicollin-earity Correlation of Inde-pendent Variable and
R2 of Independent
Vari-able
OK Correlation=0.0245
and partial R2=0,0006
Model
Specifica-tion Ramsey RESET Test Good Not OK FProb=0.033171 statistic=4.189568
Normality JB test Normal OK JB=1.635729
To fix the model it firstly analyzes the data from the LMIN model. It is identi-fied that during 1980-2005 period there were important events concerning interna-tional trade in Indonesia i.e. the trade liber-alization in 1986 and monetary crisis in 1997. Trade liberalization in the 1980s was begun with the October Package 1986 in-troducing tariff to remove restrictive non-tariff barriers or quotas (Hill, 1996). This policy was continued by another policy package in January and December 1987, November 1998, May 1990, and June 1991.
6 8 10 12 14 16 18 20
1985 1990 1995 2000 2005
LMIN LERIN LGDP
Figure 2: Structural Break of Intra
ASEAN Import
0 10 20 30 40 50 60
1985 1990 1995 2000 2005
RMEX_MIN
Figure 3: Ratio between Extra-ASEAN
Import and Intra-ASEAN Im-port of Indonesia Manufactures From the graphs of LMIN, LERIN, and LGDP show that there are 3 different
LMIN trends in the interval 1980-1987, 1988-1997, and 1998-2005 (Figure 2). Thus, it exactly meets to the qualitative conditions which existed during that pe-riod. This conjecture is also supported by the graph of the ratio between MEX and MIN during the observation period, as de-picted in Figure 3.
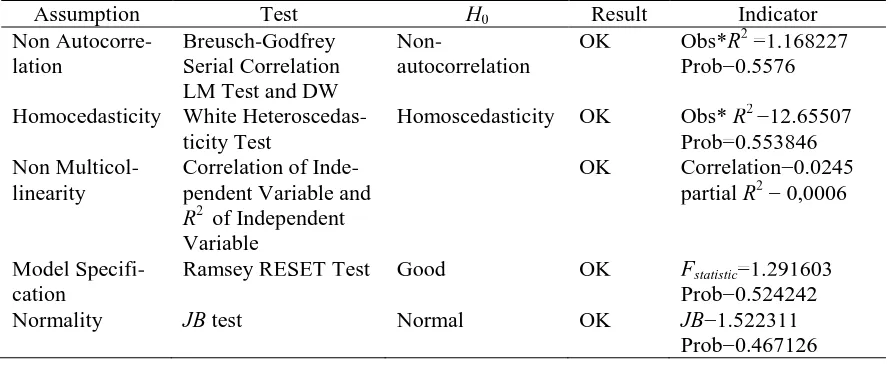
From the graphical analysis above it shows that the structural break of LMIN occurred approximately in 1987 and 1997. This is most likely because of economic liberalization (deregulation of the econ-omy) in 1987 and the crisis in 1997. From the analysis shows that economic integra-tion in 1993 has lagged response until in 1997. Thus, the model intra-ASEAN im-ports need dummy variables to distinguish the situation in 1980-1986, 1987-1996, and 1997-2005. Estimation result of Intra-ASEAN import model with structural break in 1986 and 1997 is:
D(LMIN) = 0.02 – 0.03D1 – 0.20D2
(0.08) (-0.04) (-0.59) – 8.56D1*D(LGDP)
(-1.01)
– 6.77D2*D(LGDP)
(-1.66)
+ 11.04D(LGDP)
(3.09)***
– 1.38D1*D(LERIN)
(-0.37)
+ 4.59D2*D(LERIN)
(1.91)*
– 4.58D(LERIN). (13) (-1.94) *
R2 = 0.57, N = 25, Fstat = 2.63.
Table 11: Diagnostic Test of LMIN Model with Structural Breaks
Assumption Test H0 Result Indicator
Non
Autocorre-lation Breusch-Godfrey Serial Correlation LM Test and DW
Non-autocorrelation OK Obs*R
2 =1.168227
Prob=0.5576 Homocedasticity White
Heteroscedas-ticity Test Homoscedasticity OK Obs* R
2 =12.65507
Prob=0.553846 Non
Multicol-linearity Correlation of Inde-pendent Variable and
R2 of Independent
Variable
OK Correlation=0.0245
partial R2 = 0,0006
Model
Specifi-cation Ramsey RESET Test Good OK FProb=0.524242 statistic=1.291603
Normality JB test Normal OK JB=1.522311
Prob=0.467126
Table 12: Coefficients of Short Run Intra-ASEAN Import Model
1980-1986 1987-1996 1997-2005
C 0 0 0
LGDP 11.0366 11.0366 11.0366
LERIN -4.5830 -4.5830 0.0105
From this result the responsiveness of Indonesian manufactures imports from ASEAN countries to GDP after ASEAN integration occurred only in a short-term. The magnitude does not change compare to before the integration of ASEAN. Mean-while the responsiveness of Indonesian manufactures imports from ASEAN coun-tries to exchange rate occurred only in a short-term and its magnitude changes in 4 years after the economic integration.
There is no trade creation of Indo-nesia manufacture import from ASEAN countries after the economic integration. It is because of three reasons. Firstly, the trade relations between Indonesia and the original/natural trade partners are too strong; secondly, the gap between CEPT and MFN tariffs are too small; and thirdly, the existence of non- tariff barriers amongst ASEAN countries.
CONCLUSION
Economic integration could have either trade creation or trade diversion. ASEAN economic integration does not have trade creation on Indonesia manufactures import from ASEAN countries. However, the eco-nomic integration has diverted the trade of Indonesia manufactures import from extra-ASEAN countries both in short run and long run. The challenge is then how to op-timize the ASEAN economic integration for benefits of ASEAN members especially Indonesia. It should take a concrete steps for tariff reduction up to 5% or even 0%. Not only tariff reduction, but it also elimi-nates the non-tariff barriers so that the real inter-ASEAN tariffs will not exceed the MFN tariff. In addition, to minimize the negative impacts of ASEAN economic in-tegration, Indonesia should have competi-tiveness favoured trade policies.
REFERENCES
Liberali-zation,” International Institute for Sustainable Development (IISD) and Interna-tional Development Research Centre (IDRC).
Cuyvers, L., P.D. Lombaerde and S. Verherstraeten (2005), ”From AFTA towards an ASEAN Economic Community and Beyond,” CAS Discussion Paper No 46, Janu-ary 2005.
De Grauwe, G. (1985), Macroeconomics Theory for the Open Economy, Hampshire, Gower.
Dornbusch, R. and S. Fischer (1994), Macroeconomics, 6th Edition, McGraw Hill, New York.
Gujarati, D.N. (1995), Basic Econometrics, 3rd Edition, International Edition, McGraw Hill, Singapore.
Hapsari, I.M. and C. Mangunsong (2006), “Determinants of AFTA Members’ Trade Flows and Potential for Trade Diversion,” Asia-Pacific Research and Training Network on Trade Working Paper Series, No. 21, November 2006.
Hil l, H. (1996), Transformasi Ekonomi Indonesia Sejak 1966: Sebuah Studi Kritis dan Komprehensif, PAU SEKP UGM, Yogyakarta.
Karmakar, S. (2005), ”India ASEAN Cooperation in Services-an Overview,” Working Pa-per No.176, November 2005, Indian Council for Research on International Eco-nomic Relations.
Plummer, M.G. (1996), ”The ASEAN Free-Trade Area: Backwards or Forwards,” CAS Discussion Paper No. 5, July 1996.
Ravenhill, J. (2007), ”Fighting Irrelevance: An Economic Community with ASEAN Char-acteristics,” Working Paper, 2007/3, RSPAS.
Robertua, V. (1995), Peningkatan Hubungan Ekonomi Politik Uni Eropa – Mercosur: Tin-jauan terhadap Penandatanganan Mercosur-EU Interregional Framework Co-operation Agreement 1995, http://portalhi.web.id, accessed on 8 January 2010. Sesrtcic, (2000), “Regional Economics Groupings of OIC Countries,” Journal of Economic
Cooperation, 21(2), 67-114.
Soesastro, H. (2004), ”Kebijakan Persaingan, Daya Saing, Liberalisasi, Globalisasi, Re-gionalisasi dan Semua Itu,” Economics Working Paper Series, March 2004, http://www.csis.or.id/papers/wpe082, accessed in 12 February 2010.