IDENTIFICATIONS OF CARCASS CHARACTERISTIC FOR ESTIMATING
THE COMPOSITION OF BEEF CARCASS
H. Hafid 1., R.E. Gurnadi2, R. Priyanto2 and A. Saefuddin3 1Department of Animal Husbandry, Faculty of Agriculture,
Haluoleo University, Kendari 93232 - Indonesi
2Department of Animal Production, Faculty of Animal Science,
Bogor Agricultural Universit, Jl. Agatis-Darmaga Campus, Bogor 16680 - Indonesia
3Department of Statistics, Faculty of Sciences,
Bogor Agricultural Universit, Darmaga Campus, Bogor 16680 - Indonesia Corresponding E-mail: [email protected]
Received Novemver 17, 2009; Accepted February 23, 2010
ABSTRACT
The research aimed to identify carcass characteristic that can be used for estimating composition of beef carcass. It was used 165 Brahman crossbred cattle in this research. Carcass characteristics were weight of a half cold carcass (WC) ranged from 96 to 151 kg, loin eye area (LEA) ranged from 22.09 to 304.8 mm2, 12th rib fat thickness (FT12) ranged from 0.80 to 2.90 mm, meat ranged from 53.55 to 90.10 kg and carcass fat ranged from 5.54 to 39.72 kg. Result showed that a half weight cold carcass as a single indicator major may be used to predict meat weight and carcass fat with regression linear equation: Meat (kg) = 10.64 + 0.49 WC (R2=0.728 and SE=3.58), and Fat (kg) = -21.70 + 0.36 WC** (R2=0.582 and SE=3.65). Multiple regression to predict meat weight based on fat percentage of kidney, pelvic and heart (KPH) was Meat (kg) = 7.99 + 0.58 WC** - 4.41 KPH** (R2=0.751 and SE=3.43).
Keywords: beef cattle, carcass characteristic, estimation.
INTRODUCTION
One of problems which high attention from people in area of meat industry is no finding in such a way for predicting carcass composition with high accuracy and without much fund. Failure for estimating carcass composition mainly on meat content in carcass can cause bias of “under estimate” and “over estimate”. Under estimate can lose out cattle producer (cattle feeder/fattener) and advantage consumer (butcher and retailer), while over estimate has a contrast characteristic, which is disadvantage consumer and advantage producer. It should motivate situation for developing meat industry, ideally, the consumer should pay for cattle prize appropriate with meat content of the carcass.
Murphey et al. (1960) stated that there is a correlation between measurement of sub-cutan fat thick on the 12th rib and meat on beef carcass. This is followed by amount of research showing the correlation between fat thickness on the 10th rib or the 12th rib towards content of carcass fat (Ramsay et al. 1962; Brungardt and Bray 1963; Butterfield 1965; Charles 1974; Priyanto et al,
1997).
Researcher attention for identifying and evaluating other position of beef carcass in which measurement of carcass fat thick as well as other carcass characteristic is possible used for estimating carcass composition (Johnson dan Vidyadaran 1981; Meehan dan Taylor 1988). Their studies concluded that many position of beef carcass in which measurement of fat thick can be conducted and given accurately carcass fat prediction.
Johnson and Ball (1988), and Ball and Johnson (1989) found that there was a correlation between fat thick on the 12th rib or rump position P8 and carcass production from a few various cattle. Hopkins et al. (1993) reported that effect of a relationship cattle species among measurement of fat thick using the 12th rib and rump P8.
Australian Commercial Crossbred. Those cattle were imported from Australia and used as feeder cattle for feedlot industry in Indonesia.
MATERIALS AND METHOD
The research was conducted in PT. Celmor Perdana Indonesia which operated Slaughtering House and Laboratory of Large Ruminant, Faculty of Animal Husbandry, Bogor Agricultural University-Bogor.
It was used 165 beef carcass of Crossbred Brahman Cattle (CBC) with feedlot fattening. The used cattle have slaughtered weight 434.03 ± 40.70 kg, with average age based on permanent teeth I1-I4. Cattle was slaughtered with Halal and acknowledged standardized procedure.
The skin was carefully taken out, especially on position of fat thick measurement was conducted. The measurement procedure was applied following guidelines of Taylor et al (1992). Recording for weight of meat, bone, and fat was carried out on carcass after storage for 24 hours in chilling room.
Analysis of simple linear regression and double regression (Gomez dan Gomez, 1984), was applied for predicting meat component and carcass fat. The weight of a half cold carcass (WC), loin eye area (LEA), fat thickness on the 12th rib (FT12) and fat percentage of kidney, pelvic and heart (KPH) with their combination used as fixed variable. The mathematical model used is:
Yij = a + BXij +
ε
ijYij = a + BlX1 + B2X2 + B3X3 + B4X4 +
ε
ij whereYij = Weight or percentage of carcass component
or commercial cutting
A0 = Intercept
B, B1, B2, B3, B4 = Regression coefficient of variable
Yi towards Xi
X1 = Weight a half cold carcass
X2 = Loin eye area
X3 = Fat thickness on the 12th rib
X4 = Fat percentage of kidney, pelvic and heart
ε
ij= Error
RESULTS AND DISCUSSION
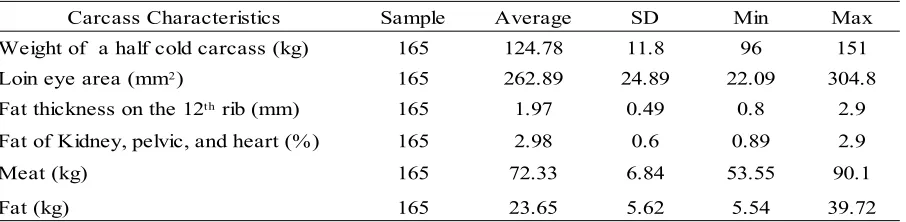
Carcass characteristic of Crossbred Brahman Cattle is presented in Table 1. Table 1 showed a representation of carcass characteristics (weight of a half cold carcass, loin eye area, fat thickness on the 12th rib, fat percentage of kidney, pelvic and heart, total weight of meat and total weight of carcass fat.
Determining alternative position of
carcass characteristic as indicator for meat
judging (cutability yield grade) was used WC,
measurements of LEA, FT12 and percentage
of KPH. The measurement of WC, width of
LEA, FT12 and percentage of KPH can be
shown in the Table 2 and Table 3.
Analysis of simple regression indicated that WC as single indicator (independent variable) was highly significant (P<0.01) related to meat weight with the accuracy level of R=72.8% and SE=3.58. Estimating fat showed highly significant with accuracy level of R=58.2% and SE 3.65.
The result indicated that weight of a half cold carcass as single indicator was dominant in predicting carcass content. It means that the more carcass weight, the more expected meat weight.
Carcass Characteristics Sample Average SD Min Max
Weight of a half cold carcass (kg) 165 124.78 11.8 96 151
165 262.89 24.89 22.09 304.8
165 1.97 0.49 0.8 2.9
Fat of Kidney, pelvic, and heart (%) 165 2.98 0.6 0.89 2.9
Meat (kg) 165 72.33 6.84 53.55 90.1
Fat (kg) 165 23.65 5.62 5.54 39.72
Table 1. Carcass Characteristic of Brahman Crossbred
Loin eye area (mm2)
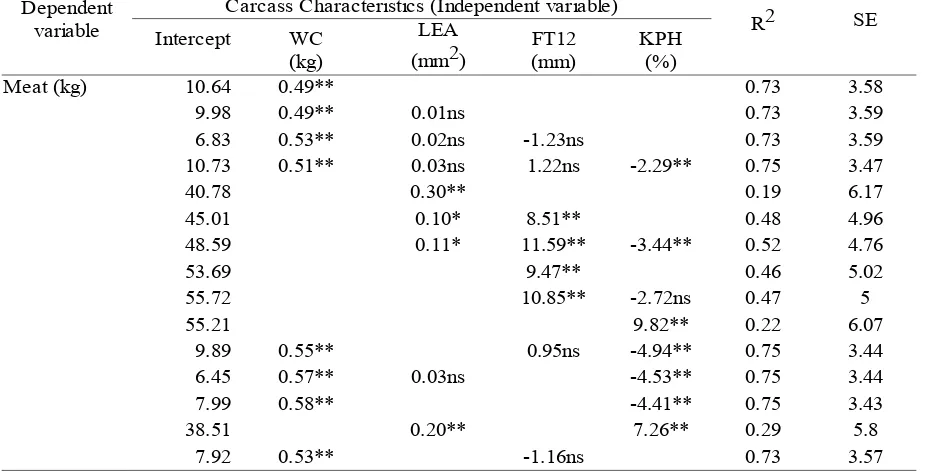
Table 2. Correlation between Carcass Characteristics and Meat Weight
Carcass Characteristics (Independent variable)
SE
Meat (kg) 10.64 0.49** 0.73 3.58
9.98 0.49** 0.01ns 0.73 3.59
6.83 0.53** 0.02ns -1.23ns 0.73 3.59
10.73 0.51** 0.03ns 1.22ns -2.29** 0.75 3.47
40.78 0.30** 0.19 6.17
45.01 0.10* 8.51** 0.48 4.96
48.59 0.11* 11.59** -3.44** 0.52 4.76
53.69 9.47** 0.46 5.02
55.72 10.85** -2.72ns 0.47 5
55.21 9.82** 0.22 6.07
9.89 0.55** 0.95ns -4.94** 0.75 3.44
6.45 0.57** 0.03ns -4.53** 0.75 3.44
7.99 0.58** -4.41** 0.75 3.43
38.51 0.20** 7.26** 0.29 5.8
7.92 0.53** -1.16ns 0.73 3.57
Dependent
variable Intercept WC R2
(kg)
LEA
(mm2)
FT12 (mm)
KPH (%)
*significant (p<0.05), ** hightly significant (p<0.01), ns: not significant, SE: standard error
Table 3. Correlation between Carcass Characteristics and Fat Weight
Carcass characteristics (Independent variable) SE
Fat (kg) -21.7 0.36** 0.58 3.65
-21.1 0.37** -0.01ns 0.58 3.66
-19.08 0.34** -0.01ns 0.79ns 0.58 3.66
-20.61 0.35** -0.02ns -0.18ns 0.90ns 0.59 3.66
2.07 0.20** 0.13 5.26
5.6 0.04ns 7.08** 0.43 4.27
5.48 0.04ns 6.98** 0.12ns 0.43 4.29
8.97 7.46** 0.43 4.27
6.48 5.76** 3.33* 0.44 4.23
6.22 10.00** 0.34 4.6
-20.79 0.33** -0.13ns 2.01ns 0.59 3.64
-19.52 0.33** -0.02ns 2.02ns 0.59 3.64
-20.53 0.33** 1.94ns 0.59 3.63
-0.72 0.08* 8.94** 0.35 4.55
-19.99 0.34** 0.73ns 0.58 3.65
Dependent
Variable R2
Intercept WC (kg)
LEA
(mm2)
FT12 (mm)
KPH (%)
The result of this research was in agreement to the report of Crouse and Dikeman (1976), Johnson and Davis (1983), and Priyanto et al. (1997) in which the carcass weight was indicator for predicting weight of total meat and fat. The same statement also reported by Abraham et al. (1968); Epley et al.(1970); Abraham et al. (1980); Miller et al. (1988) and Reiling et al. (1992).
The second alternative should be concerned as indicator was the fat thickness on the 12th rib resulting from highly significant correlation (P<0.01) with content of meat and fat (accuracy level of R=46.4% and SE=5.02 for meat, R=42.6% and SE=4.27 for fat). This research was in agreement to the research of Priyanto (1993) and Taylor et al. (1996) in which fat thickness on the 12th rib as an alternative indicator, excluding thick of sub-cutan fat rump P8.
An indicator is called accurate when it shows high coefficient and small error standard in
The equation of simple linear regression involving TLR12 as independent variable was:
Meat (kg) = 53.69** + 9.47 FT12** R=46.4% SE=5.02 Fat (kg) = 8.97** + 7.46 FT12**
R=42.6% SE=4.27
Analysis of multiple regression showed that combination of weight of a half cold carcass with fat percentage kidney, pelvic, heart indicated highly significant correlation (P<0.01) and was able to increase accurate prediction of meat yield. The obtained accuracy was R2=75.1% and SE=3.43. There was no significant correlation (P>0.05) for fat.
This results showed that weight of a half cold carcass and fat percentage of kidney, pelvic, and heart could be combined for predicting weight of meat. The obtained multiple regression for this combination was:
Meat (kg) = 7.99 + 0.58 WC** - 4.41 KPH** R2=75.1 SE=3.43
The important thing to be concerned in using the linear regression or multiple regression was avoiding bias (under estimated or over estimated). Therefore, it is beneficial to get information of cattle with its feed background. The use of the regression model will be more accurate when
which is come from fattening with grain feed. The bias in implementing the regression model on different feed background has been proven by Priyanto (1993).
CONCLUSION
The use of weight of a half cold carcass as single indicator is more possible for predicting total weight of meat and fat carcass components with better accuracy level. The regression model was:
Meat (kg) = 10.64 + 0.49 WC** Fat (kg) = -21.7 + 0.36 WC**
Analysis of multiple regression of combination among weight of a half cold carcass with fat percentage of kidney, pelvic, and heart caused the better accuracy as showed by equation: Meat (kg) = 7.99 + 0.58 WC** - 4.41 KPH**
ACKNOWLEDGEMENTS
This work was financed by BPPS Dikti Department of National Education RI. The authors would like to acknowledge the generous assistance of the abattoir staff and of the PT. Butler, O.D. 1968. Relationship of carcass weight, conformation and carcass measurements and their use in predicting beef carcass cutability. J. Anim. Sci. 27:604-610.
Abraham, H.C., Murphey, C.E., Cross, H.R., Smith, G.C. and Frank, W.J.Jr. 1980. Factor affecting beef carcass cutability: An evaluation of the U.S.D.A. yield grade for beef. J. Anim. Sci. 50:841-851.
Ball, B. and Johnson, E.R., 1989. The influence of breed and sex on saleable beef yield. Aust. J. Exp. Agric. 29:483-487.
Brungardt, V.H. and Bray, R.W. 1963. Estimated of retail yield of the four major cuts in the beef carcass. J. Anim. Sci. 22:177-182. Butterfield, R.M., 1965. The relationship of
Charles, D.D. 1974. A method of estimating carcase component in cattle. Res. Vet. Sci. 16:89-94.
Crouse, J.D. and M.E. Dikeman. 1976. Determinates of retail products of carcass beef. J. Anim. Sci. 42:584.
Epley, R.J., H.B. Hedrick, W.C. Stringer and D.P. Hutcheson. 1970. prediction of weight percent retail cuts of beef using five carcass measurements. J. Anim. Sci. 30:872.
Gomez, K.A. and A.A. Gomez.1984. Statistical Procedures for Agricultural Research. 2nd Edition. John Wiley & Sons, Inc., Singapore.
Hopkins, D.L. Brooks, A.A. and Johnston, A.R. 1993. Proocedings Australian Meat industry Research Conference, Gold Coast, Session pp. 7-9.
Johnson, E.R.,1987. Comparison of twelfth rib and rump fat thickness measurement for predicting commercial beef yield in local market carcasses. Aust. J. Exp. Agric. 27:613-617.
Johnson, E.R. and Ball , B., 1988. An evaluation of rump P8 and twelfth rib fat thickness measuring sites for estimating saleable beef yield in export and local carcasses. In: Proceeding of the 34th International Congress of Meat Science and Technology, pp. 71-73, Brisbane.
Johnson, E.R. and C.B. Davies. 1983. A caliper for determining carcass composition in live cattle and skin on carcasses. Aust. J. Agric. Res. 34:825-832.
Johnson, E.R. and Vidyadaran, M.K., 1981. An evaluation of different sites for measuring fat thickness in the beef carcass to determinate carcass fatness. Aust. J. Agric. Res. 32:999-1007.
Meehan, D.P. and Taylor, D.G., 1988. A comparison of positions for fat thickness measurements on beef carcasses. Proc. Aust. Soc. Anim. Prod. 17:440.
Miller, M.F., H.R. Cross, J.F. Baker and F.M. Byers. 1988. Evaluation of live and carcass techniques for predicting beef carcass composition. Meat Sci. 23:111.
Murphey, C.E., Hallet, D.K., Tyler, W.E., and Pierce, J.C. Jr., 1960. Estimating yields of retail cuts from beef carcasses. J. Anim. Sci. 19:1240 (Abstr.)
Priyanto, R., 1993. A study of the growth and distribution of beef carcass tissues including their prediction, optimum beef productivity and marketing. PhD Thesis, The University of Quensland.
Priyanto, R., E.R. Johnson and D.G. Taylor. 1997. Prediction of carcass composition in heavy-weight grass-fed and grain-fed beef cattle. Anim. Prod. 57:65-72.
Ramsay, C.B., Cole, J.W. and Hobbs, C.S., 1962. Relation of beef carcass grades, proposed yield grades and fat thickness to separable lean, fat and bone. J. Anim. Sci. 21:193-195.
Reiling, B.A., G.H. Rouse and D.A. Duello. 1992. Predicting percentage of retail yield from carcass measurements, the yield grading equation and closely trimmed, boxed beef weight. J. Anim. Sci.70:2151-2158.