BENCHMARKING HIGH DENSITY IMAGE MATCHING
FOR OBLIQUE AIRBORNE IMAGERY
S. Cavegn a, b, N. Haala b, S. Nebiker a, M. Rothermel b, P. Tutzauer b
a
Institute of Geomatics Engineering, FHNW University of Applied Sciences and Arts Northwestern Switzerland, Muttenz, Switzerland - (stefan.cavegn, stephan.nebiker)@fhnw.ch
b
Institute for Photogrammetry, University of Stuttgart, Germany - (norbert.haala, mathias.rothermel, patrick.tutzauer) @ifp.uni-stuttgart.de
Commission III, WG III/1
KEY WORDS: Image, Matching, Aerial, Point Cloud, Reference Data, Analysis, Comparison, Accuracy
ABSTRACT:
Both, improvements in camera technology and new pixel-wise matching approaches triggered the further development of software tools for image based 3D reconstruction. Meanwhile research groups as well as commercial vendors provide photogrammetric software to generate dense, reliable and accurate 3D point clouds and Digital Surface Models (DSM) from highly overlapping aerial images. In order to evaluate the potential of these algorithms in view of the ongoing software developments, a suitable test bed is provided by the ISPRS/EuroSDR initiative Benchmark on High Density Image Matching for DSM Computation. This paper discusses the proposed test scenario to investigate the potential of dense matching approaches for 3D data capture from oblique airborne imagery. For this purpose, an oblique aerial image block captured at a GSD of 6 cm in the west of Zürich by a Leica RCD30 Oblique Penta camera is used. Within this paper, the potential test scenario is demonstrated using matching results from two software packages, Agisoft PhotoScan and SURE from University of Stuttgart. As oblique images are frequently used for data capture at building facades, 3D point clouds are mainly investigated at such areas. Reference data from terrestrial laser scanning is used to evaluate data quality from dense image matching for several facade patches with respect to accuracy, density and reliability.
1. INTRODUCTION
Benchmarks have proven to be extremely useful in order to document the rapid progress of software tools for image based 3D point cloud generation. Such tools are currently developed by a number of research institutes and photogrammetric software vendors. The basic scope of the joint EuroSDR/ISPRS initiative Benchmark on High Density Image Matching for DSM Computation is the evaluation of 3D point clouds and DSM produced from aerial images with different software systems. Originally, the benchmark covers data from two image blocks captured with standard photogrammetric camera systems. While these data sets are used to evaluate the potential of software systems to generate DSM from nadir imagery (Haala, 2014) this paper introduces an additional test scenario, which has been set up to investigate the potential of high density image matching for oblique airborne imagery.
1.1 Dense image matching with oblique airborne imagery
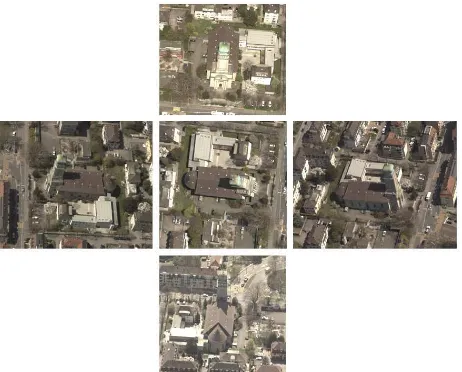
In recent years, there has been an increasing demand for oblique imagery. One example is the integration of oblique images in global map services, such as Google Maps, not only for visualisation purposes but also for 2.5D or 3D information extraction. Due to the oblique views even building facades and other vertical objects as well as building footprints are represented in the imagery (see Figure 1). An overview of the considerable number and variety of current oblique aerial cameras is given in Lemmens (2014a) and Lemmens (2014b).
Triggered by Hirschmüller (2008) many dense image matching (DIM) solutions have been developed in the last few years. While Haala (2013) presents a comparison of results from 10 DIM solutions which were generated by the participants of the benchmark on high density image matching for DSM computation, other publications investigate a smaller number of DIM algorithms. In contrast to the aforementioned analysis of DIM on nadir aerial imagery, Deuber (2014) and Cavegn et al. (2014) investigated DIM on oblique aerial imagery. The applicability of DIM to close range applications is, for example, discussed in Kersten & Lindstaedt (2012) and Dall'Asta & Roncella (2014). The emphasis of Hosseininaveh Ahmadabadian et al. (2013) is placed on the comparison of DIM algorithms for scaled surface reconstruction. Another extensive evaluation which comprises four DIM solutions and eight data sets is presented by Remondino et al. (2014).
Dense image matching offers a great potential for the automatic extraction of urban 3D models when applied to airborne oblique imagery. However, so far only few studies have been addressing this issue (e.g. Gerke 2009, Fritsch & Rothermel 2013, Rupnik et al. 2014). Applying DIM algorithms to oblique imagery introduces some major new challenges such as large scale variations due to a higher depth of field, greater illumination changes and multiple occlusions. Rothermel et al. (2012) overcome the significant increase in disparity search space and the resulting higher processing time and memory requirements by employing a modified SGM method called tSGM. Their method determines the search space for every pixel individually using a pyramid based multi-resolution approach. A higher degree of noise and a lower point cloud density are especially expected in shadow areas.
Figure 1. Church building in the benchmark area captured from all four oblique directions and the nadir view
1.2 Existing benchmarks
The first benchmark which has been comparing two-frame stereo correspondence algorithms is the Middlebury Stereo Vision Page (Scharstein & Szeliski, 2002) which was established more than a decade ago. The close-range images were taken in a laboratory environment and the reference data was captured with an active stereo system. Seitz et al. (2006) initiated a benchmark for the comparison and evaluation of multi-view stereo reconstruction algorithms whose reference data was acquired with a laser stripe scanner. Another multi-view stereo benchmark with outdoor scenes was launched by Strecha et al. (2008). The imagery of a fountain was used by Dall'Asta & Roncella (2014) and Remondino et al. (2014) to compare DIM algorithms. While Dall'Asta & Roncella (2014) evaluated shape differences between the reconstructed and the reference terrestrial laser scanning (TLS) DSM, Remondino et al. (2014) compared the raw DIM point clouds against a TLS meshed model by means of Euclidean distances. Aiming at reducing algorithm overfitting, real outdoor scenes were captured for the KITTI vision benchmark suite (Geiger et al., 2012) which also includes a stereo benchmark. Several street sections were recorded with a mobile mapping platform and reference data was determined with a Velodyne HDL-64E laser scanner.
Inspired by the computer vision community there has been an increasing number of benchmarks in the photogrammetry domain. Reinartz et al. (2010) designed a benchmark and quality analysis of DEM generated from high and very high resolution optical stereo satellite data based on 2.5 m Cartosat-1 imagery and 0.5 m Worldview-1 imagery of a region in Catalonia, Spain. Three test regions covering city areas, rural areas and forests in flat and medium undulated terrain as well as steep mountainous terrain were defined. There are two reference DSMs available, one captured by LiDAR and the other one derived by airborne stereo imagery. The German society of Photogrammetry, Remote Sensing and Geoinformation (DGPF) organised the test on the performance of photogrammetric digital airborne camera systems (Cramer, 2010). Within this project, the potential of photogrammetric 3D data capture using automatic image matching was demonstrated in comparison to airborne laser scanning (Haala et al., 2010) and the data sets were further used by Haala & Rothermel (2012) for the evaluation of DSMs generated by DIM. Two flight subsets were
then exploited for the EuroSDR nadir airborne benchmark which was launched in 2013. First results were presented in Vienna in June 2013 (Fritsch et al., 2013) and published in Haala (2013). The data set Vaihingen/Enz incorporates 3 strips with 12 PAN images each, which were taken over a semi-rural area at undulating terrain with a Microsoft UltraCam-X. The radiometric resolution is 8 bit and the ground sampling distance (GSD) 20 cm. The second data set covers an urban area in the city of München. The 16 bit imagery with a geometric resolution of 10 cm was acquired with a DMC II 230 in 3 strips with 5 images each. While the overlap of the München sub-block features an overlap of 80% in flight and 80% across flight direction, the Vaihingen/Enz sub-block was captured with 63% in flight and 62% across flight overlap. As reference surfaces, two median DSMs were generated based on the results of the 10 participants with a cell width corresponding to the ground sampling distances. Although the reference DSMs are dependent on the DIM results, they are appropriate to highlight DIM differences.
1.3 EuroSDR/ISPRS oblique airborne benchmark
The benchmark on high density image matching for DSM computation aims at investigating the potential of photogrammetric 3D data capture. As presented in this paper an oblique data set acquired over the city of Zürich with a Leica RCD30 Oblique Penta complements the two nadir aerial imagery sub-blocks. Three strips with 9 images each for all five views resulting in a total of 135 images are part of the benchmark. These distortion-free oblique images in the form of RGB 16 bit tiff as well as the corresponding interior and exterior orientation parameters which were derived from a highly accurate triangulation serve as input for the participants. Since the focus of this benchmark is on geometry, 3D point clouds as LAS files produced with different software systems will be evaluated. As in the nadir comparisons, the analysis will be carried out offline in contrast to several computer vision benchmarks where the number of participants is much higher, though. The evaluation includes qualitative as well as quantitative investigations. All information concerning the benchmark is available on the website of the EuroSDR/ISPRS project Benchmark on Image Matching where the corresponding data can also be downloaded:
http://www.ifp.uni-stuttgart.de/EuroSDR/ImageMatching/
2. TEST AREA AND DATA
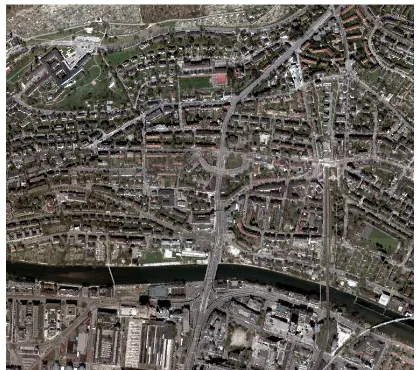
The selected test area in the west of Zürich covers the suburb of Wipkingen and is characterised by several apartment buildings, a few high buildings mainly representing churches, bridges and a river called Limmat in the south (see Figure 2). The elevation difference within the area depicted in Figure 2 which amounts to about 1.75 km2
is close to 100 m.
Figure 2. Ortho image of the test area in Zürich generated from oblique images looking northwards
2.1 Airborne imagery captured with a Leica RCD30 Oblique Penta
The medium format camera Leica RCD30 Oblique Penta used features a sensor size of 60 MP, a pixel size of 6 µm, a radiometric resolution of 14 bit, multi-directional motion compensation and a maximum rate of 1.8 seconds per image. All camera heads were equipped with Leica NAG-D 50 mm lenses and mounted with tilt angles of 35° (see Figure 3). In addition to the RGB imagery captured from all five views, exactly co-registered NIR images were taken by the nadir camera head.
Figure 3. Leica RCD30 Oblique Penta (Wagner et al., 2013)
On 24.4.2013, 11 strips roughly oriented east-west at 40 images per head covering an area of about 5 km x 3.5 km were captured (Cavegn et al., 2014). The approximate image overlap in nadir view is 70% in flight and 50% across flight direction (see Figure 4). With a flying height of around 520 m above ground and base lines of approximately 105 m, the base to height ratio was approx. 0.2. The calibrated focal length of 53 mm resulted in a GSD of 6 cm and an image scale of around 9800 in nadir view as well as a GSD of 6-13 cm for all four oblique views. Using parameters which were estimated based on a boresight calibration flight performed on 25.4.2013 over the Heerbrugg area, 16 bit distortion-free images (9000 x 6732) were generated using Leica FramePro.
An integrated georeferencing exploiting 10 ground control points was conducted in the reference system WGS84 UTM Zone 32N, which was used for all further investigations. By means of ORIMA, a bundle block adjustment with all images of all five camera heads of this block (2110 images) was performed resulting in a sigma0 of 2.2 µm, corresponding to approx. 1/3 pixel which is a very good value for a multi-head
oblique camera system. The RMSE of 10 ground control points is 3.2 cm in X direction, 2.6 cm in Y direction and 9.1 cm in Z direction. For 43901 tie points, an RMS of 10.4 cm in X direction, 9.6 cm in Y direction and 13.4 cm in Z direction was computed leading to a 3D point accuracy of 19.5 cm.
Figure 4. Digital surface model with overlaid nadir image footprints, overlap (maximum eight-fold) and projected camera
stations oriented northwards
2.2 Reference data
Several terrestrial laser scans were performed in the test area using a Leica ScanStation 2 on 15.10.2013 and by a Leica ScanStation P20 on 11./12.6.2014. Single measurement accuracy of both pulsed laser scanners is depicted in Table 1. The Leica ScanStation P20 features ultra-high speed time-of-flight enhanced by waveform digitising (WFD) technology.
Leica ScanStation P20
Leica ScanStation 2
3D position accuracy
3 mm at 50 m 6 mm (1-50 m)
Linearity error ≤ 1 mm 4 mm (1-50 m) Angular
accuracy
8'' horizontal 8'' vertical
12'' horizontal 12'' vertical Scan rate 1'000'000 points/s 50'000 points/s Field of view V 360°, H 270° V 360°, H 270° Range (18%
reflectivity)
120 m 134 m
Table 1. Specifications of the terrestrial laser scanners used for reference data capture (Leica Geosystems, 2014)
For each scan station, four to five points were measured with GNSS in the RTK mode at least twice and were subsequently used as targets for the later registration in Leica Cyclone. 2D accuracy of GNSS was about 1 cm and height accuracy approximately 1.5 cm. Accuracy of the several registrations lies in the range of 1-2 cm. Deuber (2014) reported a mean absolute accuracy for the TLS points in the test area of 1.7 cm in 2D and an accuracy of 2.2 cm for the height component which meets the 3D TLS accuracy expectation of 1/3-1/2 GSD. Spatial resolution on the facades was at least 1/3 GSD, mostly in the range of a few millimetres, though. Only XYZ point geometry but no RGB information for texturing was recorded for several building facades, a few roof areas and some road surfaces. Reference point clouds for the east and north facade of the
tower presented in section 4 were captured with a Leica ScanStation 2. All the other reference data used for the following evaluation was determined using a Leica ScanStation P20.
Furthermore, a 3D city model in LOD2 whose 2D accuracy is specified with 10-15 cm and the height accuracy with 20 cm was available as reference data. All 3D building coordinates in the Swiss reference system CH1903 were transformed to the global reference system WGS84 UTM32N by means of a Python script and the Reframe software (Federal Office of Topography swisstopo, 2014).
3. EVALUATION PROCEDURE
Point cloud analysis and comparison is performed according to Deuber (2014) who recently developed an evaluation procedure for the comparison of different dense image matching approaches for nadir and oblique imagery. In contrast to the investigations presented in this paper, even comparisons in image space as Gerke (2009) were carried out.
3.1 Products to be evaluated
Similar to Remondino et al. (2014), evaluation is performed on the raw DIM output, i.e. 3D point clouds. Due to the multiple viewing directions, five individual 3D point clouds or one single 3D point cloud fused from either all four oblique views or five views if nadir is involved can be taken into account for 3D point cloud evaluation.
Highly accurate reference data is a requirement for a benchmark, thus ground truth needs to be generated by a measurement technique which is superior to the technique which will be evaluated. As accuracies at GSD level are expected for DIM results, reference data with an accuracy of better than 1/2 GSD is required. In fact, it is challenging to establish a good reference with an accuracy which is two to three times better than the expected matching results (Remondino et al., 2014). This applies especially to the oblique case as there are no oblique airborne scanners available yet and as nadir airborne scanners cannot compete with the density of dense image matching approaches. Since terrestrial laser scanning is impossible for a large scene such as depicted in Figure 2, the decision was taken to choose several distinct reference patches distributed over the whole test area. As a particular building facade is usually visible in images taken from one or two viewing directions, the focus was laid on this type of object. However, also roofs and road patches could be considered for further investigations, preferably with reference data, though.
It has to be questioned whether terrestrial laser scans are an ideal reference for dense image matching products. Due to the different measurement principles, light pulses from laser scanning travel through glass in window areas while matching is performed relating to the visible surface. An extensive comparison between TLS and DIM is given in Leberl et al. (2010).
3.2 Automated extraction of patches using a 3D city model
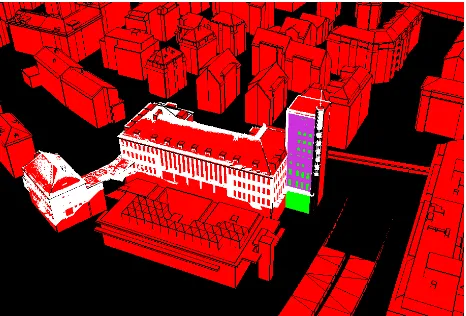
In order to carry out the benchmark evaluation within a reasonable time frame, there needs to be a semi-automated process for the extraction of the many patches. For this purpose, a facade extraction tool was developed which expects a LOD2
CityGML file and a point cloud in LAS format as input (see Figure 5). A relevant facade can be selected and it is possible to define facade margins. A subset of points corresponding to the selected facade as XYZ file will be the output.
Figure 5. Screenshot of the facade extraction tool, red: 3D city model, white: TLS point cloud, green: selected facade, purple:
selected TLS point cloud
3.3 Evaluation measures
Appropriate evaluation measures are required to draw significant conclusions relating to defined patches. The first measure is point cloud density specified as the number of points per square metre. Higher density does not necessarily mean better quality and point cloud filtering should be considered. The second measure is the RMS of the flatness errors which is described in Hosseininaveh Ahmadabadian et al. (2013) and also used by Remondino et al. (2014) and Nebiker et al. (2012). It indicates the noise of the extracted 3D geometry and is calculated based on all point cloud deviations to a best fitting plane. Further, deviations between dense image matching results and reference data can be evaluated by RMSE, mean values and grid visualisations. While d’Angelo & Reinartz (2011) evaluated Euclidean distances between LiDAR reference points and DIM meshes, Remondino et al. (2014) compared DIM point clouds against meshed reference models obtained by TLS. As last measure, profiles are evaluated since they reveal matching resolution, potential systematic errors and accuracy. This well proven method is amongst others exploited by Gehrke et al. (2010), Haala (2013) and Remondino et al. (2014).
4. VALIDATION OF THE PROPOSED EVALUATION PROCEDURE
In order to validate the proposed evaluation procedure, all 135 benchmark images were matched with four in-flight neighbours using SURE (Rothermel et al., 2012) resulting in 135 individual 3D point clouds. However, only a few point clouds served as input for the following investigations and no point cloud fusion was performed which would have caused a higher density. The 27 north looking images of the benchmark were utilised for image matching in PhotoScan (Agisoft, 2014). Unfortunately, exterior orientation parameters cannot be fixed for the matching process yet, thus three ground control points were measured where visible in the 27 images. To ensure the same conditions as for SURE, only five images were matched.
Two different objects in the test area were selected. A tower featuring planar facades with several windows and a school
building whose facades show distinctive structures. Since no glass is visible in case of the school building facades, even window areas can be incorporated in the evaluation process.
All TLS point clouds were thinned out aiming at a spacing of 1 cm. Based on the 3D city model, subsets of points which correspond to predefined facades were semi-automatically extracted from both reference data (TLS) and dense image matching output. A Matlab script served for point cloud analysis and comparisons. First of all, density is computed based on all 3D input coordinates. For all other investigations, 3D points are sampled into a vertical DSM with a cell size of the nadir GSD equal to 6 cm. Outliers which have larger deviations to a best-fit plane than a defined threshold are removed. Moreover, density is also considered for computation of deviations leading to a white mask of excluded regions (see Figure 6).
4.1 Tower
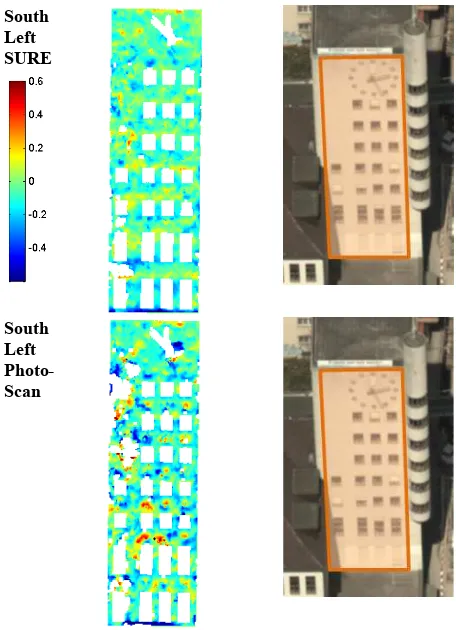
For each facade of the selected tower, a patch on the top part with varying in size from 94 m2 to 260 m2 and with a point selection margin of 20 cm was defined. DIM point clouds were derived from images taken by the forward, backward and left looking camera. For the south tower facade, there were also PhotoScan results in addition to SURE. Ground sampling distances on the facades range from 6.6 cm to 8 cm. Color bars for Figure 6 show a range of -60 cm to 60 cm which is equal to 10 times the nadir GSD. Where positive deviations are depicted, 3D points would actually lie inside the building. Only the north facade has a positive mean value, all the others are negative. Although a shadow covers the left bottom part of the south facade, there are not significantly larger deviations.
East Backward SURE
North Left SURE
West Forward SURE
South Left SURE
South Left Photo-Scan
Figure 6. Deviations DIM-TLS (left) and oblique images with overlaid facade patches (right)
SURE reveals a lower density for in-flight matching (forward and backward looking) compared to that from matching left looking images which results in more than 100 points per square metre (see Table 2). RMSE of best fitting plane range from 1.22-1.61 pixel and RMSE of deviations amount to 1.4-1.55 pixel with a maximum value of 2.17 pixel for the east facade. Mean values of about up to 1 pixel are computed. More points are generated with PhotoScan compared to SURE. However, RMSE of the DIM point cloud is higher and RMSE of deviations lies in the range of 2 pixels.
GSD
[cm]
Patch size
[m2]
Density
[Points / m2]
RMSE DIM
[px]
RMSE DIM-TLS [px]
Mean DIM-TLS [px]
E S 7.1 217 72 1.61 2.17 -1.27
N S 7.1 218 106 1.22 1.55 0.96
W S 6.6 94 88 1.27 1.40 -0.02
S S 8.0 260 112 1.28 1.54 -0.85
S PS 8.0 260 147 2.02 2.14 -1.02
Table 2. Density, noise and deviation values for all tower facades using SURE (S) and PhotoScan (PS)
4.2 School building
A patch with a size of 122 m2 and two horizontal profiles were defined for the central school building façade (see Figure 7). The right school building facade was evaluated by a patch of 78 m2 in size and by two vertical profiles. DIM point clouds were derived from images taken by the right looking camera and for both facades DIM results using SURE (see Figure 8) and PhotoScan were generated.
Figure 7. School building with overlaid facade patches and profiles
Figure 8. Point cloud of school building generated with SURE
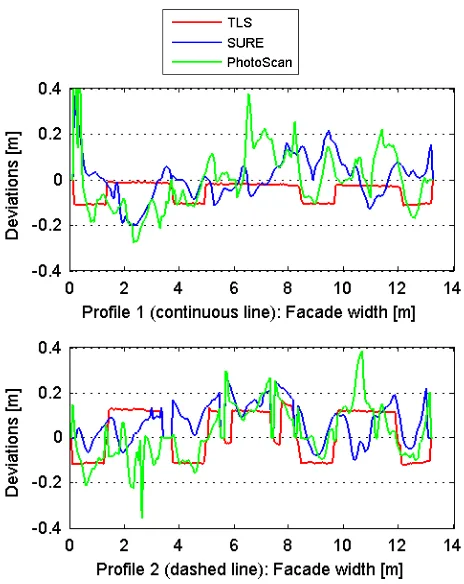
Deviations between SURE DIM and TLS are mainly positive which means that most of the DIM points would actually lie inside the building (see Figure 9). The largest deviations for both SURE and PhotoScan are close to the boundaries of the patches as well as in areas with fine structures. As depicted in Figure 10, both matchers better defined the fine facade structure for profile 2 than for profile 1 which was very challenging since all facade depth variations are smaller than 2 GSD.
SURE
Photo-Scan
Figure 9. Deviations DIM-TLS of the central school building facade
Figure 10. Horizontal profiles of the central school building facade
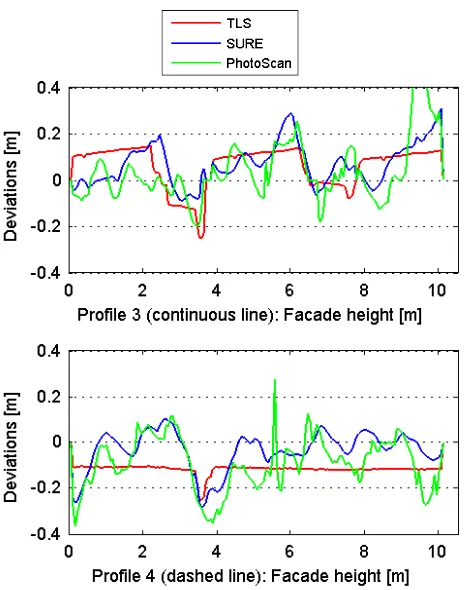
According to Figure 11, the largest deviations were computed for an area in the top central of the facade. Facade structure is roughly represented by results of both matchers, but there are some large deviations in case of PhotoScan (see Figure 12).
SURE
Photo-Scan
Figure 11. Deviations DIM-TLS of the right school building facade
Figure 12. Rotated vertical profiles of the right school building facade (left: bottom of facade, right: top)
A point density of 120 points per square meter was computed for SURE and a density of around 170 for PhotoScan (see Table 3). Approximate RMSE for DIM with SURE are 1.6 pixel and 2.1 pixel for DIM with PhotoScan. These values are obviously higher than RMSE of DIM for the tower as this measure is only practical for facades which are almost planar and do not have several depth variations. For the deviations DIM-TLS, RMSE values amounting to 1.53-1.92 pixel and mean values similar to those for the tower were calculated.
GSD
Table 3. Density, noise and deviation values for the central (C) and the right (R) school building facades using SURE (S) and
PhotoScan (PS)
5. CONCLUSIONS AND OUTLOOK
A growing number of software tools for detailed, reliable and accurate image based DSM generation from airborne imagery are available. Efficient stereo image matching based on multiple overlapping images can provide DSM at vertical accuracies close to the sub-pixel level. While this is true for standard aerial flights aiming at 2.5D DSM representations from nadir views, the situation is more demanding for the evaluation of oblique data sets. Additional challenges occur from large differences in image scale and object visibility or the need to provide 3D
representations by (meshed) point clouds. This paper proposes a benchmark aiming at the evaluation of the state-of-the-art in 3D data capture from oblique aerial imagery. Our exemplarily evaluation for two software tools shows the proposed evaluation measures to be appropriate, especially the measures representing DIM-TLS deviations as well as profiles for facades with several depth differences. The available data sets have been verified by achieving accurate DIM results from images of all oblique cameras (forward, backward, left, right) and for all directions (north, south, east, west). The investigated imagery with a GSD of 6-13 cm is typical for current city-wide data capture. In this scenario terrestrial laser scanning provides reference data at building facades with superior accuracy and density. Nevertheless, a considerable amount of façade structure can still be extracted from the oblique images despite their limited resolution.
Potential participants of the test can download the data via the project web page, compute their results and upload (http://www.ifp.uni-stuttgart.de/EuroSDR/ImageMatching/) their solution. Differences to the reference surface are then computed and made available again. It is planned to accompany the benchmark with a workshop in order to bring together participating software developers, distributors and users of dense matching software. Hopefully, this will provide a suitable platform to review the outcomes of the benchmark and trigger the implementation of additional test scenarios.
6. ACKNOWLEDGEMENTS
Many thanks are due to Leica Geosystems AG (Heerbrugg, Switzerland) for providing the accurately georeferenced oblique imagery and to the City of Zürich (Geomatik + Vermessung, GeoZ) for the 3D city model of the test area.
7. REFERENCES
Agisoft, 2014. Agisoft PhotoScan.
http://www.agisoft.ru/products/photoscan/professional/ (25.7.2014).
Cavegn, S., Nebiker, S. & Deuber, M., 2014. Dense Image Matching mit Oblique Luftbildaufnahmen – Ein systematischer Vergleich verschiedener Lösungen mit Aufnahmen der Leica RCD30 Oblique Penta. In: E. Seyfert et al. (Eds.), DGPF Tagungsband 23 / 2014, Gemeinsame Tagung 2014 der DGfK, der DGPF, der GfGI und des GiN, Hamburg, Germany.
Cramer, M., 2010. The DGPF-Test on Digital Airborne Camera Evaluation – Overview and Test Design. Photogrammetrie - Fernerkundung - Geoinformation (PFG), 2010(2), pp. 73-82.
Dall'Asta, E. & Roncella, R., 2014. A comparison of semiglobal and local dense matching algorithms for surface reconstruction. In: Int. Arch. Photogramm. Remote Sens. Spatial Inf. Sci., Riva del Garda, Italy, Vol. XL-5, pp. 187-194.
d’Angelo, P. & Reinartz, P., 2011. Semiglobal matching results on the ISPRS stereo matching benchmark. In: ISPRS Hannover Workshop 2011. High-Resolution Earth Imaging for Geospatial Information, Hannover, Gemany.
Deuber, M., 2014. Oblique Photogrammetry – Dense Image Matching mit Schrägluftbildern. Master Thesis. FHNW Fachhochschule Nordwestschweiz.
Federal Office of Topography swisstopo, 2014. REFRAME http://www.swisstopo.admin.ch/internet/swisstopo/en/home/app s/calc/reframe.html (25.7.2014).
Fritsch, D. & Rothermel, M., 2013. Oblique Image Data Processing - Potential, Experiences and Recommendations. In: D. Fritsch (Ed.), Photogrammetric Week ’13. Wichmann, Berlin/Offenbach, pp. 73-88.
Fritsch, D., Pfeifer, N. & Franzen, M., 2013. Proceedings of the 2nd EuroSDR Workshop on High Density Image Matching for DSM Computation. EuroSDR Publication Series, No. 63.
Gehrke, S., Morin, K., Downey, M., Boehrer, N. & Fuchs, T., 2010. Semi-global Matching: An alternative to LiDAR for DSM generation? In: The 2010 Canadian Geomatics Conference and Symposium of Commission I, ISPRS Convergence in Geomatics – Shaping Canada’s Competitive Landscape, Calgary, Canada.
Geiger, A., Lenz, P. & Urtasun, R., 2012. Are we ready for Autonomous Driving? The KITTI Vision Benchmark Suite. In: IEEE Conference on Computer Vision and Pattern Recognition, Providence, USA, pp. 3354–3361.
Gerke, M., 2009. Dense Matching in High Resolution Oblique Airborne Images. In: U. Stilla, F. Rottensteiner & N. Paparoditis (Eds.), CMRT09, Int. Arch. Photogramm. Remote Sens. Spatial Inf. Sci., Paris, France, Vol. XXXVIII, Part 3/W4, pp. 77-82.
Haala, N., Hastedt, H., Wolff, K., Ressl, C. & Baltrusch, S., 2010. Digital Photogrammetric Camera Evaluation – Generation of Digital Elevation Models. Photogrammetrie - Fernerkundung - Geoinformation (PFG), 2010(2), pp. 99-115.
Haala, N. & Rothermel, M., 2012. Dense Multi-Stereo Matching for High Quality Digital Elevation Models. Photogrammetrie - Fernerkundung - Geoinformation (PFG), 2012(4), pp. 331-343.
Haala, N., 2013. The Landscape of Dense Image Matching Algorithms. In: D. Fritsch (Ed.), Photogrammetric Week ’13. Wichmann, Berlin/Offenbach, pp. 271-284.
Haala, N., 2014. Dense Image Matching Final Report. EuroSDR Publication Series, Official Publication No. 64, pp. 115-145.
Hirschmüller, H., 2008. Stereo Processing by Semiglobal Matching and Mutual Information. IEEE Transactions on Pattern Analysis and Machine Intelligence, 30(2), pp. 328-341.
Hosseininaveh Ahmadabadian, A., Robson, S., Boehm, J., Shortis, M., Wenzel, K. & Fritsch, D., 2013. A comparison of dense matching algorithms for scaled surface reconstruction using stereo camera rigs. ISPRS Journal of Photogrammetry and Remote Sensing, 78(2013), pp. 157-167.
Kersten, T. P. & Lindstaedt, M., 2012. Automatic 3D Object Reconstruction from Multiple Images for Architectural, Cultural Heritage and Archaeological Applications Using Open-Source Software and Web Services. Photogrammetrie - Fernerkundung - Geoinformation (PFG), 2012(6), pp. 727-740.
Leberl, F., Irschara, A., Pock, T., Meixner, P., Gruber, M., Scholz, S. & Wiechert, A., 2010. Point Clouds: Lidar versus 3D
Vision. Photogrammetric Engineering and Remote Sensing, 76(10), pp. 1123–1134.
Leica Geosystems, 2014. Leica ScanStation P20.
http://www.leica-geosystems.com/en/Leica-ScanStation-P20_101869.htm (25.7.2014).
Lemmens, M., 2014a. Digital Oblique Aerial Cameras (1). A Survey of Features and Systems. GIM International, 28(4), pp. 20-25.
Lemmens, M., 2014b. Digital Oblique Aerial Cameras (2). A Survey of Features and Systems. GIM International, 28(5), pp. 20-25.
Nebiker, S., Cavegn, S., Eugster, H., Laemmer, K., Markram, J. & Wagner, R., 2012. Fusion of airborne and terrestrial image-based 3D modelling for road infrastructure management - vision and first experiments. In: Int. Arch. Photogramm. Remote Sens. Spatial Inf. Sci., Melbourne, Australia, Vol. XXXIX, Part B4, pp. 79-84.
Reinartz, P., d’Angelo, P., Krauß, T., Poli, D., Jacobsen, K. & Buyuksalih, G., 2010. Benchmarking and Quality Analysis of DEM generated from High and Very High Resolution Optical Stereo Satellite Data. In: The 2010 Canadian Geomatics Conference and Symposium of Commission I, ISPRS Convergence in Geomatics – Shaping Canada’s Competitive Landscape, Calgary, Canada.
Remondino, F., Spera, M. G., Nocerino, E., Menna, F. & Nex, F., 2014. State of the Art in High Density Image Matching. The Photogrammetric Record, 29(146), pp. 144-166.
Rothermel, M., Wenzel, K., Fritsch, D. & Haala, N., 2012. SURE: Photogrammetric Surface Reconstruction from Imagery. In: Proceedings LC3D Workshop, Berlin, Germany.
Rupnik, E., Nex, F. & Remondino, F., 2014. Oblique Multi-Camera Systems - Orientation and Dense Matching Issues. In: Int. Arch. Photogramm. Remote Sens. Spatial Inf. Sci., Castelldefels, Spain, Vol. XL-3, Part W1, pp. 107-114.
Scharstein, D. & Szeliski, R., 2002. A Taxonomy and Evaluation of Dense Two-Frame Stereo Correspondence Algorithms. International Journal of Computer Vision, 47(1-3), pp. 7-42.
Seitz, S. M., Curless, B., Diebel, J., Scharstein, D. & Szeliski, R., 2006. A Comparison and Evaluation of Multi-View Stereo Reconstruction Algorithms. In: IEEE Conference on Computer Vision and Pattern Recognition, New York, USA, Vol. 1, pp. 519-528.
Strecha, C., von Hansen, W., Van Gool, L., Fua, P. & Thoennessen, U., 2008. On Benchmarking Camera Calibration and Multi-View Stereo for High Resolution Imagery. In: IEEE Conference on Computer Vision and Pattern Recognition, Anchorage, USA, pp. 1-8.
Wagner, R., Lieckfeldt, P., Rothe, R. & Markram, J., 2013. The Leica Geosystems CityMapper Solution. In: D. Fritsch (Ed.), Photogrammetric Week ’13. Wichmann, Berlin/Offenbach, pp. 89-99.