THE BACKSCATTERING CHARACTERISTICS OF THERMOKARST LAKE ICE IN
THE QINGHAI-TIBET PLATEAU FROM SAR
Z. Li a, *, B. Tian a, P. Tang a
a
Institute of Remote Sensing and Digital Earth, Chinese Academy of Sciences, Beijing, China - (lizhen, Tianbs, Tangp)@radi.ac.cn
Commission VII, WG VII/1
KEY WORDS: Backscattering, Thermokarst, Lake ice, QTP, SAR, Temporal variability
ABSTRACT:
A thermokarst lake is an important indicator of changes in climate, which cause considerable thermal distribution to the surrounding permafrost. The imaging radar has demonstrated the capability to determine when and which lakes freeze or do not freeze. In this paper, the temporal variability of C-band backscattering of thermokarst lakes at Beiluhe test area, is located on the central Qinghai-Tibet Plateau (QTP), were examined by 45 ENVISAT-ASAR imageries acquired in freeze up, ice duration and break-up stages. The SAR behaviour response for lake ice change are analysed with ASAR observation in experiments area. The results showed that the ice layer volume scattering and ice-water surface scattering were the two major scattering components in C-band VV polarization, which is also affected by the increase of bubble size, ice density and roughness of ice-water interface. According to this study, the timing of lake ice-on in fall and ice-off in spring for this geographic region can be identified in radar images by comparing radar backscatter from lake ice to its surrounding alpine meadow. When ice duration, the radar signature proved to be able to monitor the ice thickness over lake and deformation around the lake.
* Corresponding author. This is useful to know for communication with the appropriate person in cases with more than one author.
1. INTRODUCTION
Thermokarst lakes are widespread in tundra and boreal lowland region with thermal degradation of permafrost or melting of massive ground ice (Kokelj and Jorgenson 2013; Niu et al. 2011). Thermokarst lake is an important indicator of changes in climate, which cause considerable thermal distribution to the surrounding permafrost. Various studies have been carried out at these high latitude lakes for understanding these features between thermokarst lake and regional and environment (Jones et al. 2011; Marsh et al. 2009; Karlsson et al. 2012).
More than 1500 lakes are distributed on the QTP, the majority of lakes in Chinese permafrost regions are thermokarst features. During the past 30 years, permafrost has been persistently degrading (Wu and Zhang 2008). The number of the thermokarst lakes and ponds has been increasing under the influence of recent climate warming in the continuous permafrost region along the Qing-Tibet railway and highway (Niu et al. 2011). So far, in comparison with high latitude lakes in other regions, relatively little study has been conducted on the QTP for the characteristics and impacts of thermokarst lakes (Ling et al. 2012) due to the lack of continuous long-term ground obersvation, which calls for the use of remote sensing on the QTP (Song et al. 2014).
The lake ice formation, growth and decay are the result of an energy surplus or deficit in energy balance of the ice cover which determined by air temperature, precipitation, wind and radiation (Brown and Duguay 2010). Thus the ice phenology, including freeze-up, ice duration and break-up, has been shown to be a good proxy indicator for local-regional climate variability and change investigations (Kropáček et al. 2013). It has been proved that the radar remote sensing, without the limit of weather and solar illumination, has the capability to obtain some significant information about lake ice characteristics and
processes because of the capability of microwave to penetrate ice (Jeffries et al. 2005).
Variation in radar return from ice-covered lakes has been documented (Elachi et al. 1976; Leconte and Klassen 1991). In recently, digital analysis of the C-band RADARSAT-2 polarimetric SAR (PolSAR) data has been used successfully to delineate the grounded ice and discriminate open water versus lake ice during spring melting and fall freeze-up (Yue et al. 2013; Geldsetzer and van der Sanden 2013). Apart from characterizing the backscatter from lake ice and classifying the ice types, great progress has been made to quantitatively extract these geophysical parameters. Using the intensity information of the multi-temporal SAR images acquired during the cold season to determine when and which lakes freeze to the bottom, ice thickness, water availability and lake bathymetric profiles can be detected (Hirose et al. 2008). Using the phase information, SAR Interferometry provides another possible method to determine the lake depth and ice thickness (Wegmuller et al. 2010), though it is limited by the low coherence due to the ice thickness growing during the relative long revisit period of SAR satellite (Li et al. 2000).
The investigation on the evaluation of radar remote sensing for monitoring ice growth and decay, and related processes of thermokarst lakes on the QTP is still missing, though the radar remote sensing has been extensively used in the study of lake ice in other regions. In this paper, we presents some results from an investigation on the evaluation of C-band SAR imagery for monitoring ice growth and decay processes from thermaokarst lakes in northern QTP, China. Weather observations and field measurements from lake ice are used in support of the interpretation of the temporal evolution of backscatter in mulit-temporal SAR data sets.
Figure 1. A false-color composited image ASAR intensity images and photos in study area. The over-layered contours are
obtained from SRTM-DEM with an interval of 100 m and the yellow rectangular denote the location of study site.
2. TUDY AREA AND DATA
2.1 Study Area
The Beiluhe Basin, including the Xiushuihe valley and the Beiluhe beach lands and terraces, is located on the central QTP about 350 km southwest of Golmud City and surrounded by Hoh Xil Mountainous in the north and Fenghuo Mountainous in the south (Fig.1). In spite of the high altitude (4600 m on average), the terrain of the selected study area is relatively flat, with rolling hills varying only tens of meters in elevation. The regional strata consisted predominantly of lacustrine deposits of the upper Tertiary and diluvium of the Quaternary Holocene Series. The ground surfaceis covered by fine sands with gravels (0.5 to 2.1 m in thickness), generally sparse in vegetation consisting of short prairie grasses and mosses.
These thermokarst lakes in Beiluhe basin are relatively large, with a mean area of 8,500 m2 and the biggest one is over 60,000 m2, and the smallest is 1,200 m2. They are isolated or linked and developed in the lower parts of the terrain where ice-rich permafrost or massive ground ice exist (Niu et al. 2011). According to borehole testing, a great deal of ground ice exists in permafrost at the test sites, whose range from 2.0 m to 8.0 m under the natural ground surface. The permafrost thickness ranges from 20 m to 80 m, with an active layer of 1.8 to 3.0 m in thickness and the local geothermal gradient is 1.5×10⁻² to 4.0× 10⁻²℃/m (Lin et al. 2010). According to a bathymetric
survey, most of the thermokarst lakes in the Beiluhe Basin on the QTP are asymmetric in west-east or north-south direction and approximately 70% of lakes are elliptical in shape and 13% are elongate (Lin et al. 2011). Field investigations show that the
depth of lake varies from 0.5 to 2.5m, the mean ice thickness is 0.5 m in January, the maximum thickness with a value of 0.6 to 0.8 m appears at the end of March and about 80% of lakes do not freeze to the bottom (Lin et al. 2010; Niu et al. 2011).
A false-color composited image of the study area acquired from ASAR intensity images with Red (April 6, 2009), Green (July 30, 2009) and Blue (January 1, 2009) shows in Fig.1. Interestingly, using a tri-temporal SAR to RGB composition that is the analogy of the polarimetric Pauli-based RGB, these seasonal features can be highlighted from different scattering mechanism. Specifically, the red tone (April 16, 2009) reflects the status of thawing soil, and strong surface scattering of alpine meadow occurs due to the increase of soil humidity and low scattering of lake due to ice melting. Similarly, The green tone (July 30, 2009) corresponds to the fast grass growth, and the change of volume scattering from alpine meadow is most significant. Finally, the blue tone (January 1, 2009) underlines the stronger surface scattering from the bare gravel such as overflow land near the river. Therefore, apart from rivers and lakes distributed on the region with relatively low relief, it is very easy to distinguish from the distribution of alpine meadow from bare ground.
2.2 Data
Meteorological data obtained from the Wudaoliang Reference Climate Station at 35º13´N, 93º05´E, located approximately 30 km north of the study area, include daily average temperature, maximum temperature, minimum temperature, daily total water equivalent precipitation, and daily average wind speed etc. In this region, most of the precipitation occurs from April to September, possessing 92% of the total precipitation and showing that there is little snow in winter (Lin et al. 2011). According to the atmosphere data observed at the Beiluhe Permafrost Station, the mean annual air temperature is -3.8 °C, with the highest value of 21.3 °C in mid-July and lowest value of -21.4 °C later January and the freezing period usually lasts from September to April (7–8 months) (Lin et al. 2011; Lin et al. 2010). In summer, the climate of the plateau is mostly influenced by some airflows of tropospheric tropical easterlies, subtropic westerlies, and southwestern monsoon from the Indian Ocean (Liu et al. 2008) and in winter by the cold and dry westerlies from troposphere, polar and stratosphere. The maximum wind speed is 40 m/s and the annual average wind speed is 4.1 m/s (Fujun et al. 2008). It should be emphasized that these lakes do not have snow cover, which make them different from other lakes (e.g. Arctic and Sub-Arctic lakes) presented in the literature and provides an opportunity to study.
A total of 45 ENVISAT-ASAR SLC images were acquired from April 2003 to July 2010 with a repeated orbit, these values with a bold-red-color font stand for freeze-up, bold-blue-color for ice cover and green-color for break up. (Table 1). The local acquisition time is about 10:00 and all images have a 23.7° look-angle at mid-scene, and VV-polarization. The pixel spacing is 7.8 m in the range direction, and 4.05 m in the azimuth direction. For the geocoding and terrain correction, (SRTM-DEM) data with 90m pixels pacing was employed.
Fieldwork was undertaken mainly at the BLH-A lake near the Beiluhe Permafrost Station, which is located on the west side of the QTR at 34º49.509´N, 92º55.382´E. As a representative of thermokarst lakes in this region, BLH-A was monitored from April 2006 until now. Measurements included water depth, water temperature, lake-ice thickness, lakeshore retreat, ground temperatures and the central deep pool and the shallow near- The International Archives of the Photogrammetry, Remote Sensing and Spatial Information Sciences, Volume XL-7, 2014
Table 1 SAR images applied in this study
Date Orbit Julian Date Orbit Julian
2003/4/3 5698 93 2007/6/21 27742 172
2003/5/8 6199 128 2007/7/26 28243 -158
2003/10/30 8704 -62 2007/8/30 28744 -123
2004/1/8 9706 8 2007/10/4 29254 -88
2004/5/27 11710 148 2007/11/8 29746 -53
2004/10/14 13714 -76 2007/12/13 30247 -18
2004/11/18 14215 -42 2008/2/21 31249 52
2004/12/23 14716 -7 2008/5/1 32251 122
2005/1/27 15217 27 2008/6/5 32752 157
2005/3/3 15718 62 2008/9/18 34255 -103
2005/4/7 16219 97 2008/10/23 34756 -68
2005/7/21 17722 -163 2009/1/1 35758 1
2005/9/29 18724 -93 2009/2/5 36259 36
2006/2/16 20728 47 2009/3/12 36760 71
2006/3/23 21229 82 2009/4/16 37261 106
2006/4/27 21730 117 2009/5/21 37762 141
2006/6/1 22231 152 2009/6/25 38263 176
2006/7/6 22732 -178 2009/7/30 38764 -154
2006/9/14 23734 -108 2009/10/8 39766 -84
2006/10/19 24235 -73 2009/12/17 40768 -14
2006/12/28 25237 -3 2010/1/21 41269 21
2007/4/12 26740 102 2010/7/15 43774 -168
2007/5/17 27241 137 !
shores zone and the ground temperatures around the lake and beneath the natural ground surface (Lin et al. 2011; Lin et al. 2010; Niu et al. 2011). Recently, vertical profiles of ice crystal crystal size, gas bubble shape and size, porosities, as well as ice density were investigated on December 9, 2010 and March 24, 2011, corresponding to fast ice growth and slow ice growth, respectively. Detailed descriptions of the lake ice sample are given by (Huang et al. 2013; Huang et al. 2012). It should be pointed out that the BLH-A is too small (just covers few pixels in SAR images) and it is difficult to extract its backscatter value accurately and reliably due to the effect of mix-pixels and speckle; however, according to our field investigation, there are no significant difference on ice crystals and fabrics, and gas bubbles morphology among these lakes distributed in the Beiluhe Basin (Huang et al. 2012; Wu et al. 2014).
3. METHOD
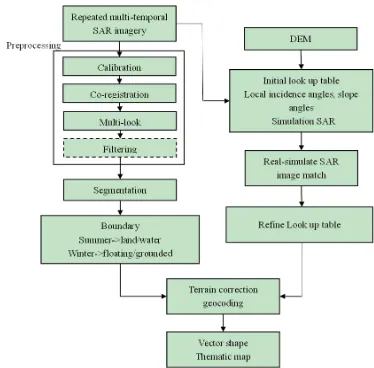
Since SAR image data obtained by ENVISAT-ASAR are Level 1 Single Look Complex (SLC) in slant-range form, some pre-processing should be done at first, which includes: (1) Calibration: The digital number (DN) of the ASAR image could be converted to the backscattering coefficient σ0 at each image pixel; (2) Co-registration: This ensures that values of from different times and in different parts of the image are comparable. Imagery acquired on May 17, 2007, which is spatially and temporally near the centre of the set of scenes, was selected as reference geometry. For the ASAR repeat data acquired with the same viewing geometry, the achievable co- registration accuracy for images over flat areas will be better than 0.2 pixels by autocorrelation methods. (3) Multi-look: In order to reduce image speckles and keep the images with approximately square pixel spacing on the ground, a 5×1 multi-looking window was applied to generate multi-look intensity images from Single Look Complex (SLC) data by averaging the intensity in azimuth and range direction.
Figure 2. The flowchart of processing SAR images.
After pre-processing, image-space method that performs the classification or segmentation processing before the geometric processing was adopted in this paper (Antropov et al. 2012; Toutin et al. 2013). In this study, the level set algorithm was applied to segment SAR image and then delineated automatically these shorelines in summer and boundaries between different ice types in winter (Ayed et al. 2006). Especially, taking into account the multiplicative aspect of speckle noise and the multivariate feature of backscatter from lake ice, the Fisher distribution, a second-kind statistic and particularly good approximations of different land cover types (Galland et al. 2009), was adopted to model the texture of image.
Finally, the geo-rectification can be achieved by GAMMA software and the output is the vector shape files on these shorelines and ice boundaries and thematic maps. The related software tool has been implemented as an ENVI extension
Figure 3. A selection of processed ASAR image subsets acquired over the study areas during 2009. These locations of
six selected lakes are marked as cross on image observed on October 8, 2009.
module, which can be installed and plugged in as a part of ENVI software to improve the efficiency of analysis by graphical user interfaces. Fig.2 shows the flowchart of processing SAR images and a selection of processed ASAR image subsets of the study site is shown in Fig.3.
4. RESULTS AND DISCUSSION
4.1 Field Observations
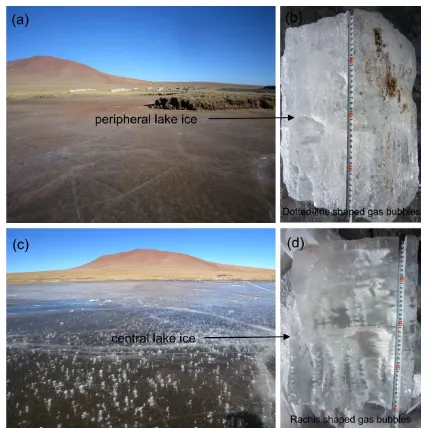
According to the field observation, the lake ice in the Beiluhe basin may be classified as (Huang et al. 2012): (a) Frazil ice: From late October to December, when air temperature decreases and falls below the freezing point of water and undergoes a slight super-cooling, the surface water starts to freeze rapidly (Kirillin et al. 2012). Meanwhile, strong northwest wind is prevailing in the Beiluhe Basin, the surface layer is disturbed and small ice crystals do not have enough time to congeal, frazil ice then forms and progressively joins together to form a solid sheet that consists of tiny granular crystals in the surface. On other hand, under the condition of the warm air temperature during daytime, the thin granular crystal layer existed at the very start, but gradually evaporated and ablated. In fact, vigorous ablation and evaporation of surface ice was sustained during the period of ice growth and decay, principally due to a low relative humidity (~30% in winter), a powerful prevailing northwestern wind and strong solar radiation (Shenbin et al. 2006; Yang et al. 2010). (b) Columnar ice: With increasing ice thickness, ice crystals have enough time to grow, but are confined by ambient ones, a preferred growth orientation of some crystals appeared and caused the formation of vertical columnar crystals whose mean size increases with depth, achieving a fixed level of about 20 mm.
The following two types of gas bubbles were observed from field ice samples (Huang et al. 2012): (1) dot-line-shaped bubbles (DB) in the peripheral lake ice cover (Figure 4(a) and (b)). Different from the tubular bubbles in other regions previously reported by (Jeffries et al. 1994), DB are made up of tiny spherical pockets with diameters of 0.3-2.5 mm that are
Figure 4. Samples of ice types encountered on the thermokarst lakse of Beiluhe Basin: (a) and (b) show that the dotted-line shaped gas bubbles distribute in the peripheral lake ice cover; (c)
and (d) show the rachis-shaped gas bubbles distribute in the central lake ice cover.
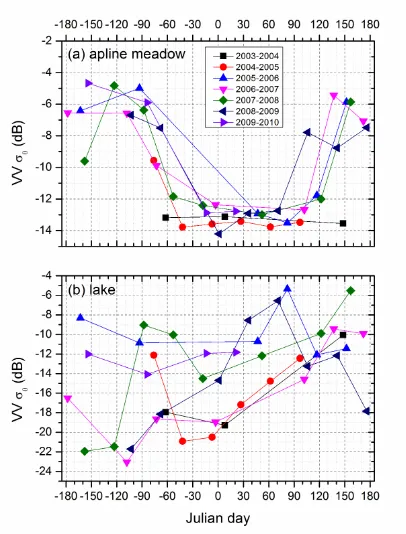
Figure 5. Time series σ
0 observed by SAR over (a) alpine meadow and (b) thermokarst lake from Apr. 2003 to Jul. 2010.
arranged vertically in the direction of ice growth. If the vertical spherical bubble strings are classified as ‘cylindrical bubbles’ approximately, the slenderness ratio will varies within 100-200. The porosities range from 2% to 3% and it decreases rapidly with the depth until a constant value while the distribution of DB is uniform. (2) rachis-shaped bubbles (RB) in central lake ice cover (Figure 4(c) and (d)). The individual RB has a relatively large size and a regular pattern of oblate round cake or quasi-sphere of 1-5 cm diameter and 1-2 cm height, with a flat top and a circular bottom. All these units are vertically connected in series with a pronounced horizontal banding, which is similar to “kotenoks” described by (Walter et al. 2008; Wu et al. 2014). Both the porosity of ice and the mean size of these bubbles increase with lake depth and thus the density profile of ice is also depth-dependence.
4.2 SAR Measurements
From time series σ0 observation with ASAR between April 2003 and July 2010, we can see that the alpine meadow and thermokarst lake shows obviously season change characteristics, and a little more complex for thermokarst lake (Figure 5).
Intra-annual dynamics of the thermokarst lake and alpine meadow on the temporal σ0 observation illustrates the impact of the season in land-surface conditions (Figure 6). According the meteorological measurements and the field observations, we can know the characterstics of backscattering for the thermokarst lake and alpine meadow:
Prior to freeze-up, open water remains from May to October (5-6 months). The lake σ
0 is lower than -20 dB over quiet watersurface; however, strong backscatter occurs sometime (e.g. -5.52 dB on June 5, 2008), probably due to the wind, which can increase locally the roughness of the water surface and thus the backscattering intensity (Jeffries et al. 1994; Morris et al. 1995). When the water-surface keeps open, apart from the case that high temperature, no rain lasted several days before radar imaging (e.g. May 27, 2004 and July 26, 2007), the alpine meadow σ0 remains high (>-11.0 dB) throughout the monsoon season with temporal variability as a result of antecedent precipitation (Van Der Velde and Su 2009).
During the onset of freeze-up, as the air temperature decreasing from the mid-October, a thin ice cover is observed to form and melt intermittently in late October. Thereafter, until the early November, a stable ice sheet covers the whole lake. Low backscatter intensity usually occurs over lakes during this time. The International Archives of the Photogrammetry, Remote Sensing and Spatial Information Sciences, Volume XL-7, 2014
Figure 6. Time series σ0 observed by SAR over (a) alpine meadow and (b) thermokarst lake (The negative number of
Julian day denotes as the last year day).
This phenomenon can be explained by the specular reflection on the smooth upper and lower surface of the new, thin continuous ice cover, which leads to most of the signal being reflected away from the radar (Jeffries et al. 1994). In most case, the backscatter of lake ranges in intensity from -21 dB to -17 dB, however, one notable exception (-10.03 dB) happened on November 8, 2007. It is impossible that this anomaly was caused exclusively by these gas bubbles embedded in the lake ice (thin frazil ice layer with a few gas bubbles), which can be confirmed by the lower σ0 (-14.50 dB) of a thicker ice on December 13, 2007. Both (Morris et al. 1995) and (Duguay et al. 2002) attributed the strong backscatter during the freeze onset process to the presence of deformation features, such as cracks or ridging/rafting features. However, according to our field observation (Huang et al. 2012), the air-ice interface was flat, smooth and without big fractures during this time. Therefore, this strong backscatter could not be determined by the surface scattering from air-ice interface.
In order to further explore the source of this anomaly, the other five lakes σ0 observed at the same time were compared and listed as follows: -16.25 dB (lake-1), -5.10 dB (lake-3), -20.41 dB (lake-4), -14.01 dB (lake-5), and -14.01 dB (lake-6). These data shows that strong backscattering always accompany significant fluctuation. Moreover, referring to these results from field observed, a similar phenomenon occurred on November 18, 2004 was found. In controlled laboratory conditions, (Leconte et al. 2009) found that there is a significant fluctuation of the backscatter power at shallow ice thickness (about 7-8 cm) for C-band and suggested that the fluctuation may reflect the interference in the backscatter signal that is caused by multiple reflections between air-ice and ice-water interface. In fact, a continuous transition from the coherent to the incoherent behaviour is possible at every zero of cos(2Pj ), where Pj is the
one-way phase, which can be calculated by (Wiesmann and Mätzler 1999):
Pj = (2πhn' cosθj)/λ (1)
where n'≈1.77 for the real part of refractive index
θj≈13.1°for the propagation angle λ=5.62 cm for the wavelength.
According to Eq. (1), the oscillatory behaviour may occur when the ice thickness h approaches to 5.69, 7.32 and 8.94 cm. So, the influence of coherent may be a reasonable explanation when ice thickness of less than 10 cm. On the other hand, many studies reported that local events of air press drop can trigger an abrupt change in the rate of bubble ebullition (Boereboom et al. 2012). The potential increase of ebullition activity in the lake ice may give rise to strong scattering because these bubbles, which ascended from lakebed and then detained against the underside of the lake ice, raise the roughness of ice-water interface (Engram et al. 2012). Therefore, this could be another possible explanation for this anomaly. Since we cannot deduce which one leads to this anomaly with limited observations, more research is needed to improve the understanding of temporal progression of backscatter from lake ice in the early of winter. The decrease of σ0 (from -11.0 dB to -14.0 dB) was observed over the alpine meadow when air temperatures fell several degrees below zeros during the day and soil temperature was below zero. This result is consistent with the findings of (Rignot and Way 1994), who showed a 3 dB decrease for ERS SAR images gathered over the North-South Alaskan as a result of a large decrease in the dielectric constant of soil and vegetation with freezing (Villasensor et al. 1993).
As a lake has iced over, freezing proceeds rapidly and the ice may be 45 to 50 cm thick before the air temperature reaches the lowest at the end of January. Ice reaches its annual maximum thickness of about 70-80 cm by the end of March of the following year. The backscatter of lake ice is characterized by a steady increase with ice thickness growth. The amplitude of variability backscatter ranges from 6 dB to 10 dB and alters slightly due to variations in air temperature or rough interface. Since no snow cover accumulated on the lake surface due to little snow-fall and prevailing strong wind (Huang et al. 2012), much of the backscatter signal can be attributed to the combined effects of reflection off the ice-water interface and volume scattering off bubbles (Jeffries et al. 1994). Conversely, as the winter progresses, we observed a low σ0 value of around -13.0 dB over alpine meadow that remained relatively stable during this period. These results agree with those reported by (Van Der Velde and Su 2009; van der Velde et al. 2012). The soil temperature is primarily below freezing point and soil water is frozen. Under these conditions, the dielectric constant is small and comparable to values for dry soil, which results in a low σ0 response (Fung 1994). Although little snow fall may appear during this time, however, its influence on the backscatter can be ignored because the fresh, dry snow is nearly transparent to C-band radar signals.
In spring, as the air temperature increasing from the end of January, the ice usually starts to melt from middle or late March. The ice begins to float after it has melted sufficiently at the edges to free itself, and the ice cover disappears in late April or early May. According to the observed σ0 over lakes, a significant decrease is identified during spring melt. (Duguay et al. 2002) attributed this phenomenon to: (1) internal melting of the ice and ponding of water that result an increase in specular The International Archives of the Photogrammetry, Remote Sensing and Spatial Information Sciences, Volume XL-7, 2014
reflection; (2) a melting of snow cover causes the absorption of the radar signal. However, the backscatter from lake may fluctuate strongly during subsequent changes to snow and lake ice, which depends on the extent of ice melting, water accumulation and wind strength (Geldsetzer et al. 2010; Howell et al. 2009). As a result of temperature fluctuates above and below 0 °C, the melt-refreeze cycle processes in the Beiluhe basin during this period (Lin et al. 2010), however, the oscillation of σ0 over thermokarst lakes was not observed with the limit of temporal resolution of SAR imagery. As the air temperature increase, the backscatter of alpine meadow σ0 increases from -14.0 dB to -11.0 dB, which can be explained by the change of the dielectric properties of the soil surface due to the thaw of frozen soil water.
4.3 Discussion
Several authors have investigated the sensitivity of ice phenology to climate change by remote sensing method (Howell et al. 2009; Kropáček et al. 2013; Latifovic and Pouliot 2007). In this section, the potential of SAR to extract the ice phenology on the QTP will be discussed. Only on the base of the observed σ
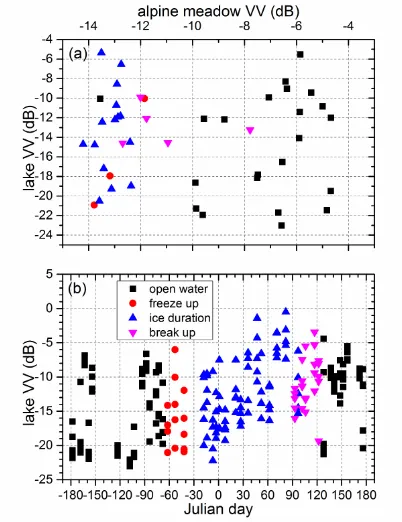
0 over lakes during October, it is very difficult to detect the initial ice formation by threshold (Figure 5). Particularly, the phase interference effect from thin ice and the abrupt changes of backscatter related to ebullition activity make it difficult to infer ice thickness from the radar backscatter. However, the significant downturn-stable-upturn change of alpine meadow σ0 in the freezing-thawing evolution during the cold season can serve as an indicator to extract the ice phenology. Some knowledge on the ice phenology can be summarized as follows:
Figure 6. (a) The scatter plots of σ0 over lake-2 versus over alpine meadow; (b) The scatter plots of σ0 over all selected
lakes versus Julian day.
(1) Freeze-up: with the help of the significant downturn over alpine meadow (from -11.0 dB to -14.0 dB) in the early of winter, the time of establishment of a complete ice cover over
lakes can be identified clearly. In particular, for alpine meadow, the -12.0 dB can be applied as a threshold to distinguish the thawing from freezing condition. (2) Ice duration: when the alpine meadow σ0 remains at about -13.0 dB, the lake ice σ0 is increasing as the growth of ice thickness; (3) Break-up: when the alpine meadow σ0 undergo a significant upturn from about -14.0 dB to -11.0 dB in the early of spring, the lake σ0 shows a great drop. Figure 6 shows the result about the analysis of ice phonology.
Though it is difficult to extract ice phonology accurately due to the limited temporal resolution of SAR imagery in this paper, the reliability of this method is predictable, due to (1) the high thermal inertia of their surface water and waterlogged soils, lake responds more slowly to changes in air temperature than alpine meadow (Morrissey et al. 1996; Villasensor et al. 1993); (2) the variability of dielectric constant of soil is very small during cold season because most of the precipitation occurs from April to September, possessing 92% of the total precipitation and showing that there is little snow in winter (Lin et al. 2011), and the ground roughness that can influence the backscatter from alpine meadow, is also constant in winter, which was confirmed by (Van der Velde et al. 2012).
5. CONCLUSION
Variations of C-band VV-polarization signature observed by SAR over thermakarst lakes on the QTP have been investigated in this study. In order to understand the backscattering features, lake surface temperature, ice thickness, ice crystal type, gas bubble shape and size, as well as ice density are generally collected to fully characterize the observed changes in backscatter.
The following conclusions were obtained from the study: C-band VV polarization ENVISAT-ASAR data exhibits a strong dependence in backscatter intensities with time related to ice growth and decay process on the QTP. Apart from these similarities from the Alaskan lakes, we found some different phenomena that have not previously been reported for these lakes, including: (a) there is no saturated backscatter from floating ice in the Beiluhe Basin, which can be explained by the slower ice growth, more water available under ice layer, no snow ice and thus less gas bubbles embedded in lake ice; (b) The maximum backscatter value (about -5.39~-3.61 dB) from floating ice in the Beiluhe Basin is higher than that from other geographic region, which may be attributed to the rough top and bottom interface induced by the sublimation of surface ice, uneven ice growth and ebullition bubbles underneath the ice layer; (c) As the winter progresses, the gradual increase in area of light tone from the central of lakes towards their margins on SAR image reflects their unique ice process on the QTP. The backscatter from the grounded ice show an increase trends from -18 to -15 dB in winter, which may be explained by the change of roughness induced by the sublimation of surface ice layer. However, its value can reach to -13.5 dB and even higher before melting in spring, which may be attributed to the wet or incompletely frozen sediments due to the strong solar radiation when the surface ice is still frozen.
It’s showed that the stable change trends of alpine meadow σ0 (downturn-stable-upturn) as the freezing-thawing evolution during the cold season can serve as an indicator to time the froze-up and break-up process in these thermokarst lakes of QTP. In fall or spring, for alpine meadow, the -12.0 dB may be applied as a threshold to distinguish the thawing from freezing The International Archives of the Photogrammetry, Remote Sensing and Spatial Information Sciences, Volume XL-7, 2014
condition on the QTP, which is significant for climate change research.
ACKNOWLEDGEMENTS
The present work was supported by the State Key Development Program of Basic Research of China (973 Plan, 2010CB951403, 2012CB026101). The ENVISAT/ASAR data were provided by the European Space Agency (Principal Investigator ID: 17330).
REFERENCES
Antropov, O., Rauste, Y., Lonnqvist, A., & Hame, T. (2012). PolSAR Mosaic Normalization for Improved Land-Cover Mapping. Geoscience and Remote Sensing Letters, IEEE, 9, 1074-1078
Ayed, I.B., Mitiche, A., & Belhadj, Z. (2006). Polarimetric image segmentation via maximum-likelihood approximation and efficient multiphase level-sets. IEEE transactions on pattern analysis and machine intelligence, 1493-1500
Boereboom, T., Depoorter, M., Coppens, S., & Tison, J.L. (2012). Gas properties of winter lake ice in Northern Sweden: implication for carbon gas release. Biogeosciences, 9, 827-838
Brown, L.C., & Duguay, C.R. (2010). The response and role of ice cover in lake-climate interactions. Progress in Physical Geography, 34, 671-704
Duguay, C.R., Pultz, T.J., Lafleur, P.M., & Drai, D. (2002). RADARSAT backscatter characteristics of ice growing on shallow sub‐Arctic lakes, Churchill, Manitoba, Canada. Hydrological Processes, 16, 1631-1644
Elachi, C., Bryan, M.L., & Weeks, W.F. (1976). Imaging Radar Observations of Frozen Arctic Lakes. Remote Sensing of Environment, 5, 169-175
Engram, M., Anthony, K.W., Meyer, F.J., & Grosse, G. (2012). Synthetic aperture radar (SAR) backscatter response from methane ebullition bubbles trapped by thermokarst lake ice.
Canadian journal of remote sensing, 38, 667-682
Fujun, N., Xingfu, L., Wei, M., Qingbai, W., & Jian, X. (2008). Monitoring study on the boundary thermal conditions of duct-ventilated embankment in permafrost regions. Cold Regions Science and Technology, 53, 305-316
Galland, F., Nicolas, J.M., Sportouche, H., Roche, M., Tupin, F., & Refregier, P. (2009). Unsupervised Synthetic Aperture Radar Image Segmentation Using Fisher Distributions. Geoscience and Remote Sensing, IEEE Transactions on, 47, 2966-2972
Geldsetzer, T., Sanden, J.v.d., & Brisco, B. (2010). Monitoring lake ice during spring melt using RADARSAT-2 SAR.
Canadian journal of remote sensing, 36, S391-S400
Geldsetzer, T., & van der Sanden, J.J. (2013). Identification of polarimetric and nonpolarimetric C-band SAR parameters for application in the monitoring of lake ice freeze-up. Canadian journal of remote sensing, 39, 263-275
Hirose, T., Kapfer, M., Bennett, J., Cott, P., Manson, G., & Solomon, S. (2008). Bottomfast Ice Mapping and the Measurement of Ice Thickness on Tundra Lakes Using C-Band Synthetic Aperture Radar Remote Sensing1. JAWRA Journal of the American Water Resources Association, 44, 285-292
Howell, S.E.L., Brown, L.C., Kang, K.-K., & Duguay, C.R. (2009). Variability in ice phenology on Great Bear Lake and Great Slave Lake, Northwest Territories, Canada, from SeaWinds/QuikSCAT: 2000–2006. Remote Sensing of Environment, 113, 816-834
Huang, W., Han, H., Shi, L., Niu, F., Deng, Y., & Li, Z. (2013). Effective thermal conductivity of thermokarst lake ice in Beiluhe Basin, Qinghai-Tibet Plateau. Cold Regions Science and Technology, 85, 34-41
Huang, W., Li, Z., Han, H., Niu, F., Lin, Z., & Leppäranta, M. (2012). Structural analysis of thermokarst lake ice in Beiluhe Basin, Qinghai–Tibet Plateau. Cold Regions Science and Technology, 72, 33-42
Jeffries, M.O., Morris, K., Weeks, W.F., & Wakabayashi, H. (1994). Structural and stratigraphic features and ERS 1 synthetic aperture radar backscatter characteristics of ice growing on shallow lakes in NW Alaska, winter 1991–1992.
Journal of Geophysical Research: Oceans, 99, 22459-22471
Jeffries, M.O., Morris, K., & Kozlenko, N. (2005). Ice Characteristics and Processes, and Remote Sensing of Frozen Rivers and Lakes. Remote Sensing in Northern Hydrology: Measuring Environmental Change (pp. 63-90): American Geophysical Union
Jones, B.M., Grosse, G., Arp, C.D., Jones, M.C., Walter Anthony, K.M., & Romanovsky, V.E. (2011). Modern thermokarst lake dynamics in the continuous permafrost zone, northern Seward Peninsula, Alaska. Journal of Geophysical Research: Biogeosciences, 116, G00M03
Karlsson, J.M., Lyon, S.W., & Destouni, G. (2012). Thermokarst lake, hydrological flow and water balance indicators of permafrost change in Western Siberia. Journal of Hydrology, 464–465, 459-466
Kirillin, G., Leppäranta, M., Terzhevik, A., Granin, N., Bernhardt, J., Engelhardt, C., Efremova, T., Golosov, S., Palshin, N., Sherstyankin, P., Zdorovennova, G., & Zdorovennov, R. (2012). Physics of seasonally ice-covered lakes: a review. Aquatic Sciences, 74, 659-682
Kokelj, S.V., & Jorgenson, M.T. (2013). Advances in Thermokarst Research. Permafrost and Periglacial Processes, 24, 108-119
Kropáček, J., Maussion, F., Chen, F., Hoerz, S., & Hochschild, V. (2013). Analysis of ice phenology of lakes on the Tibetan Plateau from MODIS data. The Cryosphere, 7, 287-301
Leconte, R., Daly, S., Gauthier, Y., Yankielun, N., Bérubé, F., & Bernier, M. (2009). A controlled experiment to retrieve freshwater ice characteristics from an FM-CW radar system.
Cold Regions Science and Technology, 55, 212-220
Lin, Z., Niu, F., Liu, H., & Lu, J. (2011). Hydrothermal processes of Alpine Tundra Lakes, Beiluhe Basin, Qinghai-Tibet Plateau. Cold Regions Science and Technology, 65, 446-455
Lin, Z., Niu, F., Xu, Z., Xu, J., & Wang, P. (2010). Thermal regime of a thermokarst lake and its influence on permafrost, Beiluhe Basin, Qinghai-Tibet Plateau. Permafrost and Periglacial Processes, 21, 315-324
Ling, F., & Zhang, T. (2012). Numerical simulation of permafrost thermal regime and talik development under shallow thaw lakes on the Alaskan Arctic Coastal Plain. Journal of Geophysical Research: Atmospheres, 108, 4511
Liu, J., Wang, S., Yu, S., Yang, D., & Zhang, L. (2008). Climate warming and growth of high-elevation inland lakes on the Tibetan Plateau. Global and Planetary Change, 67, 209-217
Marsh, P., Russell, M., Pohl, S., Haywood, H., & Onclin, C. (2009). Changes in thaw lake drainage in the Western Canadian Arctic from 1950 to 2000. Hydrological Processes, 23, 145-158
Morris, K., Jeffries, M.O., & Weeks, W.F. (1995). Ice processes and growth history on Arctic and sub-Arctic lakes using ERS-1 SAR data. Polar Record, 31, 115-128
Morrissey, L.A., Durden, S.L., Livingston, G.P., Steam, J.A., & Guild, L.S. (1996). Differentiating methane source areas in Arctic environments with multitemporal ERS-1 SAR data.
Geoscience and Remote Sensing, IEEE Transactions on, 34, 667-673
Niu, F., Lin, Z., Liu, H., & Lu, J. (2011). Characteristics of thermokarst lakes and their influence on permafrost in Qinghai– Tibet Plateau. Geomorphology, 132, 222-233
Rignot, E., & Way, J.B. (1994). Monitoring freeze—thaw cycles along North—South Alaskan transects using ERS-1 SAR.
Remote Sensing of Environment, 49, 131-137
Shenbin, C., Yunfeng, L., & Thomas, A. (2006). Climatic change on the Tibetan Plateau: Potential Evapotranspiration Trends from 1961–2000. Climatic Change, 76, 291-319
Toutin, T., Wang, H., Chomaz, P., & Pottier, E. (2013). Orthorectification of Full-Polarimetric Radarsat-2 Data Using Accurate LIDAR DSM. Geoscience and Remote Sensing, IEEE Transactions on, 51, 5252-5258
Van Der Velde, R., & Su, Z. (2009). Dynamics in land-surface conditions on the Tibetan Plateau observed by Advanced Synthetic Aperture Radar (ASAR). Hydrological Sciences Journal, 54, 1079-1093
Van der Velde, R., Su, Z., van Oevelen, P., Wen, J., Ma, Y., & Salama, M.S. (2012). Soil moisture mapping over the central part of the Tibetan Plateau using a series of ASAR WS images.
Remote Sensing of Environment, 120, 175-187
Villasensor, J.D., Fatland, D.R., & Hinzman, L.D. (1993). Change detection on Alaska's North Slope using repeat-pass ERS-1 SAR images. Geoscience and Remote Sensing, IEEE Transactions on, 31, 227-236
Walter, K.M., Engram, M., Duguay, C.R., Jeffries, M.O., & Chapin, F.S. (2008). The Potential Use of Synthetic Aperture Radar for Estimating Methane Ebullition From Arctic Lakes1.
JAWRA Journal of the American Water Resources Association, 44, 305-315
Wegmuller, U., Santoro, M., Werner, C., Strozzi, T., & Wiesmann, A. (2010). Estimation of ice thickness of tundra lakes using ERS - ENVISAT cross-interferometry. In,
Geoscience and Remote Sensing Symposium (IGARSS), 2010 IEEE International (pp. 316-319)
Wiesmann, A., & Mätzler, C. (1999). Microwave Emission Model of Layered Snowpacks. Remote Sensing of Environment, 70, 307-316
Wu, Q., Zhang, P., Jiang, G., Yang, Y., Deng, Y., & Wang, X. (2014). Bubble emissions from thermokarst lakes in the Qinghai–Xizang Plateau. Quaternary International, 321, 65-70
Wu, Q., & Zhang, T. (2008). Recent permafrost warming on the Qinghai-Tibetan Plateau. Journal of Geophysical Research: Atmospheres, 113, D13108
Yang, K., Ye, B., Zhou, D., Wu, B., Foken, T., Qin, J., & Zhou, Z. (2011). Response of hydrological cycle to recent climate changes in the Tibetan Plateau. Climatic Change, 109, 517-534
Yue, B., Chamberland, J., & Mulvie, J. (2013). Bottom-fast ice delineation with PolSAR and InSAR techniques in the Mackenzie Delta region, Northwest Territories, Canada.
Canadian journal of remote sensing, 39, 341-353 The International Archives of the Photogrammetry, Remote Sensing and Spatial Information Sciences, Volume XL-7, 2014