RECONSTRUCTION AND SIMPLIFICATION OF URBAN SCENE MODELS
BASED ON OBLIQUE IMAGES
Jianchen Liu a , Bingxuan Guob, *
a Wuhan University, School of Remote Sensing and Information Engineering , Luoyu Road 129, Wuhan, China [email protected]
b Wuhan University, State Key Laboratory of Information Engineering in Surveying, Mapping and Remote Sensing, Luoyu Road 129, Wuhan, China
Commission III, WG III/1
KEY WORDS : urban scene models, oblique images, Self-Adaptive Patch, 2-manifold surface, simplification
ABS TRACT:
We describe a multi-view stereo reconstruction and simplification algorithms for urban scene models based on oblique images. The complexity, diversity, and density within the urban scene, it increases the difficulty to build the city models using the oblique images. But there are a lot of flat surfaces existing in the urban scene. One of our key contributions is that a dense matching algorithm based on Self-Adaptive Patch in view of the urban scene is proposed. The basic idea of matching propagating based on Self-Adaptive Patch is to build patches centred by seed points which are already matched. The extent and shape of the patches can adapt to the objects of urban scene automatically: when the surface is flat, the extent of the patch would become bigger; while the surface is very rough, the extent of the patch would become smaller. The other contribution is that the mesh generated by Graph Cuts is 2-manifold surface satisfied the half edge data structure. It is solved by clustering and re-marking tetrahedrons in s-t graph. The purpose of getting 2-manifold surface is to simply the mesh by edge collapse algorithm which can preserve and stand out the features of buildings.
* Corresponding author.
1. INTRODUCTION
In recent years,oblique photography technology is a new
developed high-tech in surveying and mapping field. It can capture more information including the facade texture of the buildings, which make the models of buildings more realistic. The 3D reconstruction of urban environments from multi-view stereo images is a well-known computer vision problem which has been addressed by various approaches. But it remains a challenging issue (M ayer, 2008), (Zhu, 2008). The complexity, diversity, and density within the urban scene, it increases the difficulty to automatically fast and exactly build the city model using the oblique images. But the urban scene has its own characteristics that the building is regular and a lot of flat surfaces exist in the urban scene. If the surface is flat, the extent of the patch should become bigger; while the surface is very rough, the extent of the patch should become smaller. So a Self-Adaptive Patch is needed in matching propagating of patch based multi-view stereo algorithm (Furukawa, 2010) and the simplification of 3D models generated by the Graph Cuts (Labatut, 2007) is necessary. In this paper, a dense matching algorithm based on Self-Adaptive Patch in view of urban scene have been accomplished and mesh simplification is achieved using the 2-manifold surface generated in s-t graph.
1.1 Related Work
In the literature, urban scene reconstruction from multi-view stereo images has attracted a lot of experts in the field of computer version and photogrammetry. The work of urban scene reconstruction includes image orientation, dense matching, meshing, simplification and texture mapping. A hybrid multi-view stereo algorithm (Lafarge, 2013) has been proposed for modelling urban scene. The 3D models of urban scenes is a combination of meshes and geometric primitives. Through the segmentation of initial mesh, it can well preserve the details of irregular elements and best fit the feature of regular buildings. The work (Salman, 2010) proposes a method from 3D point clouds to extract feature line getting feature preserving mesh. The potential sharp edges points is detected then cluster them to get polylines. The polylines are combined to implicit surface reconstruction through feature preserving mesh generation to output a 3D mesh where the sharp edges are embedded explicitly and appear as a subset of the triangle edges.
Dense image matching methods enable the extraction of 3D surface geometry from oriented images. Even through many dense image matching algorithms have been proposed, only few The International Archives of the Photogrammetry, Remote Sensing and Spatial Information Sciences, Volume XL-3, 2014
methods are publically available and is suitable for aerial images to retrieve digital surface models of urban scene. Popular solutions are for example SGM (Hirschmuller, 2008) and PM VS (Furukawa, 2010) and its extension CM VS or CM PM VS (Jancosek, 2011). The patch in PM VS is generated through the initial feature matching and optimization in multi-views, the location and normal of patch is optimized by the photometric discrepancy of multi-views. After expanding and filtering, we can get the point cloud of object. It suitable for closed objects as well as open scenes. But it is incapable for the surface lack of texture for example water and highlights. The Semi Global M atching method is done accurately on a pixel level by optimization of a global cost function. The advantages of Semi Global M atching is its semi-global optimization, where neighbouring pixels are taken into account to extract smooth surface. It can handle repetitive or low textured images.
Using a set of 3D points, constructing a triangulation mesh is a difficult problem. There are usually two ways to mesh the point cloud, converting the cloud to mesh with a possibly modified underlying vertex set, for example Poisson surface reconstruction (Kazhdan, 2006) and M oving least-squares(M LS) (Cuccuru, 2009); and converting the cloud to mesh without modifying vertex positions, for example Ball-pivoting algorithm (BPA) (Bernardini, 1999) and Graph Cuts (Labatut, 2007). But Poisson surface reconstruction is especially useful for lasers scanners where you have a normal and it has the issues that it
can’t preserve the original volume. Ball-pivoting algorithm is patented by IBM and is not suitable for point clouds with varying point density. In paper (Labatut, 2007) the author propose a novel approach that can handle closed as well as open scenes and can yield watertight surface. It use irregular tetrahedrons that the real surface is contained to decompose the space, then label the tetrahedrons by intersection vote of ray emanating from the vertex to the camera centre, at last a globally optimal method Graph Cuts is used to solve the final surface. The work (Labatut, 2009) is similar to the above, using range data to build model and making some modifications. A tolerance
parameter σ is introduced and a weight of visibility is added to
the facets intersected by the ray according the distance between vertex and facet along the line of sight. It effectively solve the bumpy surface and mislabels inside the model. Some improvement has been made in (Jancosek, 2011) based on
(Labatut, 2009). The value
vis is not a constant any more, it isdecided by the number of surrounding points and associated cameras. There is a large free jump on real surface of both densely sampled and weakly supported. According to this discovery, the t-weight of near and inside the weakly -supported surface is changed, so it can construct weakly -supported surface as well as densely sampled surface.
1.2 Novelty of Our Approach
One of our key contributions is that a dense matching algorithm based on Self-Adaptive Patch in view of the urban scene is proposed. The extent and shape of the patches can adapt to the objects of urban scene automatically according to the flatness of
the surface. For the surface lack of texture (e.g. low-texture walls, windows and shadow), it can also generate dense points using Self-Adaptive Patch. The other contribution is that the mesh generated by Graph Cuts is 2-manifold surface by clustering and re-marking tetrahedrons in s-t graph.
2. RECONS TRUCTION ALGORITHM
2.1 Dense Matching
Our Self-Adaptive Patch-based multi-view stereo algorithm is similar to the PM VS algorithm (Furukawa, 2010). The process is also divided into three steps: initial feature matching, patch expansion and patch filtering. The initial feature detection is fulfilled by Harris and difference-of-Gaussians operators. For each detected feature f, we collect all same type features F in the other images and triangulate the 3D points associated with the pairs (f, F). A candidate patch with its centrec p
( )
, normal vectorn p( )
and reference imageR p( )
is initialized. c p( )
and( )
n p are optimized by moving along a ray and two Euler
angles to produce a sparse set of seed points for which the supported images is no less than 3. The supported images mean that the normalized cross correlation score is larger than threshold α and the view angle is smaller than threshold . The view angle threshold is adjusted and described in next paragraph. Given these patches, the next step is to expand the initial matches to nearby pixels and obtain a dense set of points. The expansion method in PM VS is to generate at least one patch in every image cell and we repeat taking existing patches and generating new ones in neighbouring empty cells. Given a patch
p, we first identify a set of neighbouring image cellsC p
( )
. If a patch has been already reconstructed in the neighbouring cell, this cell will not be expanded. Otherwise then p( ')
,R p( ')
and( ')
V p are initialized by the corresponding values of p. V p
( ')
is the visible images of point p'
. Then p'
is optimized similarly to thep. In this paper we proposed a Self-AdaptivePatch expansion described in section 3.1 which can best fit the flat surface of urban scene.
O1 O2 O3
I1 I2 I3
C(p) n(p)
β
object
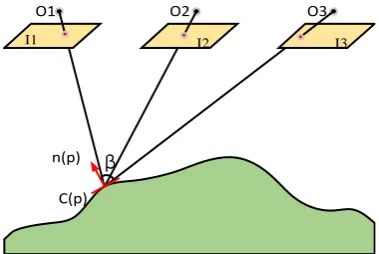
Figure 1. View angle constraint. The angle α between the patch normal n p
( )
and the ray from the patch c p( )
to the opticalcentre O (I) is larger than π/3, the image I is invalid. The International Archives of the Photogrammetry, Remote Sensing and Spatial Information Sciences, Volume XL-3, 2014
The patch based multi-view stereo algorithm downloaded from the website http://www.di.ens.fr/pmvs/, can’t directly use for oblique images to yield good result. We should change the data type from float to double for geographic coordinates. In the feature matching step, when the angle α between the patch normal n p
( )
and the ray from the patch c p( )
to the optical centre O I( )
is larger than π/3, the image I is invalid (shown in figure 1). In our cases, the images is captured from five different angles shown in section 4.1 at the same time from the aerial platform. The angle between vertical image and tilt image is π/4, and the angle between tilt images is larger than π/3. The forward overlap is 80 percent and side overlap is 60 percent. As the angle between oblique images is too large, the threshold π/3 to apply in oblique image produces few patches. In our experiment we set the value of view angle threshold is 5π/1β, thus the point density of patches for oblique images is equivalent to the close-range images.2.2 Meshing
In this paper, mesh has been implemented it on work with significant modifications. While three terms: surface-visibility, photo-consistency and area-smoothness are used in marking the s-t graph in (Labatut, 2007), we only use two of them: surface-visibility and area-smoothness. The result of point cloud yielded from method mentioned in section 3.1 is rather good not including much noise and outliers, so the photo-consistency is not efficient in build the mesh and it is time-consuming. We denote S the surface to be reconstructed and E the energy of the surface:
( )
vis vis( )
area area( )
E S
E S
E S (1)Where
vis and
area are positive weight. M inimizing E S( )
with respect to S leads to the final real surface.In the process of building the tetrahedron using dense matching points, all points not including the camera position is used to build the Delaunay tetrahedron by inserting one point into tetrahedrons at once gradually. For each vertex of tetrahedron, its position, list of source images it originates from and the associated points it merges from is stored. Each time a candidate point is to be added to the tetrahedron, the nearest vertex of the tetrahedron is searched then the two points is projected into all images from which the two points can be seen getting the maximum projection distance. If the distance is above some threshold, the candidate is inserted into the Delaunay tetrahedron, else the position of its nearest vertex is updated by averaging the associated points and the list of source images and associated points are also updated by the candidate.
We use different
vis value mentioned in (Jancosek, 2011). It isdenoted by: the surrounding points of vertex P.
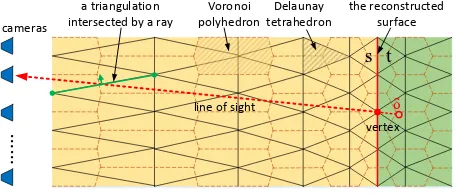
the reconstructed
Figure 2. Illustration of the s-t graph based on surface reconstruction. The triangulation intersected by the red ray i.e. the weight of corresponding directional edge in s-t graph is add a
value. The δ is the shift distance which is used for locating the tetrahedron linked to sink. The last tetrahedron intersected by
the ray or containing the camera is linked to source. The principle of s-t graph based on surface reconstruction is shown in Figure 2. The directional edge and node in the Voronoi polyhedron correspond the directional edge and node of s-t graph. The triangulation denotes the Delaunay tetrahedron. The brown polygon denotes the dual graph of Delaunay tetrahedron. The red dotted line is the line of sight. The triangulation that is intersected by the ray, the corresponding directional edge weight
of s-t graph is add a vis( )p value. The δ is the shift distance which is used for locating the tetrahedron for which the t -weight
is added avis( )p value. The last tetrahedron intersected by the
ray or containing the camera is added infinite s-weight. After considering all cameras and vertices, the s-t graph is accomplished. The maximum flow algorithm is used to solve the final reconstruction surface. Finally the directional triangulation going from tetrahedron labelled as sink to the tetrahedron labelled as source is on the final reconstruction surface. But the
mesh doesn’t satisfy the half edge data structure, the problem and solution is described in section 3.2.
A tolerance parameter σ is introduced in paper (Labatut, 2009). It mainly solves the bumpy surface and many handles inside the model. The surface is mainly decided by the t tetrahedrons. If we set a large value of sigma σ, the surface will become smoother. But it may cause shrink of surface. In our case the parameter σ should be very small, otherwise it may cause many mistakes because of the complexity of urban scenes. The large value of
parameter σ cause that the vertical surface of building can’t be
restored. Because the t weight of tetrahedrons outside the real vertical surface of building is too high. So the value of parameter
σ should be set very small, in our paper it is mainly used to
locate the t tetrahedron.
3. OUR APPOACH
In this section we derail the method of Self-Adaptive Patch which is suitable for urban scene 3D-modeling based on oblique images. The purpose to improve the meshing method based on Graph Cuts is to acquire 2-mamifold surface satisfied the half edge data structure so that the mesh can be simplified by the approach of edge collapse. After finding the problems we can get the desirable mesh by clustering and re-marking tetrahedrons. The International Archives of the Photogrammetry, Remote Sensing and Spatial Information Sciences, Volume XL-3, 2014
3.1 S elf-Adaptive Patch Expansion
3.1.1 S elf-Adaptive Patch
In this paper we propose a Self-Adaptive patch expansion method. It not only speed the expanding process but also generate high quality point cloud that can best fit the flat surface of objects. The basic idea of matching propagating based on Self-Adaptive Patch is that the extent and shape of the patches can adapt to the objects of urban scene automatically. The size and shape of patches are adaptive to the terrain relief and the number of expansion points is depending on the extent of patch. The illustration of Self-Adaptive Patch is shown as below.
object patch
points
Figure 3. Illustration of Self-Adaptive Patch. The patches are adaptive to the terrain relief and the number of expansion points
is depending on the extent of patch.
The Self-Adaptive Patch is initialized with centrec p
( )
, normal vectorn p( )
and reference imageR p( )
by the corresponding values of original patch, its image projection in reference image is rectangle whose edges is parallel to the axis of the reference camera R p( )
. The extent of the rectangle is defined asm
2
m
2
pixels (in our casesm2
3
m1
21
). m1
is the size of original patch used in initial feature matching.3.1.2 Photometric Discrepancy Function
LetV p
( )
denote a set of images in which p is visible.ncc
is normalized cross correlation score betweenR p( )
and one of visible imagesV p( )
. The photometric discrepancy function for Self-Adaptive Patch is defined as below:0 points on image I0and their projections of all the grid points in
visible image Ij . Pixel colours are computed by bilinear
interpolation. For images with RGB channels, the
ncc
value is defined as below:The extent of patch is adjusted by the
patch
NCC value which make
the patch best fit the real surface of objects. If the
patch
NCC value
of initial patch is more than threshold (0.8 in our cases), we should enlarge the patch and examine its photometric
discrepancy score (Eq. 3). If theNCCpatch value of initial patch is
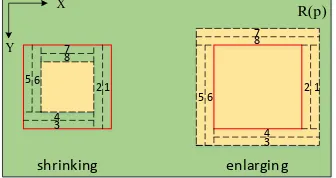
less than threshold , it denotes that the surface covered by the patch is not flat and the patch should become smaller. The process of adapting patch is based on the four directions of rectangular projections on reference image ( )R p . The adapting
order in four directions of rectangular projections is _
,
,
,
x
y
x
y
. The procedure of enlargement is fulfilled at four directions separately , for one direction the enlargement (2 pixels each time) is continuous until the photometric discrepancy score is less than threshold . When we downsize the extent of patch at one direction, if photometric discrepancy score is become bigger we continue downsizing the patch at this direction, otherwise we change to another direction to do the same process until photometric discrepancy score is more than threshold or reaching the extent of original patch ( 7×7 pixels).Finally, the geometric parameters, ( )c p and ( )n p of adapted patch are optimized by simply minimizing the photometric discrepancy score (Eq. 3). The Self-Adaption process is shown as below.
Figure 4. Illustration of Self-Adaption process. The red lines denote the initial patch boundary. The dotted lines denote adaption boundary. The numeric denote the order of adaption. 3.1.4 Expansion Method
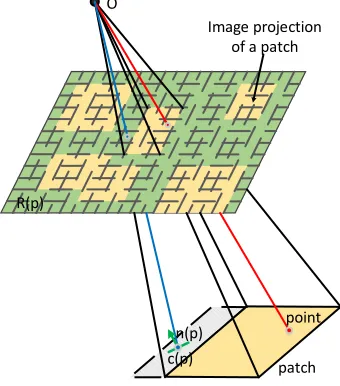
The purpose of expansion is to generate dense point cloud. In our approach, we keep track of the image projections of reconstructed patches in their visible images. First, we associate
with each image Ii a regular grid of 1 × 1pixels cellsCi
x y,as in figure 5( 1=2 in our experiments). We project adapted patches and points into each image in V p( )to identify the
boundary of patch and corresponding cells of points. Then, each
cellCi
x y, remembers the set of pointsQi
x y, that projectinto it. The goal of the expansion step is to reconstruct at least
one point in every image cellCi
x y, . M ore concretely, the process is divided into two steps: expansions within and outside the patch projections. First, starting from the image cells that within the patch projections (the yellow area shown in figure 5), if there is no point in the cells the expansion procedure is necessary in the corresponding cells. The points (red points in figure 5) are generated by intersection of patch and ray passing The International Archives of the Photogrammetry, Remote Sensing and Spatial Information Sciences, Volume XL-3, 2014through the corresponding cells. This procedure is performed in all images by repeatedly projecting patches and points onto corresponding visible images. Although the patches may be partially overlapped on the object surface, the points are not overlapped by this method. The second step is to perform the expansion outside the patch projections. The procedure is similar to the expansion in PM VS, described in section 2.1.
O
Figure 5. Illustration of expansion. The red point is generated by expansion within the p atch projections and the blue point
denote the expansion outside the patch projections. 3.2 Improved Meshing Method
3.2.1 Problem of Mesh Generated by Graph Cuts In a finite directed graph
g=
,
,
denotes the nodes that is the tetrahedron,
denotes the directional edges that is the oriented triangular face between adjacent tetrahedrons. There are also two another nodes s and t. After the non-negative weights of directional edges, s and t are added into the s-t graph as the way mentioned in section 2.2, the minimum of s-t graph partition the nodes into two disjoint set s and t by removing the edge connecting two sets of nodes. This meanss t
v
s t
. The reconstructed mesh contains all oriented triangular face directed from tetrahedron labelled as t to tetrahedron labelled as s. A mesh can be simplified if and only if it satisfies the half edge structure (M cGuire, 2010). The mesh produced by the Graph Cuts is not satisfied the half edge data structure, because the phenomenon shown as below.t
t
t
t
t
t
t
t
t
t
point or line in which does not satisfy the half-edge data structure
Isolated tetrahedrons labeled as t that is not desired
Figure 6. Isolated island phenomenon. The green point denotes the location where the problem exist.
t
t
t
t
t
t
t
t
t
point or line in which does not satisfy the half-edge data structure elephant nose labeled
as t that is not desired
Figure 7. “Elephant nose” phenomenon. The green point shown in figure denotes the point or line that does not satisfy the half
edge data structure.
The tetrahedrons shown in figure 6 and figure 7 are partitioned into s or t by minimum cut of s-t graph. The green points shown in figure 6 and figure 7 denote the vertices or lines of the reconstructed mesh where the problems exist. If s and t are exchanged in figure 6 and figure 7, the problem will still exist in the locations of green point. According to the principle of half edge data structure, the incidental half edges of a vertex are only one clockwise ring neighbour and an edge can only been used twice by its incidental faces as it only has two directions i.e. the mesh is a 2-manifold surface. In figure 8, the green triangulations is the reconstructed mesh, in which the green line and green
Two points and line in which does not satisfy the half-edge data structure
Figure 8. Cross phenomenon. The green point and line shown in
figure don’t satisfy the half edge data structure.
3.2.2 S olution in s-t graph
Principle: The problem of mesh generated by the Graph Cuts is that the mesh is not a 2-manifold surface. We solve it in s-t graph after binary labelling by minimum cut. Our solution start from each vertex of tetrahedron by classifying the incidental labelled tetrahedrons into groups. If the number of groups is only one, it means this vertex will not be contained into the surface mesh, otherwise this vertex will be the item of the mesh. If the group number is two, the vertex and its incidental edges in mesh satisfy the half edge data structure. The vertex will have problem if the group number is more than two. By changing the labels of incidental tetrahedrons to make it only have one or two groups at each vertex of tetrahedrons, we can get the 2-manifold The International Archives of the Photogrammetry, Remote Sensing and Spatial Information Sciences, Volume XL-3, 2014
surface. This principle is shown in figure 9, changing the label of group 1 shown in figure9 (a) into source make the reconstructed mesh changed (shown in figure9 (b)) and satisfy the half edge data structure. The final mesh is watertight and non-intersecting.
s s
s
t s
s
t t t t the reconstructed
surface the tetrahedron
labeled as s
the tetrahedron labeled as t s
t s
t t t t
t t t
1 1 1
2 2
3 3
3 3 3
(a) (b)
Figure 9. Illustration of changing labels in s-t graph. Changing the label of group 1 shown in (a) into source make the reconstructed mesh satisfy the half edge data structure. Clustering and Re-marking: Given a set of incidental labelled tetrahedrons of a vertex, the classified groups are achieved by growing method through the property of connectivity . Starting from some tetrahedron, the same labels of tetrahedron neighbours that are adjacent by the triangulation facet are added into a group. Then finding the same labels of all added tetrahedrons neighbours until there is no same label in the neighbours. Then building a new group, repeating the above work until all incidental labelled tetrahedrons have been classified. After clustering the neighbour of all vertices, we can
find the vertices that don’t satisfy the half edge data structure through the number of groups. If the group number at a vertex is more than two, then the label of some groups need to be changed. If the s group is only one, we change all t labels into s excluding the biggest t group. If the t group is only one, it is the same way as above. If both t and s group number are more than one, we calculate the t number and s number of incidental labelled tetrahedrons of the vertex. Changing the labels of smaller ones into the other, make the group number is only one. It is processed iteratively, until the group number of all vertices neighbours is no more than two. Thus the mesh generated by the Graph Cuts is a 2-manifold surface.
4. EXPERIMENT EXAMPLE
4.1 Data Description
The image data of Chinese Guiyang block are captured by the SWDC-5 aerial multi-angle oblique photography system composed of five large format digital cameras: one vertical angle and four tilt angles, and GPS/IM U unit which automatically registers the acquired data. The image size of five cameras is 8176×6132 and pixel size is 6µ. The angle of four tilt cameras
is 45º relative to the vertical camera. The focal length of tilt
cameras is 80mm and that of vertical camera is 50mm. The relative height of flight is 1000m. The distance of adjacent strips is 500m and that of adjacent images within the same strip is 150m. Coordinates are recorded in WGS-84 coordinate system. The oblique photography system overturns the limitation of traditional aerial photos that can only be taken from the vertical
angle. It can capture more information including the facade texture of the buildings for application in 3D urban scene modelling with more realistic appearance.
4.2 Implementation details
The point cloud is acquired from the Self-Adaptive Patch method based on PM VS. Then the Delaunay tetrahedron is computed using the Computational Geometry Algorithms Library (CGAL) (Lafarge, 2013). After adding all weights to the s-t graph as the way mentioned in section 2.2, we compute the minimum cut of s-t graph using the software describe in (Boykov, 2004). In our experiment, the value of σ is 1/β of the mode length of tetrahedron edges. The value of
visis 10 and thevalue of
area is 1/10 of the average area of all tetrahedron facets.The values of
vis and
area are used to balance the weights ofvisibility and area.
The simplification is also achieved based on CGAL. Surface
mesh simplification (Zhou, 1998) is the process of reducing the number of faces used in the surface while keeping the overall shape, volume and boundaries preserved as much as possible. Simplification algorithm use the method known as edge collapse which consists of iteratively replacing an edge with a single vertex, removing 2 triangles per collapse. Edges are collapsed according to a priority given by a user-supplied cost function. The algorithm terminates when a user-supplied stop predicate is met, such as reaching the desired number of edges.
4.3 Performance Discussion
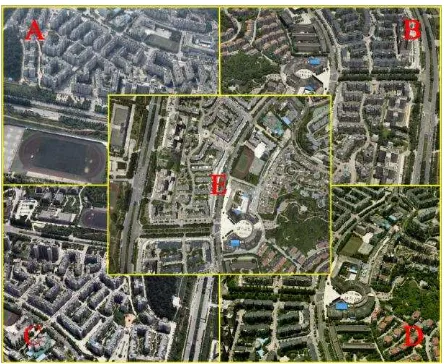
In this section, we show the result of our reconstruction algorithm compared to the manual models. We choose 15 calibrated oblique images covering the same urban scene, 3 images in each direction. The area covered by 15 images is 950000m2. The urban scene is diverse and complex: covering different shape buildings, trees and roads.
Figure 10. Five images of Chinese Guiyang captured by the oblique camera. A B C D are tilt images and E is the vertical
image.
Figure 11. The result of reconstruction experiment. Picture (a) is the 3D point cloud produced by multi-view matching; (b) is the
triangular mesh yielded by Graph Cuts; (c) is the result of simplification; (d) is the final result with the real texture.
Figure 12. Different levels of simplified models. The (a) is the orginal mesh containing 1301080 vertices and 2600903 faces; (b)
(c) (d) are the simplified models respectively contain 81071 10094 5022 vertices and 162163 20239 10103 faces. Figure 10 shows the data used in our experiment. A B C D are tilt images and E is the vertical image. There is significant deformation in tilt images. The result of our experiment workflow is shown in figure 11: dense point cloud generated by our method is shown in (a) with 1478413 points, (b) shows 2-manifold mesh with 1301080 vertices and 2600903 triangular faces, (c) is the simplified mesh with 10094 points and 20239 triangular faces and (d) is our final result with real texture. Figure 12 shows the different levels of simplified models, we can see that the feature of simplified models are preserved and the data size is significant downsized. It demonstrated that the 2-mamifold mesh generated by our method is meaningful. The flat surface can be presented by a few of faces and the edges of buildings are standed out.
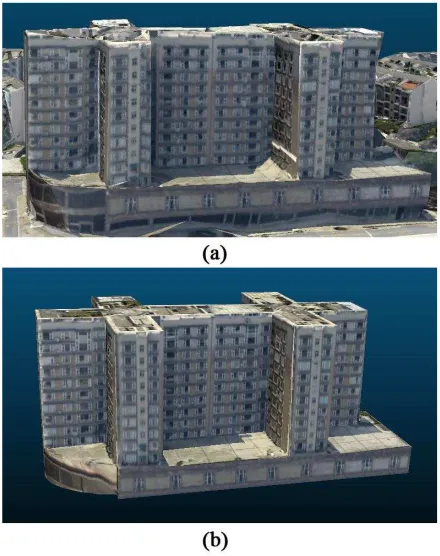
Figure 13. Comparison of 3D model with image form the same view point. Picture (a) is the image captured by B tilt camera; (b)
is the 3D model viewed from the same point.
Figure 14. Comparison of our model with the manual model. The (a) is the 3D model generated in our method; (b) is the 3D
manual model.
Figure 13 shows the comparison of 3D-models with the image viewed from the same point. It is difficult to distinguish which one is the 3D-models and it demonstrates that our reconstruction is realistic. Figure 14 shows comparison of our model with the manual model in large-scale. We can see that our 3D-models which is constructed automatically is not as good as the manual models, but the appearance of our models are close to the manual models.
5. CONCLUS IONS AND FUTURE WORK
5.1 Conclusions
We have proposed a method to reconstruct the urban scene models based on the oblique images. In the dense matching step, our work is based on the PM VS and we propose a novel algorithm for expansion that Self-Adaptive Patch can best fit the object surfaces of urban scene automatically . The extent of patch is adjusted by the photometric discrepancy score. Higher accuracy dense point cloud is acquired by sampling the patch and refining the points outside the patch. The expansion method proposed by us is faster than PM VS and it is suitable for 3D-modeling based on oblique images. Our meshing method is based on the Graph Cuts, but the final result is 2-manifold surface which can be simplified using edge-collapse algorithm. The idea of generating 2-manifold surface in s-t graph is our key contribution. By long time observation, we find the problems which are solved by clustering and re-marking tetrahedrons. As the building is regular, the simplified mesh can not only downsize the data amount but also can stand out the features the buildings. We choose a real and complex urban scene to perform our experiment, our result shows that the reconstruction models are high quality and our algorithm is effective by comparing to the manual models.
References
M ayer, H. (2008). Object extraction in photogrammetric computer vision. ISPRS Journal of Photogrammetry and Remote Sensing, 63(2), 213-222.
Zhu, Z., & Kanade, T. (2008). M odeling and representations of large-scale 3D scenes. International Journal of Computer Vision, 78(2), 119-120.
Hirschmuller, H. (2008). Stereo processing by semiglobal matching and mutual information. Pattern Analysis and M achine Intelligence, IEEE Transactions on, 30(2), 328-341.
Furukawa, Y., & Ponce, J. (2010). Accurate, dense, and robust multiview stereopsis. Pattern Analysis and M achine Intelligence, IEEE Transactions on, 32(8), 1362-1376.
Jancosek, M ., & Pajdla, T. (2011, June). M ulti-view reconstruction preserving weakly -supported surfaces. In Computer Vision and Pattern Recognition (CVPR), 2011 IEEE Conference on (pp. 3121-3128). IEEE.
Kazhdan, M ., Bolitho, M ., & Hoppe, H. (2006, June). Poisson surface reconstruction. In Proceedings of the fourth Eurographics symposium on Geometry processing.
Cuccuru, G., Gobbetti, E., M arton, F., Pajarola, R., & Pintus, R. (2009, M ay). Fast low-memory streaming M LS reconstruction of point-sampled surfaces. In Proceedings of Graphics Interface 2009 (pp. 15-22). Canadian Information Processing Society. Bernardini, F., M ittleman, J., Rushmeier, H., Silva, C., & Taubin, G. (1999). The ball-pivoting algorithm for surface reconstruction. Visualization and Computer Graphics, IEEE Transactions on, 5(4), 349-359.
Labatut, P., Pons, J. P., & Keriven, R. (2007, October). Efficient multi-view reconstruction of large-scale scenes using interest points, delaunay triangulation and graph cuts. In Computer Vision, 2007. ICCV 2007. IEEE 11th International Conference on (pp. 1-8). IEEE.
Labatut, P., Pons, J. P., & Keriven, R. (2009, December). Robust and efficient surface reconstruction from range data. In Computer Graphics Forum (Vol. 28, No. 8, pp. 2275-2290). Blackwell Publishing Ltd.
Boykov, Y., & Kolmogorov, V. (2004). An experimental comparison of min-cut/max-flow algorithms for energy minimization in vision. Pattern Analysis and M achine Intelligence, IEEE Transactions on, 26(9), 1124-1137.
Lafarge, F., Keriven, R., Brédif, M ., & Vu, H. H. (2013). A Hybrid M ultiview Stereo Algorithm for M odeling Urban Scenes. Pattern Analysis and M achine Intelligence, IEEE Transactions on, 35(1), 5-17.
Salman, N., Yvinec, M ., & M erigot, Q. (2010, July). Feature preserving mesh generation from 3d point clouds. In Computer graphics forum (Vol. 29, No. 5, pp. 1623-1632). Blackwell Publishing Ltd.
M cGuire, M . (2000). The half-edge data structure. Website: http://www. flipcode. com/articles/article halfedgepf. shtml. Zhou, K., Pan, Z. G., & Shi, J. Y. (1998). M esh simplificat ion algorithm based on triangle collapse. CHINESE JOURNAL OF COM PUTERS-CHINESE EDITION-, 21, 506-513.