SEGMENTATION OF 3D MODELS FOR CULTURAL HERITAGE STRUCTURAL
ANALYSIS – SOME CRITICAL ISSUES
S. Gonizzi Barsantia*, G. Guidia, L. De Lucab
a Department of Mechanical Engineering – Politecnico di Milano
b CNRS MAP, Modèles et simulations pour l’Architecture et le Patrimoine – Marseille (sara.gonizzi, gabriele.guidi)@polimi.it; [email protected]
KEY WORDS: 3D segmentation, 3D modelling, Structural Analysis, FEM, Conservation, Cultural Heritage
ABSTRACT:
Cultural Heritage documentation and preservation has become a fundamental concern in this historical period. 3D modelling offers a perfect aid to record ancient buildings and artefacts and can be used as a valid starting point for restoration, conservation and structural analysis, which can be performed by using Finite Element Methods (FEA). The models derived from reality-based techniques, made up of the exterior surfaces of the objects captured at high resolution, are - for this reason - made of millions of polygons. Such meshes are not directly usable in structural analysis packages and need to be properly pre-processed in order to be transformed in volumetric meshes suitable for FEA. In addition, dealing with ancient objects, a proper segmentation of 3D volumetric models is needed to analyse the behaviour of the structure with the most suitable level of detail for the different sections of the structure under analysis. Segmentation of 3D models is still an open issue, especially when dealing with ancient, complicated and geometrically complex objects that imply the presence of anomalies and gaps, due to environmental agents such as earthquakes, pollution, wind and rain, or human factors. The aims of this paper is to critically analyse some of the different methodologies and algorithms available to segment a 3D point cloud or a mesh, identifying difficulties and problems by showing examples on different structures.
1. INTRODUCTION
1.1 Overview
Application of technologies can help in preserving, conserving and restoring ancient structures, and is mandatory to find the best pipeline to produce the correct analysis. The use of Finite Elements Analysis (FEA) is largely used in modelling stress behaviour. The typical workflow involves CAD 3D models made by Non-Uniform Rational B-splines (NURBS) surfaces, representing the ideal shape of the object to be simulated. When applied to 3D models of Cultural Heritage (CH) objects or structures, often altered by the time passed since their original creation, the representation with a schematic CAD model may introduce an excessive level of approximation leading to wrong simulation results. 3D documentation of CH has been extensively improved through active sensors or passive approaches but the models are not suitable for being directly exploited in FEA. Different approaches have been followed in order to generate the volumetric mesh from the acquired 3D point cloud: a) redrawing with a CAD modeller a new model using the 3D mesh (Brune et al., 2012); b) using directly the triangular mesh generated by the 3D capturing pipeline (Castellazzi et al., 2015) c) generating a volumetric mesh directly from the point cloud (Shapiro et al., 2011; Bitelli et al., 2016). One of the solutions to use reality-based 3D models results in a strong simplification of the mesh associated to a topological rearrangement of it, obtained by using retopology that involves the creation of a new topology for a 3D model. The retopologized mesh is typically based on quadrangular element (quads) instead of triangles. The organization of the polygons in the retopologized models allows having a better distribution of the element, thus leading to strongly reduce the number of the final polygons of which the model is made up. The idea is that a more organized topology could be favourable for converting a polygonal mesh in a NURBS model, while maintaining a better coherence with the
digitized artefact. This can be useful when dealing with reality-based models of Cultural Heritage, which are usually accurate and precise but with a complex geometry.
The 3D models of buildings are assembled by different kind of elements with specific functions: decorative and structural. On the other hand, ancient buildings are often made of different materials depending on the different functions that each component has. In this case, retopology and decimation of the model are not enough to produce an accurate structural analysis. Indeed, each material has different Young’s modulus (the parameter for defining elasticity) and density, associated to its structural function. Consequently, a proper subdivision of the acquired mesh is preferable, in order to assign different levels of detail to structural elements that require a more or less accurate Finite Element Analysis. Furthermore, the major FEA packages has meshing modules that uses elementary volumes such as tetrahedron (first order, 4-nodes, not suitable for structural analysis and second order, 10-nodes) or hexahedron (8 or 20-nodes). Although the tetrahedral element is geometrically more versatile, it is generally recommended to use the hexahedral element. However, the latter produces elements that are geometrically less versatile and difficult to be used when dealing with complicated geometries. In this case, the best choice is to produce a mixed mesh after partitioning the model, so as to use the hexahedral elements in the parts of the model that are more affected by the structural analysis. Some studies have highlighted that hexahedral elements provide lower strain energy and therefore they seems to be more suitable for accurate analyses (Benzley et al, 1995).
For what concerns CAD models, segmentation is an easy task to be accomplished by means of the FEA software as these models are made of geometrically simple parts, which are drawn in a straightforward way. Segmenting a point cloud can produce a lack of coherence while meshing the single parts; therefore, in order to have a proper model for FEA it is necessary to segment it in its fundamental and structural parts. In order to do that it
would be sufficient to work on the mesh and then transform it into NURBS.
The starting point that should be considered is that Finite Elements Analysis requires a volumetric 3D model and all the parts of which it is made up have to be coherent between each other, without spaces or holes in between them. Hence, the most suitable type of reality-based output for consistently separate different sections belonging to the same 3D digitization seems to be the mesh model.
In computer vision, image segmentation is the process of partitioning a digital image into multiple segments. The goal of segmentation is to simplify the representation of an image into something that is more significant and easier to analyse. More precisely, image segmentation is the process of assigning a label to every pixel in an image such that pixels with the same label share certain characteristics. Each of the pixels in a region are similar with respect to some characteristic or computed property, such as colour, intensity.
Segmentation in Cultural Heritage is fundamental in order to: (i) overcome the remarkable complexity of reality-based models by selectively simplifying the most suitable level of each segment; (ii) maintaining the maximum level of detail only on the more detailed sections; (iii) separating load-sustaining elements apart from ornamental ones. In this paper, both point clouds and meshes segmentation are critically tested. For point clouds segmentation, the region-growing algorithm was evaluated. It groups points in clusters that are close enough in terms of the smoothness constraint. This algorithm works on the angles comparison between the point’s normals. On meshes two different approaches have been tested, based on: i) the use of planes for separating different mesh segments; ii) the identification of groups of polygons coherent with a pre-defined heuristic. Different software packages have been tested for the first (Innovmetrics Polyworks and CloudCompare) and the second (SimSelect) approaches. Although a rather large number of tests have been done, this paper presents an initial overview of segmentation on CH with the aim of identifying the most suitable ones for the final FEA purpose.
1.2 State of the art
Segmentation means to subdivide a group of data into homogeneous parts according to a predefined rule. It is common with images (Pal and Pal, 1993) and may be extended to 3D data sets and models. Such segmentation can be motivated by a semantic description of architectural elements referring to theoretical reflections (De Luca et al., 2007). Segmentation can be also used for automatically analysing urban scenes both on aerial 3D data (Liu et al., 2015) or architectural structures starting from terrestrial data (Boulaassal et al., 2007); for separating vegetation from DTM in aerial scenes (Reitberger et al., 2009) or identifying roads (Maboudi, et al., 2016). Such process can be applied by using either 3D clouds (Nguyen, Le, 2013; Oehler et al., 2011) or meshes and volumes (Chen, Georganas, 2006; Attene et al., 2006; Ho, Chuang, 2012).
For point cloud segmentation, an efficient tool is the Point Cloud Library (PLC - http://pointclouds.org/about/) that provides open sources algorithms and scripts to process 3D point cloud. The point cloud segmentation library contains algorithms for segmenting a point cloud into distinct clusters and there are tutorial for segmentation. The most used and effective are the Region growing segmentation, that works only on plane surfaces, and the Cylinder model segmentation that identifies both plane and curvilinear surfaces. The first is a parametric model-based range segmentation algorithms based on the assumption of a parametric surface model and on grouping data points so that all of them can be considered as points. The second filters data
points further away than a certain threshold, estimates surface normal at each point, segment and save a plane and a cylindrical model to disk. The cylindrical model is not perfect due to the presence of noise in the data that can be filtered out thank to the RANSAC algorithm. The RANSAC (Random Sample Consensus) is a randomized algorithm for robust model fitting and is used for 3D point shape extraction (Schnabel et al., 2007). The volume of data obtained from a typical 3D survey makes it unfeasible to process with the original algorithm as a single set, unless the algorithm is modified (Luchowski et al., 2013). Another tool is the suite CANUPO, an automatic classifier that handles multiple classes and that can be trained on small samples on a point cloud (http://nicolas.brodu.net/en/recherche/canupo/). This tool is now available as a plugin in the CloudCompare software but it was created for environmental 3D point cloud segmentation.
For 3D mesh segmentation, four algorithms are mainly used: the hierarchical face clustering, the super quadratic, the physics-based part approach and the watershed-physics-based algorithm. However, mesh segmentation is still an open issue while each author usually develops his/her own process starting from a given tools. Some researches on segmentation of Cultural Heritage have been performed (Bornaz et al., 2003; Spina et al., 2011; Lerma, Biosca, 2005), and they are mainly focused on both 3D point cloud and models. For CH model segmentation, the manual process requires a huge effort by the operator, especially when dealing with complicated models dense with pieces of information. Automatic segmentation is still not reliable when coping with complex structures and almost impossible when it comes to statues.
1.3 Case studies
To test different strategies for 3D segmentation for Cultural Heritage monuments and artefacts, seven different case studies have been chosen. The selection was made with the aim of using and analysing objects of different period and dissimilar in shape, geometry and size.
The first is a Cambodian small temple (prasat) made of bricks, laterite and sandstone (Figure 1a), which was found in the Pre Rup Temple in Angkor, an Hindu temple built as the state temple of Khmer king Rajendravarman and dedicated in 961 or early 962 AD. The second object is a portal of the Banteay Srei or Banteay Srey, a 10th-century temple dedicated to the Hindu god Shiva and located in the area of Angkor, Cambodia (Figure 1b). It lies 25 km northeast of the main group of temples that once belonged to the medieval capitals of Yasodharapura and Angkor Thom. It was consecrated in 967 A.D., the only major temple at Angkor which did not was built by a monarch. Banteay Srei is largely built of red sandstone, with elaborate decorative wall carvings. The buildings themselves are miniature in scale.
a b
Figure 1. Angkor artifacts: a) the Prasat in the Pre Rup Temple; b) the portal of the Banteay Srey.
The third object tested is the church in Saint Emillion, a medieval UNESCO village located 40 km northeast of Bordeaux in South-West France. The Collegiate church in Saint Emillion (Figure 2) is a Romanesque building built at the beginning of the twelfth century until the sixteenth century. It was classified as Historic Monument in the list of 1840. A XIV century Gothic portal on the left flank of the church provides another entrance from Place Pioceau.
Figure 2. The portal of the Collegiate church in Saint Emilion.
The fourth building is the Château d’If (Figure 3) that stands on the Frioul islands in the gulf of Marseille. It is a French fortification built between 1527 and 1529 AC with the function of prison. The first prisoners entered in November 1540 and were two Marseilles anglers, while the last ones were some prisoners of the civil war (1914 in Alsace and Lorraine). Two characters of the novel “The Count of Monte Cristo” by Alexandre Dumas and one of the novel “Viscount de Bragelonne” were placed inside this prison, respectively Edmond Dantes and the Abbe Faria and the so-called Iron Mask.
Figure 3. The Château d’If – Marseille
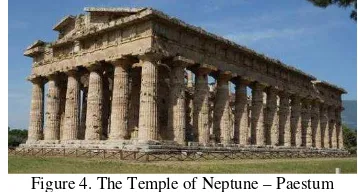
The fifth building is the temple of Neptune (Figure 4), erected in the polis of Poseidon (known by its Roman name of Paestum) in the mid-fifth century BC. The temple (24,14 x 59,98 m) is Doric, with six columns on both sides and with a peristyle of 6x14 columns. The cell is divided into three naves by two rows of seven Doric columns.
Figure 4. The Temple of Neptune – Paestum
The sixth tested object is the polygonal tower (Figure 5a) of the late roman circus of the city of Milan. It is 16.60m high and is composed by 24 sides. It was probably part of a rectangular fortified outpost, north of the carceres of the Circus, used as a guard of the imperial district.
The last object analysed is a small marble copy of the famous statue of David of Donatello, 290.5 mm high (Figure 5b). This object was chosen because in the future the authors aim at providing laboratory tests to compare the results with the FEA, by using the same parameters as in the physical test. The original bronze statue, probably made for the courtyard of Palazzo Medici, has very controversial dating.
a b
Figure 5. Models acquired in Milan: a) the polygonal tower of the late roman circus; b) reproduction of the David by Donatello
The most common one is around the forties of the fifteenth century, when the great sculptor worked for Cosimo de 'Medici. The bronze statue is 158 cm high and is preserved in the National Museum of the Bargello in Florence.
2. ACQUISITION AND PROCESSING
2.1 Photogrammetry
The Cambodian structures, the Château d’If, the collegiate church of Saint Emilion and the Temple of Neptune were all surveyed throughout photogrammetry using different cameras and settings. Table 1 summarizes the cameras and the parameters used to survey the six different tested objects.
Camera Lens
(mm) F ISO Dim. Img
Pre Rup Temple
Sony
NEX 7 35 11 800 4000x6000
Banteay Srey
Sony
NEX 7 30 11 400 4000x6000
Saint Emilion
IPhone
6S plus 4 2.2 25 3024x4032
Château d’If
Nikon
D3X 20 14 100 5056x4032
Neptune close-range
Nikon
D3X 14 8 400 6048x4032
Neptune UAV
Canon
550D 25 11 1600 5184x3456
Tower Canon
5D 20 11 800 5616x3744
Table 1. Cameras and parameters of the six different surveys.
The UAV used for the survey of the Neptune Temple was an Esafly E2500 quadcopter with a high resistance carbon steel body. The UAV is 100 cm width and 30 cm height, has a maximum payload of 2.5 kg and the autonomy varies from 12 to 20 minutes depending on the weight of batteries and the payload.
2.2 Structured light device
The copy of the David was surveyed with a Solutionix Rexcan CS which characteristics are summarized in Table 2. The blue-light sensor for the pattern projection is suitable for scanning small and medium not totally Lambertian objects and it is considered as the most precise type of sensor for 3D digitization.
Element Description
Camera resolution 2.0 Mega pixel Distance among points 0.035 ~ 0.2 mm
Working distance 570 mm
Unit mm
Table 2. Specification of the structured light device.
The 3D digitization of the objects was carried out by placing the scanner head on a base connected to a rotating plate (TA-300) composed of two axes, one for rotation that allows a movement of ± 180 ° and one for the oscillation that achieves up to 45° of scan. Given the size of the object, it was decided to use the 12mm calibrated lens, with the following specifics: FOV (diagonal) 85mm, distance among points 0.044mm and estimated uncertainty 0.010-0.015mm. The oscillation was set to ± 30° and ± 150° rotations for a total of 36 scans for each position of the object on the turntable. The final uncertainty after the alignment of the separate point clouds was 0.022 mm.
3. SEGMENTATION FOR FEA: TESTS AND COMPARISON
3.1 Region-growing on 3D point clouds
In image segmentation, the region growing is a bottom-up procedure that starts with a set of seed pixels. The aim is to develop a uniform, connected region from each seed. The procedure starts with the partitioning of an image into initial seed region and then with the fitting of a planar model to each seed region. For each region, the algorithm finds all the pixels that are compatible with the initial region by considering the neighbour pixels. Once the process does not find any other pixel with the same characteristics, which can be added to the first region, it starts creating another one with different parameters. The process continues in loop until all the pixels have been collected in the different regions. The process does not take into account the pixels that cannot be identified as a part of the region created. The algorithm for 3D point cloud segmentation works on different parameters that have to be set in order to achieve the best segmentation results. These parameters are Max Cluster Size (meaning the maximum number of points that a cluster needs to contain in order to be considered valid) and number of neighbours (meaning the neighbouring points to be added to one region if they are similar to the seed). The results suggest that the parts of the point cloud coloured in red are the ones, which are not segmented.
The algorithm was tested on the point clouds of the two Cambodian structures, on the S. Emilion portal, on the Château d’If and on the Neptune Temple. After several tests, it was noticed that the algorithm works quite well on structures that are plane and well-defined, while has great difficulties in identifying shapes with complex geometries of curves as most archaeological remains. The best results have been obtained by using it with the S. Emilion portal and the Prasat in the Pre Rup Temple (Figure 6 a-b). Since these two tested objects have well-defined geometries, it was possible to highlight the different surfaces, by playing with the value of the parameters. For what concerns the church, several tests were performed varying the Maximum cluster size to 2k, 10k and 10M and the number of neighbour on
from 5 to 10. The best result was obtained by setting a number of max cluster size of 1M and the number of neighbour on 5. As regards the small temple, since the structure is much more geometrically simple, two tests were performed: one setting the max cluster number on 100 and one on 10k. The best result was obtained with the max cluster number set on 10k.
a
b
Figure 6. The region-growing algorithm applied to the S. Emilion portal (a) and to the Prasat in Angkor (b)
The portal of the Banteay Srey includes too many details and decoration, and changing, progressively, the maximum cluster number between 5 and 10k or the number of neighbour did not affect the results, which are anyway not satisfying for a proper segmentation of the point cloud (Figure 7 a-b). This is evident by the large number of red points highlighted after the processing. The result was probably affected by the decorations of the portal and because the structure is a false door with various micro carvings on its surface affecting the planarity of its surfaces. This is probably the reason why the results were not as good as in the portal of the Saint Emillion church, in which, even if the decorations are abundant, the planar surfaces are better defined.
a b
Figure 7. The region growing of the Cambodian portal: Max cluster number 5 (a) and 10k (b).
When considering bigger structures, it is possible to state that the algorithm presents a main limitation: it cannot deal with 3D objects made up of a massive number of points. For this reason, the Château d’If and the Neptune Temple models were cut in
order to launch the segmentation only on a portion of the structure instead of the entire point cloud. Even so, the computational time was huge (near to an hour instead of few minutes needed in other cases). In addition, the algorithm cannot detect circular structures, becoming inadequate for archaeological segmentation. All the different results for the Château d’If (Figure 8a) results to be useless, because the algorithm was able to detect only the part of the façade, and not in its entirety. For the Neptune Temple, the segmentation method was capable to identify each single element of the basement, the metopes, the fronton and the parts in which the capitals are subdivided. On the contrary, for the columns, the algorithm detected each planar part present on the flute but not the entire circular shape of the architectural element (Figure 8b).
a
b Figure 8. The segmentation of a) the Château d’If point cloud
with max cluster num. 100; b) Temple of Neptune with max cluster num. 100k.
Several tests were then run one the point cloud of the Tower, in order to analyse the presence of cracks or relevant gaps. This structure seemed to be appropriate because it is composed by 24 sides and is connected to the remains of the walls. The results were not satisfying: the algorithm detected the tower and the wall as a unique part and then segmented all the small parts composing the windows and the protrusions. Changing the aforementioned parameters the result was not affected (Figure 9). The explanation can be due to the smooth changing of the surface normal orientations of the twenty-four sides that compose the structure.
a
Figure 9. Region growing algorithm applied on the point cloud of the tower
To better identify the logical procedures of the region growing algorithm, some tests have been performed on a simple box
model drawn with a CAD software. Several 3D point clouds have been generated by sampling the box surface with a 20 micrometres sampling step. As a result, the 3D cloud is 137k points. The specific implementation of the algorithm that was used is based on the coherence of point normals in the segmented region, as demonstrated by the following test. It was run on different point clouds where it was simulated, separately, a progressive increase of the uncertainty of each 3D point position and normal orientation. A positional uncertainty of 10 mm and 10 cm respectively was applied, and a random orientation tilt on the normals of 0%, 10%, 20% with respect to the original orientation, simulating in this way what happens in a real 3D scan.
The results reported in Figure 10 show that the algorithm actually considers only the information provided by the normal orientation. Although a 10 times difference in the standard deviation of positional error between the two analysed cases, Figure 10 a and b show the same segmentation uncertainty thanks to a precise orientation of normals.
a b
c d
e f
Figure 10. Region growing segmentation on a box point cloud with different conditions of uncertainty on point positions and normal orientations: a) noise of 10cm on points an 0% on normal; b) 10mm, 0%; c) 10cm, 10%; d) 10mm, 10%; e) 10cm,
20%; f) 10mm, 20%
In the second example showed by Figure 10 c and d, the uncertainty on the normal orientation is randomized with the addition of a Gaussian distributed noise, whose amplitude is 10% of the normal vector amplitude. In these conditions, it is possible to notice the presence of spots of unidentified points, which do not belong to any cluster. It seems that such loss of identification
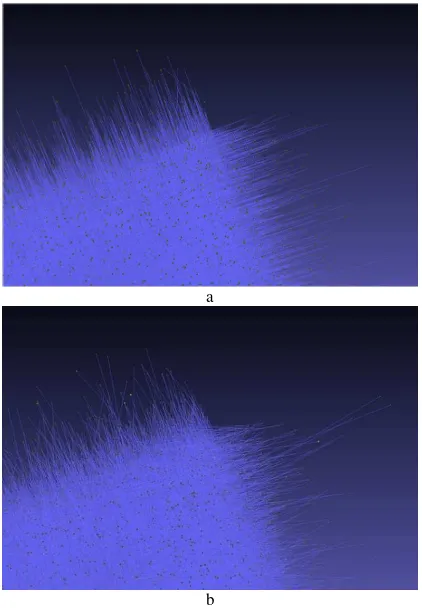
occurs for both the simulations, providing similar results despite the large difference in positional uncertainty. Finally (Figure 10 e and f), a larger randomization of the normals corresponding to 20% of the normal amplitude and shown visually in Figure 11 b, leads the algorithm to completely fail in grouping the data in homogeneous clusters. In addition, in this case, the positional uncertainty does not affect the result, which seems completely determined by the normal orientation.
a
b
Figure 11. Simulated normal noise on the box 3D data: a) no noise; b) Gaussian random noise of 20% of the original
orientation
3.2 Mesh segmentation
Considering the goal of the segmentation, meaning the creation of models subdivided in homogeneous parts related to the main architectural element, it was decided to segment directly the meshes. Three common post-processing mesh software items, one commercial and two open-source (Polyworks from Innovmetric, CloudCompare and SimSelect) were tested. The latter is a barely new software that allows to interactively selecting specific elements on 3D surfaces. It classifies selections into three different types: connected components, parts and patches (Guy et al., 2014).
The first set of tests were made on the model of the Temple of Neptune and the second on two simplified meshes of the little David sculpture.
On both meshes two different decimations were applied, one with a standard sequential optimization process that guides the removal of points from the triangulation leading to a gradual increase of its overall approximation error (Soucy and Laurendeau, 1995) and another one applying retopology (Gonizzi Barsanti, Guidi, 2017).
The first software that was tested is CloudCompare. For what concerns the Temple, it was decided to use only a portion of the
model, to minimize the calculation time. The software is provided with its own tool for segmenting the model, constructing a section that the user manually places at the proper height where the model has to be cut. Using this section, the software creates a partition of the model that is included in the working bounding box. To have the second part of the model properly segmented, to avoid gaps, the software allows to use the same section and to move the bounding box to select the second part. The problem with this software is that it leaves the two cut parts open and, therefore, the mesh has to be closed differently (Figure 12). Therefore, the possibility to have discontinuities increases. An option is to import the two parts of the model into another software and find a way to close them by using the same flap surface, as a plane, but the result is not perfect due to the jagged profiles of the cut.
Figure 12. The segmentation through a section in CloudCompare.
Innovmetric Polyworks was also tested to segment the models by using a plane. Such tool allows having the two sections closed by the same plane and that assures absence of discontinuities. The process was applied both on the models of the temple and the statue. For segmenting the model of the Temple in all its architecturally relevant parts, several planes were positioned in order to cut the parts that had to be segmented. Each semantic component was segmented through a dedicated plane (Figure 13). However, a better segmentation should consider all the constituent elements of the structure as the drums of the columns or the single blocks of the architrave, considering their connection. In this way, it will be possible to obtain a more precise analysis of the statics and the structural behaviour of the building.
Figure 13. Segmentation with planes in Polyworks of the model of the Temple.
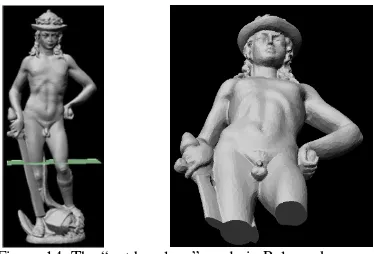
Differently from the previous case, for the model of the statue only one plane was needed. The procedure gave a perfect result: the same plane, avoiding any hole in the mesh, closed both the parts. (Figure 14). The FEA on statues can be important for detecting weak parts, physical stresses of the stone, so as to enable practitioners to detect the most suitable and effective methods for restoration or to investigate its behaviour during earthquakes (Podany 2006; Casciati, Borja, 2004).
Figure 14. The “cut by plane” mode in Polyworks
The last software to be tested was SimSelect, an open source software that allows interactive selection on 3D models. As a test object it was used the Neptune Temple for its complexity. The software works on the manual selection of a specific part on the model and then the automatic selection of similar shape can be launched. The SimSelect system takes as an input a two-manifold triangle meshes (i.e. a list of polygons indexed over a list of vertices) which can have multiple components and boundaries. It provides the user with an interactive selection process, composed of two main stages: the interactive construction of a reference selection and its expansion to similar ones (Guy et al., 2014, pp.2-3). However, in the software tutorials, only CAD models were used as examples. With reality-based models, the same smooth behaviour did not occur, thus generating unexpected selections that needed a significant manual work in order to be adjusted. The model of the Temple, even if decimated, was too big for the software to be handled, so the test was run on a model portion only. The results showed a wrong detection of the shape, even with the lower value of “expansion”, a parameter used to select similar geometry. Putting this value on one, the lowest rate, the software selected also a part of the epistyle of the temple (Figure 15a). By increasing the value, the results were worst (the algorithm selected also the pillars in the back and a bigger part of the epistyle) even if the number of columns selected is higher (Figure 15b).
a
b Figure 15. The differences in automatic selection with SimSelect: with expansion 1 (a) and with expansion 6 (b). The columns highlighted in dark red are the ones selected manually
to give the shape for the automatic selection.
This software works fine on CAD models with well-defined parts but not with 3D reality-based meshes. One can redefine and clean the automatic selection but then the export of the segmentation is done only with a proprietary format (extension *.seg) and can be
opened only with SimSelect. This difficulty makes the software useless for the goal of the segmentation on reality-based models.
4. CONCLUSIONS, OPEN ISSUES AND FUTURE DEVELOPMENTS
Research on segmentation of 3D meshes of CH is still an open topic. Some good algorithms for automatic cluster selection have been released but they work on 3D point clouds taking into account the point normal orientation as a reference parameter. Those can be useful in CH documentation as far as such normals are clearly oriented and not affected by erratic variations, which make the clustering fail. This behaviour is exhibited by the experimental tests and clearly confirmed by the simulated tests. However, even if such clustering might be rather precise, working on point clouds does not seem to be the most suitable approach for creating a 3D segmentation for structural simulation purposes. As a matter of facts, generating independent meshes from differed groups of data does not guarantee a coherence among all the structural parts. In addition, although these algorithms are useful, they indeed need a further development when dealing with extremely complex structures, very dense point clouds, and noise on the normal orientation.
On the other hand, the segmentation applied directly on meshes still does not give appropriate results if using a completely automatic approach. The only process that produced some good outcomes was the manual one, slicing the model with a plane. The process itself does not last too long but it is mandatory to do a proper and accurate post processing in order to have the separate parts clean of any topological errors maintaining the surfaces between them coherent and clean. The specifics, pro and cons of each algorithm and software tested are summarized in Table 3. The outline of all the algorithms and software tested.
The future developments of the research will investigate other algorithms and software items, considering also the ones that simultaneously take into account both the geometry and the colour of the elements to be segmented, in order to make more robust the entire clustering process,
In addition, another way of making a segmentation to be explored involves a direct processing of the NURBS and volumetric models that might be more suitable for obtaining a better-defined segmentation for structural analysis of CH. An automatic process
does not seem suitable to be applicable to complex structures, since it has to identify in an accurate way the main structural elements of the building and not only the geometrical ones.
ACKNOWLEDGEMENTS
The authors want to thank Dr Anthony Pamart from CNRS MAP – Marseille for permitting the use of his 3D point clouds of the Cambodian buildings and Dr Adeline Manuel from the same Laboratory for her help in understanding the segmentation algorithms. For the mesh of the Neptune temple in Paestum, thanks are essential to the researchers of the 3DOM unit of FBK who processed all the images and gave the result to the authors, and to the Superintendence of Paestum for allowing to use its material. The authors wish also to acknowledge the support of the European Union Joint Programming Initiative on Cultural Heritage (JPICH), for funding the research in the framework of the project Cultural Heritage Through Time (CHT2).
REFERENCES
Attene, M., Katz, S., Mortara, M., Patane, G., Spagnuolo, M., Tal, A. 2006 Mesh segmentation – A comparative study, IEEE International Conference on Shape Modeling and Applications. doi: 10.1109/SMI.2006.24
Benzley, S. E., Perry, E., Merkley, K., Clarck, B.: A Comparison of All Hexagonal and All Tetrahedral Finite Element Meshes for Elastic and Elasto-plastic Analysis, Proceedings of 4th International Meshing Roundtable, Sandia National Laboratories, pp. 179-191, 1995
Bitelli, G., Castellazzi, G., D’Altri, A. M., De Miranda, S., Lambertini, A., and Selvaggi, I.: Automated Voxel Model from Point Clouds for Structural Analysis of Cultural Heritage, Int. Arch. Photogramm. Remote Sens. Spatial Inf. Sci., XLI-B5, 191-197. doi:10.5194/isprs-archives-XLI-B5-191-2016, 2016. Bornaz, L., Rinaudo, F., Roggero, M. 2003. Object segmentation in Cultural Heritage, XIX CIPA Intern. Symposium, Antalya, vol. XXXIV-5, pp. 490-495. ISBN 975-561-245-9.
Boulaassal, H., landes, T., Grussenmeyer, P., Tarsha-Kurdi, F., 2007. Automatic segmentation of building facades using terrestrial laser data. IAPRS Volume XXXVI, Part 3 / W52, ISPRS Workshop on Laser Scanning 2007 and SilviLaser 2007, Espoo, Finland, pp. 65-70. doi: 10.1007/978-3-540-72135-2_9 Brune, P., Perucchio, R., 2012. Roman Concrete Vaulting in the Great Hall of Trajan’s Markets: A Structural Evaluation. J. Archit. Eng. 18, 332–340. doi:10.1061/(ASCE)AE.1943-5568.0000086
Casciati, S., Borja R.I.: Dynamic FE analysis of South Memnon Colossus including 3D soil-foundation-structure interaction, Computer and Structures 82 (2004), Elsevier, pp. 1719-1736,
De Luca, L., 3D modelling and Semantic Enrichment in Cultural Heritage. 2007. Invited speaker at 54th Photogrammetric Week in Stuttgart. September 9-13, 2013 pp. 323-333.
Gonizzi Barsanti, S. and Guidi, G.: A Geometric Processing Workflow for Transforming Reality-Based 3D Models in
Volumetric Meshes Suitable for FEA, Int. Arch. Photogramm. Remote Sens. Spatial Inf. Sci., XLII-2/W3, 331-338, doi:10.5194/isprs-archives-XLII-2-W3-331-2017, 2017. Guy, E., Thiery, J.M., Boubekeur, T. 2014. SimSelect: Similarity-based selection for 3D surfaces. EUROGRAPHICS vol. 33, Issue 2, pp. 165-173. doi: 10.1109/3DIM.2005.71 Ho, T.C., Chuang, J.H. 2012. Volume Based Mesh Segmentation. Journal of Information Science and Engineering 28, pp. 705-722.
ISSN 1896–5334 Vol. 25 (2013), no. 2. Pp. 105-117.
J. Reitberger, Cl. Schnörr, P. Krzystek, U. Stilla, 3D segmentation of single trees exploiting full waveform LIDAR data, ISPRS Journal of Photogrammetry and Remote Sensing, Volume 64, Issue 6, November 2009, Pages 561-574, ISSN 0924-2716, http://dx.doi.org/10.1016/j.isprsjprs.2009.04.002. Lerma, J.L., Biosca, J.M. 2005. Segmentation and filtering of laser scanner data for Cultural Heritage. CIPA XX International Symposium, 26 September – 01 October, 2005, Torino, Italy. Liu, J., Wang, J., Fang, T., Tai, C-L., Quan, L., 2015. Higher-order CRF Structural Segmentation of 3D Reconstructed Surfaces, Computer Vision (ICCV), IEEE International Conference, pp. 2093-2101, doi: 10.1109/ICCV.2015.242 Luchowski, L., Kowalski, P., 2013. Using RANSAC for 3D point cloud segmentation. Theoretical and Applied Informatics Maboudi, M., Amini, J., Hahn, M., Objects grouping for segmentation of roads network in high resolution images of urban areas (2016) International Archives of the Photogrammetry, Remote Sensing and Spatial Information Sciences - ISPRS Archives, 41, pp. 897-902.
Nguyen, A., Le, B. 2013. 3D point cloud segmentation: a survey. 6th IEEE Conference on Robotics, Automation and Mechatronics (RAM) pp. 225-230.
Oehler, B., Stueckler, J., Welle, J., Schulz, D., Behnke, S. 2011. Efficient Multi-Resolution Plane Segmentation of 3D Point Clouds. Jeschke S., Liu H., Schilberg D. (eds) Intelligent Robotics and Applications. ICIRA 2011. Lecture Notes in Computer Science, vol. 7102. Springer, pp
.
145-156Oreni, D., Brumana, R., Della Torre, S., Banfi, F., Barazzetti, L., Previtali, M., 2014. Survey turned into HBIM: the restoration and the work involved concerning the Basilica di Collemaggio after the earthquake (L’Aquila). ISPRS Ann. Photogramm. Remote Sens. Spat. Inf. Sci. II-5, 267–273. doi:10.5194/isprsannals-II-5-267-2014
Podany, J.: Advances in the Protection of Museum Collection from Earthquake Damage, Papers from a Symposium held at the J. Paul Getty Museum at the Villa, May 3-4, 2006
Schnabel, R., Wahl, R., Klein, R., 2007. Efficient RANSAC for Point-Cloud Shape Detection. Computer Graphics Forum, Volume 26, Issue 2, pp. 2014-226.
Shapiro, V., Tsukanov, I., Grishin, A., 2011. Geometric Issues in Computer Aided Design/Computer Aided Engineering Integration. J. Comput. Inf. Sci. Eng. 11, 21005. doi:10.1115/1.3593416
Soucy, M., Laurendeau, D., 1995. A General Surface Approach to the Integration of a Set of Range Views. IEEE Trans. Pattern Anal. Mach. Intell. 17, 344–358. doi:10.1109/34.385982 Spina, S., Debattista, K., Bugeja, K., Chalmers, A., Point Cloud Segmentation for Cultural Heritage Sites. 2011. VAST11: The 12th International Symposium on Virtual Reality, Archaeology and Intelligent Cultural Heritage M. Dellepiane, F. Niccolucci, S. Pena Serna, H. Rushmeier, and L. Van Gool (Editors), pp. 41-48. doi: 10.2312/VAST/VAST11/041-048