AUTOMATIC MOVING VEHICLE’S INFORMATION EXTRACTION FROM ONE-PASS
WORLDVIEW-2 SATELLITE IMAGERY
Rakesh Kumar Mishra
Department of Geodesy and Geomatics Engineering, University of New Brunswick, NB, CANADA [email protected]
Commission VII, WG VII/5
KEY WORDS: Satellite images, WorldView-2, vehicles detection, vehicle information, traffic, AdaBoost.
ABSTRACT:
There are several applications of vehicle information (position, speed, and direction). WorldView-2 satellite has three sensors: one Pan and two MS (MS-1: BGRN1, Pan, and MS-2:CYREN2). Because of a slight time gap in acquiring images from these sensors, the WorldView-2 images capture three different positions of the moving vehicles. This paper proposes a new technique to extract the vehicle information automatically by utilizing the small time gap in WorldView-2 sensors. A PCA-based technique has been developed to automatically detect moving vehicles from MS-1 and MS-2 images. The detected vehicles are used to limit the search space of the adaptive boosting (AdaBoost) algorithm in accurately determining the positions of vehicles in the images. Then, RPC sensor model of WorldView-2 has been used to determine vehicles’ ground positions from their image positions to calculate speed and direction. The technique has been tested on a Worldview-2 image. A vehicle detection rate of over 95% has been achieved. The results of vehicles’ speed calculations are reliable. This technique makes it feasible to use satellite images for traffic applications on an operational basis.
1. INTRODUCTION
The increasing volume of already-high traffic loads creates new challenges for traffic management and planning. Moving vehicle information (position, speed, and direction) is crucial for traffic planning, security surveillance, and military applications. Today’s road systems are equipped with a suite of sensors for monitoring traffic status, such as induction loops, overhead radar sensors and video sensors. While they all deliver reliable measurements, the results are merely point-based in nature. On the other hand, information provided by remote sensing techniques covers a larger area and thus could often be useful for better understanding the dynamics of the traffic. The launch of high resolution satellites such as QuickBird and WorldView-2 has made it feasible to use satellite images for traffic applications. These satellites capture images with a spatial resolution better than 1-m and hence can be used to extract road traffic information. Furthermore, the high resolution satellite images give a synoptic view of complex traffic situations and the associated context.
In the past, several efforts (Gerhardinger et al., 2005; Sharma et al., 2006; Jin and Davis, 2007; Zheng et al., 2006; Zheng and Li, 2007) have been made to detect vehicles from HR satellite imagery. A few attempts (Xiong and Zhang, 2008; Leitloff and Hinz, 2010; Liu et al., 2010) have been made to determine vehicle speeds using QuickBird imagery. These methods utilize the small time interval between the acquisition of Pan and MS images by QuickBird sensors. Xiong and Zhang (2008) developed a methodology to determine vehicle’s ground position, speed and direction using QuickBird Pan and MS images. However, the major limitation of the Xiong and Zhang (2008) approach is that in this method there is a need to select vehicles’ central positions manually from Pan and MS images. Leitloff and Hinz (2010) have used adaptive boosting (AdaBoost) classification technique to detect single vehicles from Pan images and then the corresponding vehicles from MS images have been detected using the similarity matching approach. Whereas, Liu et al. (2010) have used an object-based
method to detect single vehicles from Pan images and then the corresponding vehicles from MS images have been detected using the area correlation method. Both aforementioned approaches have achieved a fair level of accuracy in vehicle detection from Pan images. However, accuracy of vehicle detection from MS images is quite low which leads to high error in determining vehicles’ position is MS images. As the time interval between the acquisition of Pan and MS images is very short, a very small error in vehicles’ position determination will lead to a very high error in vehicles’ speed computation.
The recently-launched high resolution satellite, WorldView-2, has three sensors: one Pan and two MS (MS-1: BGRN1, Pan, and MS-2:CYREN2). Because of a slight time gap in acquiring images from these sensors, the WorldView-2 images capture three different positions of the moving objects (vehicles) and static objects remain at the same position. Therefore, theoretically it is possible to detect moving vehicles from the WorldView-2 imagery. Practically, these calculations bring many challenges in the image processing domain. The spatial resolution of the MS image is low (2m) which makes vehicle extraction a difficult task. Furthermore, MS-1 and MS-2 images constitute different spectral wavelengths; therefore the existing change detection methods are incapable of detecting moving vehicles from the images. In addition, the accurate determination of ground positions of a moving vehicle available in each image is important for accurate speed computation.
This paper proposes a completely different and new methodology to automatically and accurately extract moving vehicle`s information (position, speed and direction) from MS-1 and MS-2 images captured by the WorldView-2 satellite in one pass. A motion detection algorithm has been developed which looks into MS-1 and MS-2 images and detects the objects which are in motion. The novelty of this algorithm is that it is completely automatic and there is no need for road extraction prior to vehicle detection. In earlier vehicle detection methods, prior to the vehicle detection, there is a need to extract roads either manually or from GIS data. A vehicle detection rate of
over 95% has been achieved with a high reliability. The positions of detected moving vehicles have been inputted to the AdaBoost machine learning algorithm to further improve the accuracy of vehicles’ image positions. This is because the vehicles’ speed calculation is highly dependent on the accuracy of vehicles’ image position. Then, ground positions of each detected vehicle from MS-1 and MS-2 images have been computed using sensor model (RPC) provided by WorldView-2 satellite.
This paper begins by discussing the methodology developed to detect moving vehicles. Then, methodology to compute vehicles’ information is discussed. Finally, results and conclusions are presented.
2. METHODOLOGY
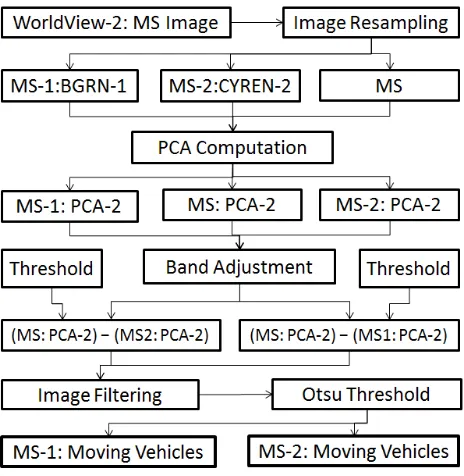
In this paper, a Principal Component Analysis (PCA) based method has been developed to detect moving vehicles from Worldview-2 MS-1 and MS-2 images. The workflow of the methodology developed is shown in Figure 1. Then, AdaBoost learning algorithm based method has been developed to compute vehicles’ information. The work flow of vehicles’ information computation is shown in Figure 5.
2.1 Study Area and Data used
WorldView-2 imagery of a part of Moncton, a city in New Brunswick, Canada, has been used for this study. This WorldView-2 image was provided by DigitalGlobe® Inc. to Bahram Salehi (University of New Brunswick) through “The DigitalGlobe 8-Band Research Challenge” contest. The image was taken on October 5, 2010. The WorldView-2 imagery includes Pan image MS-1 (BGRN1) image, and MS-2 (CYREN2) image. The MS-1 and MS-2 bands are stacked together as one MS image with 8-bands.
2.2 Image Resampling
WorldView-2 MS images have spatial resolution of 2m; therefore, small objects like vehicles are not clearly identifiable. To make vehicles more identifiable, the MS image has been re-sampled to 0.5m using cubic convolution resampling method.
2.3 PCA Computation
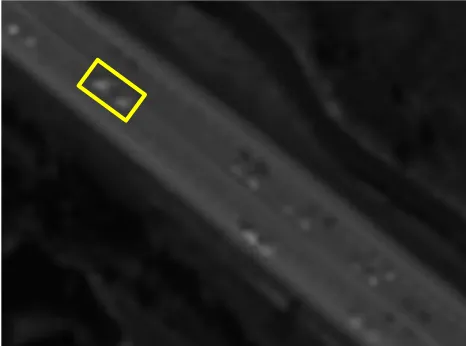
MS-1 and MS-2 images constitute different spectral wavelengths; therefore change detection methods are incapable of detecting moving vehicles. In this paper, principal components of MS-1 and MS-2 images have been computed. As shown in Figure-2 and Figure-3, vehicles are more distinguishable in the second principal component. Therefore, second principal components of MS-1 image (MS-1: PCA2) and MS-2 images (MS-2: PCA2) have been selected for further processing. Also, the principal component of MS image, which has 8 bands stacked together, has been computed. As shown in Figure-4, the vehicles are again more distinguishable in the second principal component (MS: PCA2). Furthermore, as shown in Figure-4, the second principal component has two positions of one moving vehicle. This result is very useful for detecting moving vehicles from the MS-1 and MS-2 images. Finally, after PCA computations three images, MS-1: PCA2, MS-2: PCA2, MS: PCA2, have been selected for further processing.
Figure 1: Workflow for vehicle detection
2.4 Band Adjustment
The histograms of MS-1:PCA2, MS-2:PCA2 and MS: PCA2 images have been adjusted to a common mean and standard deviation. This process has improved the accuracy of moving vehicle detection.
2.5 Moving Vehicle Detection
After the Band Adjustment, a change detection process has been applied to the images to detect moving vehicles. Change detection is an important process in remote sensing applications (Copping et al., 2004; Tronin, 2006). In the change detection process, two images of the same scene captured at different time instances are used to detect changes. Therefore, change detection can be expressed as:
��1 =� ∗ ��2 +� (1)
Where It1 and It2 are the images captured at time t1 and t2 and ɑ and b are the constant scalar values. The aim of change detection process is to model the constants ɑ and b. A variety of change detection algorithms are available; however, in this study, it has been found that the differencing method for change detection is efficient and best suited for detecting vehicles from WorldView-2 MS imagery. As shown in Figure-2 and Figure-3, the MS-1:PCA2 and MS-2:PCA2 images have different positions of a moving vehicle whereas MS: PCA2 image (Figure-4) has two different positions of the same moving vehicle. Thus, moving vehicles from the MS-1 image have been detected using equation (2) and moving vehicles from the MS-2 image have been detected using equation (3).
(MS-1 Image)Moving vehicles═ (MS: PCA2) − (MS2: PCA2)-T1 (2)
(MS-2 Image)Moving vehicles═ (MS: PCA2) − (MS1: PCA2)-T2 (3) Where parameters T1 and T2 are the thresholds which are used to eliminate outliers appears after differencing process.
The above process results in two images; first image contains moving vehicles of the MS-1 image and second image contains moving vehicles of the MS-2 image.
Figure 2: Second principal component of MS-1 image (MS-1: PCA2)
Figure 3: Second principal component of MS-2 image (MS-2: PCA2)
Figure 4: Second principal component of MS image (MS: PCA2). In this figure, two positions of the same vehicle are available.
2.6 Post-Processing
Although thresholds used in equations 2 and 3 significantly reduced the outliers, still there are false alarms (structures other than the vehicles) present in the resulting images. To eliminate the false alarms, clean filter, majority filter, hole filling filters, and opening/closing morphological operators discussed in Sharma et al.(2006) have been used. In the above filters, (1) Clean filter removes the one pixel size structure surrounded by 0s. (2) Majority filter sets a pixel to 1, if five or more pixels in a 3×3 neighbourhood are 1s; otherwise, it sets to the pixel to 0. (3) Hole filling filter fills isolated pixels, such as centre pixels. (4) Opening/closing morphological operation removes one or two pixel wide interconnections between two pixel groups. After filtering operations, Otsu threshold method (Otsu, 1979) has been used to convert gray level image into binary (black and white) image. An algorithm has been developed to count vehicles from the generated binary images. The final result of moving vehicle detection is shown in Figure 5 and 6. Figure 5 shows the moving vehicles detected from the MS-1 image and Figure 6 shows the moving vehicles detected from the MS-2 image.
Figure 5: Result of vehicles detected from MS-1 image
Figure 6: Result of vehicles detected from MS-2 image
2.7 Results of vehicle detection
The experiment results are based on WorldView-2 imagery of a part of Moncton, a city in New Brunswick, Canada. A very small part of the results have been shown in the figures due to space limitation. The whole image was taken as input to the
vehicle detection process. The process resulted in two black and white images containing moving vehicles of the 1 and MS-2 images. The vehicle detection results from the MS-1 image are compared with manually counted vehicles in Table 1. There were 424 moving vehicles in the MS-1 image, and 399 vehicles were detected correctly. Only 18 vehicles were missed and 43 detected vehicles were noise. As shown in Table 1, the producer accuracy was 95 % and user accuracy was 90%. The results of vehicle detection from MS-2 images are similar to vehicle detection in the MS-1 image. Almost all the vehicles of MS-1 and MS-2 images were detected. The main advantage of the developed approach is that there is no need of road extraction prior to the vehicle detection. Furthermore, both light and dark colour vehicles are detected. A few false vehicles are detected due to vehicles’ shadows and lines on the road.
Table 1: Accuracy of vehicle detection from WorldView-2 imagery
Vehicle extracted
True
count Correct Omission Commission
Road1 135 130 125 5 10
Road2 127 119 119 0 8
Road3 76 70 65 5 11
Road4 86 80 72 8 14
Total 424 399 381 18 43
Producer accuracy (correct/true)×100
User accuracy (correct/extracted)×100
95.49 % 89.86 %
2.8 Speed Computation from WorldView-2 Imagery
Due to slight time delay in WorldView-2 MS-1 and MS-2 sensors, the speed of a moving vehicle can be computed using vehicle’s positions in MS-1 and MS-2 images. The time delay between MS-1 and MS-2 is 0.22 second (Tao and Yu, 2011). The accuracy of a vehicle’s speed computation is highly dependent on the accuracy of a vehicle’s position determination due to the very small time delay.
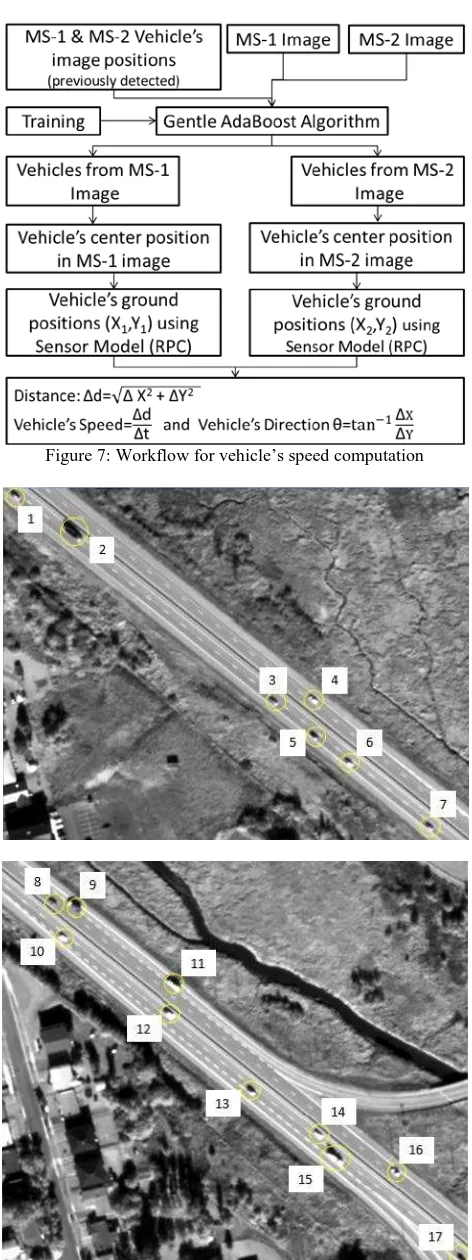
The vehicles detected in the previous section have been used to detect vehicles’ accurate position on the ground. In the previous section, moving vehicles are detected after the resampling of the MS image; therefore, if vehicles’ centre positions are calculated from the detected vehicles, the error can reach up to 0.5 pixels. This will directly affect the accuracy of vehicles’ speed calculation. Thus, to minimize the error in vehicles’ speed computation due to resampling, adaptive boosting (AdaBoost) machine learning algorithm has been used to detect vehicles from the original (without resampling image) MS-1 and MS-2 images again. To make detection process efficient and accurate, first, the approximate positions of moving vehicles are computed using previously detected vehicles. Then, these positions are inputted to the AdaBoost algorithm to limit the search space for the vehicles. The workflow for vehicle’s speed computation is shown in Figure 7.
AdaBoost or boosting is a machine learning algorithm which builds a strong classifier by linear weighted combinations of weak classifiers. A group of boosting algorithms have been discussed in (Freund and Schpire, 1997; Freund and Schpire, 1999). Leitloff and Hinz (2010) have used Gentle AdaBoost algorithm (Friedman et al, 2000) to detect vehicles from the QuickBird Pan image. They have found that Gentle AdaBoost algorithm is most suitable for working with satellite imagery as this algorithm is less sensitive to the errors in the training set. The Gentle AdaBoost classification algorithm needs a proper
Figure 7: Workflow for vehicle’s speed computation
Figure 8: Test vehicles on Pan imagery for speed computation
training to optimize the boosting parameters. In the Leitloff and Hinz (2010) approach, after the training process, Gentle AdaBoost algorithm has been applied to detect vehicles from the roads areas of the Pan image. In this paper, the search space
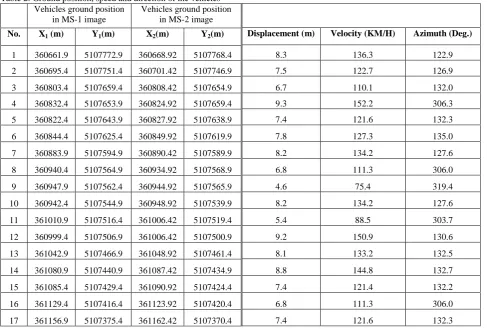
Table 2: Ground position, speed and direction of the vehicles
1 360661.9 5107772.9 360668.92 5107768.4
2 360695.4 5107751.4 360701.42 5107746.9
3 360803.4 5107659.4 360808.42 5107654.9
4 360832.4 5107653.9 360824.92 5107659.4
5 360822.4 5107643.9 360827.92 5107638.9
6 360844.4 5107625.4 360849.92 5107619.9
7 360883.9 5107594.9 360890.42 5107589.9
8 360940.4 5107564.9 360934.92 5107568.9
9 360947.9 5107562.4 360944.92 5107565.9
10 360942.4 5107544.9 360948.92 5107539.9
11 361010.9 5107516.4 361006.42 5107519.4
12 360999.4 5107506.9 361006.42 5107500.9
13 361042.9 5107466.9 361048.92 5107461.4
14 361080.9 5107440.9 361087.42 5107434.9
15 361085.4 5107429.4 361090.92 5107424.4
16 361129.4 5107416.4 361123.92 5107420.4
17 361156.9 5107375.4 361162.42 5107370.4
to detect vehicles is minimized by utilizing the vehicles’ image positions detected from the previous section. This has increased both efficiency and accuracy of the Gentle AdaBoost classification algorithm in vehicle detection. Total 150 vehicles have been used to train the Gentle AdaBoost algorithm. The detailed description of this process is beyond scope of this paper. Once, vehicles from MS-1 and MS-2 images have been detected, vehicles’ centre positions are determined by calculating the centre of mass of the detected vehicles. This results in vehicles’ positions in MS-1 and MS-2 images.
Speed calculation needs two ground positions of a moving vehicle. Vehicles’ ground positions can be computed using their image positions and the satellite sensor model (RPC). The HR satellites vendors such as QuickBird and WorldView-2 provide a rational polynomial coefficient (RPC) as their geometric sensor model. The RPC sensor model (Xiong and Zhang, 2008) is given as:
Where (x, y) are the image coordinates, (X, Y, Z) are the ground coordinates and ɑijk is the polynomial coefficients.
Displacement (m) Velocity (KM/H) Azimuth (Deg.)
8.3 136.3 122.9
The polynomial coefficients ɑijk are provided by WorldView-2 satellite. Therefore, by putting the vehicle’s images position in equation (4) and equation (5), the vehicle’s ground coordinates can be calculated.
Figure 7 shows 17 vehicles selected for testing the accuracy of vehicle’s speed calculation. Vehicles from the MS-1 and MS-2 images were detected using Gentle AdaBoost algorithm. Then centre positions of vehicles were determined by calculating the centre of mass of the detected vehicles. Next, the vehicles’ ground positions were computed using WorldView-2 RPC model. Finally, the vehicles’ ground coordinates were used to compute vehicles’ speed and direction. Table-2 shows the result. The vehicles’ speed shown in the result is normal on the highways. In the Table-2, speed of vehicle no. 9 is 75.4 Km/h. This is because; the vehicle is on slow lane. Similarly, speed of vehicle no. 11 is 88.4 Km/h because this vehicle has just joined the highway. Therefore speed calculated using the developed methodology seems realistic and can be used for traffic planning and management purposes.
3. DISCUSSION AND ERROR ANALYSIS
In this paper, it has been observed that the vehicles are more accurately detected on highways because there are wide roads, fewer trees and fewer manmade structures. The rate of false vehicle detection is high inside the city area. The accuracy of vehicle detection in the city will be improved if roads can be extracted from the Pan image before vehicle detection.
The accuracy of vehicles’ speed computation is highly affected by the vehicles’ image position. If the vehicles’ image positions
have a 0.5m pixel error, the vehicles’ ground positions will have 1m error. This paper uses centre of mass of the detected vehicles as the vehicles’ image positions. As suggested by Xiong and Zhang (2008), a sub-pixel segmentation method will improve the accuracy of vehicles’ image positions. Furthermore, in this paper, only MS-1 and MS-2 images are used to detect two ground positions of a moving vehicle. An additional ground position of a moving vehicle can be computed from the Pan image which will provide redundant data to find and correct the vehicle’s speed. In addition to this, the RPC models provided by satellites have a positioning error (Xiong and Zhang, 2008) which propagated to the vehicle’s ground position. Therefore, sensor refinement can further improve the accuracy of vehicle speed computation.
4. CONCLUSIONS
A new methodology for automatic moving vehicle detection and moving vehicle information extraction from a single pass WorldView-2 satellite is presented. This includes two major components: (1) A new automatic approach to detect moving vehicles from MS-1 and MS-2 images in which there is no need to extract roads prior to the vehicle detection; (2) A method to extract moving vehicle information (position, speed, and direction). The experimental results demonstrate that this technique can automatically extract moving vehicles’ information from one pass WorldView-2 imagery. Therefore, this technique makes it feasible to use WorldView-2 imagery for traffic applications on an operational basis. Thus, this technique potentially offers a cost effective way to extract moving vehicles’ information for traffic management and planning.
Although the developed technique has achieved a fair level of accuracy, still there is potential for further improvements such as: (1) Automatic road extraction from Pan image prior to moving vehicle extraction; (2) Vehicle detection from Pan images; (3) An improvement in calculation of vehicles’ image coordinates. These improvements will be the part of future research.
REFERENCES
Coppin, P. Jonckheere, I., Nackaerts, K., and Muys, B., 2004. Digital change detection methods in ecosystem monitoring: A review. Int. J. Remote Sens., vol. 25, no. 9, pp. 1565–1596.
Freund, Y., and Schapire, R. E., 1997. A decision-theoretic generation of on-line learning and an application to boosting. Journal of Computer and System Sciences, vol. 55, no. 1, pp. 119-139.
Freund, Y., and Schapire, R. E., 1999. A short introduction to boosting. Journal of Japanese Society for artificial Intelligence, vol. 14, no. 5, pp. 771-780.
Friedman, J., Hastie, T., and Tibshirani, R., 2000. Additive logistic regression: A statistical view of boosting. Ann. Stat., vol. 28, no. 2, pp. 337–407.
Gerhardinger, A., Ehrlich, D. and Pesaresi, M., 2005. Vehicle detection from very high resolution satellite imagery. Int. Arch.
Photogrammetric & Remote Sensing Spatial Information Science, vol. 36, no. Part 3/W24, pp. 83–88.
Jin,X., and Davis,C. H., 2007. Vehicle detection from high-resolution satellite imagery using morphological shared-weight neural networks. Image and Vision Computing, vol. 25, no. 9, pp. 1422–1431.
Leitloff, J., Hinz, S., and Stilla, U., 2010. Vehicle Detection in Very High Resolution Satellite Images of City Areas. Geoscience and Remote Sensing, IEEE Transactions, vol.48, no.7, pp.2795-2806.
Liu, W., Yamazaki, F., Vu, T. T., 2010. Automated Vehicle Extraction and Speed Determination From QuickBird Satellite Images. Selected Topics in Applied Earth Observations and Remote Sensing, IEEE Journal of , vol.PP, no.99, pp.1-8, 0.
Otsu, N., 1979. A threshold selection method from gray-level histograms, IEEE Transaction. Systems, Man and Cybernetics, vol. SMC-9, no. 1, pp. 62–66, Jan.
Tao, J., and Yu, Wenxian., 2011. A Preliminary Study on Imaging Time Difference among Bands of Worldview-2 and Its Potential Applications.
http://dgl.us.neolane.net/res/img/155c93a0f08ede72818d5a6d17 c8037c.pdf(Jan 28, 2012)
Tronin, A. A, 2006. Remote sensing and earthquakes: A review, Phys. Chem. Earth, vol. 31, no. 4–9, pp. 138–142.
Xiong Z., and Zhang,Y., 2008. An initial study on vehicle information extraction from single pass of satellite QuickBird imagery, Photogrammetric & Remote Sensing, vol. 74, no. 11, pp. 1401–1411.
Zheng H., and Li, L., 2007. An artificial immune approach for vehicle detection from high resolution space imagery. International Journal in Conputer Science and Network, vol. 7, no. 2, pp. 67–72.
Zheng, H.,Pan, L., and Li, L., 2006. A morphological neural network approach for vehicle detection from high resolution satellite imagery. in Proc. Int. Conf. Neural Information Processing, vol. 4233, Lecture Notes in Computer Science, I. King, J. Wang, L. Chan, and D. L. Wang, Eds. New York: Springer-Verlag, pp. 99–106.
ACKNOWLEDGEMENT
This research was funded by the Canada Research Chairs Program. WorldView-2 image was provided by DigitalGlobe® Inc. to Bahram Salehi (University of New Brunswick).