Radiometric Cross-calibration of KOMPSAT-3A with Landsat-8
D. Y. Shin a, H. Y. Ahna, S. G. LEE, b, C. U. Choia, J. S. Kima*
a Dept. of Spatial Information Engineering, Pukyong National University 45, Yongso-ro, Nam-gu, 45813 Rep. of KOREA - [email protected]
b Data Processing & Cal/Val Team, Korea Aerospace Research Institute, 169-84, Gwahak-ro, Yuseong-gu, Daejeon, 34133, Rep. of KOREA - [email protected]
Commission I, WG I/4
KEY WORDS: Cross Calibration. PICS, KOMPSAT-3A, Landsat-8
ABSTRACT:
In this study, Cross calibration was conducted at the Libya 4 PICS site on 2015 using Landsat-8 and KOMPSAT-3A. Ideally a cross calibration should be calculated for each individual scene pair because on any given date the TOA spectral profile is influenced by sun and satellite view geometry and the atmospheric conditions. However, using the near-simultaneous images minimizes this effect because the sensors are viewing the same atmosphere. For the cross calibration, the calibration coefficient was calculated by comparing the at sensor spectral radiance for the same location calculated using the Landsat-8 calibration parameters in metadata and the DN of KOMPSAT-3A for the regions of interest (ROI). Cross calibration can be conducted because the satellite sensors used for overpass have a similar bandwidth. However, not all satellites have the same color filter transmittance and sensor reactivity, even though the purpose is to observe the visible bands. Therefore, the differences in the RSR should be corrected. For the cross-calibration, a calibration coefficient was calculated using the TOA radiance and KOMPSAT-3 DN of the Landsat-8 OLI overpassed at the Libya 4 Site, As a result, the accuracy of the calibration coefficient at the site was assumed to be ± 1.0%. In terms of the results, the radiometric calibration coefficients suggested here are thought to be useful for maintaining the optical quality of the KOMPSAT-3A.
1. INTRODUCTION
KOrea Multi-Purpose SATellite (KOMPSAT)-2 and -3 were commissioned to satisfy the demand for high-resolution satellite images in Korea. On March 26, 2015, KOMPSAT-3A was launched successfully, and Calibration and Validation (Cal/Val) began recently to improve image quality during the Launch and Early Operation Phase (LEOP). Cal/Val is divided into three parts: geometric, radiometric, and spatial. In this paper, we report the results of the radiometric Cal/Val of the spectral application images.
Since launching the KOMPSAT series, their imagery has been radiometric characterized by the Korea Aerospace Research Institute (KARI) and the Pukyong National University Remote Sensing Group (PKNU RSG) (Kim et al. 2015; Lee et al. 2012). In this paper, post-launch in-flight calibration was conducted to promote the stable operation of KOMPSAT-3A during the LEOP. The main contributions of this paper are Cross calibration between the two sensors using simultaneous image pairs, acquired by these two sensors over the Libya 4 PICS site. Cross calibration was executed based on the Landsat-8 OLI. Also, the differences in spectral responses between KOMPSAT-3 and Landsat-8, we applied the SBAF using the EO-1 Hyperion.
2. MEHTOD
In this study, Cross calibration was conducted at the Libya 4 PICS site on 2015, using Landsat-8 and KOMPSAT-3 Three times (Figure 2 and Table 1). Ideally a cross calibration should be calculated for each individual scene pair because on any given date the TOA spectral profile is influenced by sun and satellite view geometry and the atmospheric conditions. However, in this study we using the 2~3 days different images because KOMPSAT-3A is just lunched and LEOP Phase.
* Corresponding author : [email protected]
Site Sensor Date Time (UTC)
Sun Satellite
Zenith (°)
Azimuth (°)
Zenith (°)
Azimuth (°)
Libya 4
K3A 15/04/25 11:41 24.1 233.5 10.2 256.9
L8 15/04/22 08:54 26.6 124.1 nadir
K3A 15/07/09 11:35 16.2 250.5 6.0 76.3
L8 15/07/11 08:54 22.6 101.9 nadir
K3A 15/07/27 11:37 17.9 240.5 3.3 76.6
L8 15/07/27 08:54 23.9 108.3 nadir
Table 1. Metadata of images in this study
For the cross calibration, the calibration coefficient was calculated by comparing the at sensor spectral radiance for the same location calculated using the Landsat-8 calibration parameters in metadata and the DN of KOMPSAT-3A for the regions of interest (ROI).
Each region of interest (ROI) for Cross calibration (Libya 4 Site) was selected to be homogenous, with a size of about 9 km × 9 km. To maintain equivalence in the pixel size between KOMPSAT-3 and Landsat-8 images, the KOMPSAT-3A images were resampled to a 30-m pixel size from their original 2.4-m resolution for multispectral bands using bilinear resampling. The International Archives of the Photogrammetry, Remote Sensing and Spatial Information Sciences, Volume XLI-B1, 2016
XXIII ISPRS Congress, 12–19 July 2016, Prague, Czech Republic
This contribution has been peer-reviewed.
2.1 Sensor Overview
Table 1. lists the key specifications of the KOMPSAT-3A AEISS-A, Landsat-8 OLI, and the EO-1 Hyperion sensor. Only the four bands that the three sensors have in common, as listed in the table. for clarity the bands considered in this paper are named Blue, Green, Red, and Near Infrared (NIR).
Parameter EO-1 Hyperion KOMPSAT-3A Landsat-8
Spectral Bands
B B11 ~18
0.45~ 0.52 B1
0.45~ 0.52 B2
0.45~ 0.52 G B16~25 0.52~ 0.59 B2 0.52~ 0.60 B3 0.55~0.60 R B28
~34 0.63~ 0.69 B3
0.63~ 0.69 B4
0.63~ 0.68 N B39
~56 0.74~ 0.90 B4
0.76~ 0.90 B5
0.84~ 0.88 GSD at Nadir 30 m 2.8 m 30 m Quantization 10 bit 14 bit 12 bit Swath width 7.5 km 15 km 185 km Altitude 705 km 685 km 705 km Scanner Push broom Push broom Pushbroom Table 2. Metadata of images in this study
Landsat-8 is the latest platform in the 40 year Landsat series of satellites. The visible and near infrared (VNIR) bands retain many of the characteristics of previous Landsat sensors, such as a 185km swath width, a 30m ground instantaneous field of view (GIFOV) for the multispectral bands, and a 15m GIFOV for the panchromatic band. One prominent change was the transition from a whiskbroom configuration (ETM+) to a pushbroom configuration, which was successfully demonstrated by the EO-1 Advanced Land Imager (ALI) (Irons et al. 20EO-12).
The NASA EO-1 satellite was launched on November 21, 2001 as part of a one year technology validation/demonstration mission. The Hyperion pushbroom hyperspectral sensor covers the 0.4~2.5μm spectral range with 242 spectral bands at a 10nm spectral resolution and a 30m spatial resolution, acquiring spectra over a 7.7km swath width. The spectral characterization of Hyperion is well documented (Ungar et al. 2009), and the Hyperion RSR is characterized using a Gaussian profile. Overall, the EO-1 Hyperion sensor is radiometrically stable to within 5%, based on the lunar observations in comparison with the United States Geological Survey (USGS) Robotic Lunar Observatory (ROLO) (Folkman et al. 2001).
Figure 1. RSR of the sensor used in this study
Figure 2 shows the band average RSR of KOMPSAT-3A together with the Landsat-8 OLI and EO-1 Hyperion. In general, KOMPSAT-3 bands are narrower than the Landsat-8 OLI bands because the Landsat-8 OLI band edges have been refined to avoid atmospheric absorption features. The Landsat-8 OLI NIR band is substantially narrower, and so avoids the water vapor absorption feature at approximately 825, 940 nm. These differences mean that even when both sensors are observing the same general region of the electromagnetic spectrum at the same time, they may report different radiance values depending on the spectral signature of the target.
2.1 Libya-4 Site
PICS-based calibration is only good as long as the sites being used continue to exhibit a reasonable spatial, temporal and spectral stability. Optimal test sites for radiometric calibrations are spectrally and spatially homogenous, vary little over time, are near-Lambertian, and have higher surface reflectance. Therefore, PICS are typically used for EOS radiometric cross-calibration (Dinguirard and Slater 1999). In particular, deserts provide optically stable sites suitable for absolute sensor calibration, for example in Libya, Algeria, Niger, and Mauritania. This study cross-calibration TOA reflectance with the Landsat-8 OLI sensor, a multispectral sensor with similar bandwidth, to evaluate the vicarious calibration coefficient of KOMPSAT-3A AEISS-A sensor radiometric calibration.
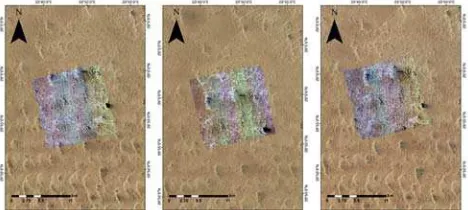
Libya 4 is a high-reflectance site located in the Libyan Desert in Africa at coordinates +28.55◦ N and +23.39◦ E and at an elevation of 118 m above sea level. It is referenced in the worldwide reference system 2 with path 181 and row 40. The site is named Libya 4 as opposed to Libya because of the presence of other pseudo invariant sites in Libya. Figure 2 shows the Libya-4 PICS true color image of KOMPSAT-3A and Landsat-8 used for cross calibration.
Figure 2. K3A and L8 Libya-4 Site Image for Cross Calibration
2.2 TOA Radiance and Reflectance
The Landsat-8 OLI uses two independent National Institute for Standards and Technology (NIST), USA traceable radiance and reflectance calibration methods. We used the Landsat-8 metadata file, including the coefficients necessary to convert to radiance, and the reflectance from the quantized and calibrated DNs of the product (Helder et al. 2013).
This can achieve rapid conversion by calculating the radiometric rescaling factor offered in the MTL file using the following formula:
DN ∗ MULT ADD (1)
Where, MULT = Band-specific multiplicative rescaling factor, ADD = Band-specific additive rescaling factor, DN = Quantized and calibrated standard product pixel values
The International Archives of the Photogrammetry, Remote Sensing and Spatial Information Sciences, Volume XLI-B1, 2016 XXIII ISPRS Congress, 12–19 July 2016, Prague, Czech Republic
This contribution has been peer-reviewed.
The at-sensor or TOA reflectance is used to reduce illumination differences among images and to normalize for solar irradiance. Because atmospheric effects and surface topographic effects are not corrected, this includes the Earth’s surface reflectance and atmospheric reflectance (Cao et al. 2008). When comparing the radiometric quality obtained from the other sensors, the cosine effect of the different solar zenith angles due to the differences in time in obtaining materials could be removed if TOA reflectance was used instead of the TOA radiance. The equation to calculate the TOA Reflectance (ρ) of KOMPSAT-3 and Landsat-8 is as follows:
ρ ∙ ∙∙ (2)
Where, ρ is planetary reflectance, is spectral radiance at the sensor aperture (either KOMPSAT-3 or Landsat-8 (W/m2 ㎛ sr), is the band dependent mean solar exoatmospheric irradiance (W/m2㎛), is the solar zenith angle (radians), and
is the earth sun distance (astronomical units). 2.1 SBAF (KOMPSAT-3)
EO-1 Hyperion sensor images were used to derive the spectral band adjustment factor (SBAF) to compensate for the differences in the RSR between the sensors. Although SBAF is discussed briefly in this section, readers are directed elsewhere for the detailed mathematical expressions for SBAF (Chander et al. 2013).
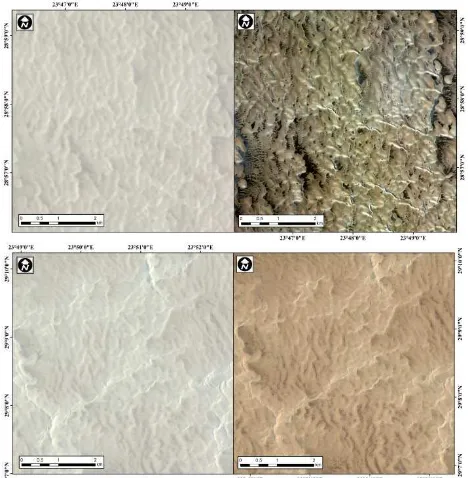
Figure 3. Common area of KOMPSAT-3, Landsat-8 and Hyperion images in Libya-4 PICS site for Appling SBAF. The suitability of the Hyperion sensor for the assessment of spectral band differences has also been addressed elsewhere in the literature (Chander et al. 2009). The SBAF was calculated using KOMPSAT-3 and EO-1 on July 6 2014, and using Landsat-8 and EO-1 on July Landsat-8 2014 (Figure 3). SBAF can be calculated using the following formula by utilizing the integral values of the RSR [11]:
d RSR
d RSR sensor) * (
) (
) (
B A SBAF
SBAF
A
A
*)
(
)
(
(3)Here, RSRis the RSR of the sensor,
is the hyperspectral TOA reflectance profile, (A) is the simulated TOA reflectance for sensor A, (B) is the simulated TOA reflectance for sensor B, (A*) is the compensated TOA reflectance for sensor A when using the SBAF to match sensor B TOA reflectance.3. RESULT
For the cross calibration, the calibration coefficient was calculated by comparing the at sensor spectral radiance for the same location calculated using the Landsat-8 calibration parameters reported in various studies and the TOA Reflectance of KOMPSAT-3 for the target area.
Cross calibration results were tested for a slope value of 1.0 (corresponding to an exact agreement in radiances between the two sensors) at a 0.001 significance level after fitting a regression line to data from the common area of interest. For KOMPSAT-3, the regression lines were determined for data within each band, as was an overall regression combining all of the data points from all bands. For the quantitative or cross calibration of the different sensors, in which spectral resolution and characteristics differed, the pixels were converted into radiance at the sensor.
Date Band
TOA Reflectance Cross Coef. K3A L8
04/25 (K3) 04/22 (L8)
B 0.245 0.259 0.9459 G 0.326 0.325 1.0031 R 0.468 0.452 1.0354 N 0.581 0.513 1.1326
07/09(K3) 07/11 (L8)
B 0.251 0.240 1.0458 G 0.338 0.318 1.0629 R 0.473 0.428 1.1051 N 0.601 0.500 1.2020
07/27(K3, L8)
B 0.251 0.248 1.0121 G 0.335 0.323 1.0372 R 0.466 0.432 1.0787 N 0.596 0.488 1.2213 Table 3. Cross Calibration Result
The TOA reflectance of Landsat-8 and KOMPSAT-3A were compared for the calibration coefficient and the percentage difference was calculated using the Libya-4 PICS (Table 3). From this, the blue and green bands were within 4%. In the red band, the TOA reflectance of KOMPSAT-3A and Landsat-8 differed by ~8%. However, in the NIR band, the average difference in TOA reflectance was 22% for the Libya site. This can be explained by the values in the band RSR of two sensors, The International Archives of the Photogrammetry, Remote Sensing and Spatial Information Sciences, Volume XLI-B1, 2016
XXIII ISPRS Congress, 12–19 July 2016, Prague, Czech Republic
This contribution has been peer-reviewed.
which differed significantly from the NIR band and, unlike Landsat-8, the KOMPSAT-3A sensor reacted in a spectral region of 940 nm that is highly affected by water vapor absorption. This explains the lower TOA reflectance of KOMPSAT-3A in the NIR band than that of Landsat-8 (Brooke 2012). However, after comparing the KOMPSAT-3 sensor with the same RSR with Spectral Band Adjustment Factor (SBAF)(Shin et al, 2015), the difference was calculated as < 5%, which was considered to be appropriate(Table 4).
Band L8 K3A Diff % diff (b-a)/b St dev.
SBAF (K3)
SBAF K3A (c)
Diff SBAF % diff
a b b-a c-a
B 0.251 0.248 -0.003 -1.19 0.004 0.979 0.243 -0.008 -3.27 G 0.335 0.323 -0.012 -3.65 0.007 1.014 0.328 -0.007 -2.23 R 0.466 0.432 -0.034 -7.78 0.011 1.023 0.442 -0.024 -5.16 N 0.596 0.488 -0.108 -22.04 0.015 1.221 0.596 0.000 - 0.03 Table 4. Apply SBAF for 07/27 Cross calibration result
4. CONCLUSION
In this study, with KARI and PKNU RSG, the relationship between the DN and sensor radiance was calculated using the radiometric calibration coefficient through cross calibration of the KOMPSAT-3A sensor.
In the cross-calibration, Standard deviation between Cross calibration coefficients are shown up to about 3% difference. Also it showed that over time, a coefficient value decreased. Therefore, it is determined that such sensor degradation phenomenon need to be analyzed. Before and after SBAF compensation in the blue and green bands, the differences in the red band improved from –7 to – 5%, and the differences in the NIR band improved from –22 to 3%.
This likely resulted in the band RSR difference, as the difference between Landsat-8 and KOMPSAT-3A NIR band is due to the water vapor region in the NIR band. They are believed to provide a good scale for maintaining the optical quality of KOMPSAT-3A AEISS-A, which lacks data for prelaunch, onboard, and vicarious calibration. However, we need to analyze the nonlinearity generated by determining the calibration coefficient and reduce the uncertainty (atmosphere and BRDF effect).
ACKNOWLEDGEMENTS
This work was supported by the BK21 Plus project of The Research management team of Earth Environmental Hazard System at Pukyong National University
REFERENCES
Brooke, B. 2012. “Characterization of the Libyan Desert in Support of Vicarious Calibration.” Master’s thesis, University of Northeastern.
Chander, G.; Mishra, N.; Helder, D.L.; Aaron, D.; Angal, A.; Choi, T.; Xiong, X.; Doelling, D. Applications of spectral band adjustment factors (SBAF) for cross calibration. IEEE Trans. Geosci. Remote Sens.2013, 51, 1267–1281.
Chander, G.; Markham, B.L.; Helder, D.L. Summary of current radiometric calibration coefficients for Landsat MSS, TM, ETM+, and EO-1 ALI sensors. Remote Sens. Environ.2009,113, 893–903.
Dinguirard, M.; Slater, P.N. Calibration of space-multispectral imaging sensors: A review. Remote Sens. Environ. 1999, 68, 194–205.
Cao, C.; Xiong, X.; Wu, A.; Wu, X. Assessing the consistency of AVHRR and MODIS L1B reflectance for generating Fundamental Climate Data Records. J. Geophys. Res. Atmos. 2008, doi:10.1029/2007JD009363.
Folkman, M.A.; Pearlman J.; Liao B.L.; Jarecke P.J. EO-1/Hyperion hyperspectral imager design, development, characterization, and calibration. In Proceedings of Hyperspectral Remote Sensing of the Land and Atmosphere, SPIE, Sendai, Japan, 2001.
Helder, D.L.; Thome, K.J.; Mishra, N.; Chander, G.; Xiong, X.; Angal, A.; Choi, T. Absolute radiometric calibration of Landsat using a pseudo invariant calibration site. IEEE Trans. Geosci. Remote Sens. 2013, 51, 1360–1369.
Irons, J.R.; Dwyer, J.L.; Barsi, J.A., The next Landsat satellite: The Landsat Data Continuity Mission. Remote Sens. Environ. 2012, 122, 11–21.
Jin, C.; Lee, S. Cross calibration for KOMPSAT2 MSC images using EO-1 Hyperion. In Proceedings of the International Symposium on Remote Sensing (ISRS), Busan, Korea, 2014 Kim J.S.; Jin, C.G.; Choi, C.U.; Ahn. H.Y. Radiometric characterization and validation for the KOMPSAT-3 sensor. REMOTE SENSING LETTERS. 2015, 6(7),529-538.
Lee, S.; Jin, C.; Choi, C.; Lim, H.; Kim, J. Absolute radiometric calibration of the KOMPSAT2 multispectral camera using a reflectance-based method and empirical comparison with IKONOS and QuickBird images. J APPL REMOTE SENS2012, 6, 063594.
Shin, D. Y., C. G. Jin, H.Y. Ahn, and C. U. Choi. “Radiometric cross-calibration of KOMPSAT-3 with Landsat-8.” Proceedings of SPIE, 9644, 96441T. doi:10.1117/12.2195643;
Ungar, S.; Middleton, E.; Ong, L.; Campbell, P. EO-1 Hyperion onboard performance over eight years: Hyperion calibration. In Proceedings of 6th European Association of Remote Sensing Laboratories (EARSeL), Ramat Aviv, Tel-Aviv, Israel, 2009. The International Archives of the Photogrammetry, Remote Sensing and Spatial Information Sciences, Volume XLI-B1, 2016
XXIII ISPRS Congress, 12–19 July 2016, Prague, Czech Republic
This contribution has been peer-reviewed.