RECORDING AND MODELLING OF MONUMENTS' INTERIOR SPACE USING
RANGE AND OPTICAL SENSORS
1Charalampos GEORGIADIS, 2Petros PATIAS, 3Vasilios TSIOUKAS,
1School Civil Engineering, Aristotle University of Thessaloniki
P.O. BOX 465 GR-54124, Thessaloniki, Greece, [email protected] 2School of Rural and Surveying Engineering, Aristotle University of Thessaloniki
P.O. BOX 473, GR-54124, Thessaloniki, Greece, [email protected] 3School of Rural and Surveying Engineering, Aristotle University of Thessaloniki
P.O. BOX 473, GR-54124, Thessaloniki, Greece, [email protected]
SpS 1 CIPA: Geospatial Technology for Cultural Heritage
KEY WORDS: Photogrammetry, Cultural Heritage, Laser Scanning, Multi Sensor, 3D Modelling
ABSTRACT:
Three dimensional modelling of artefacts and building interiors is a highly active research field in our days. Several techniques are being utilized to perform such a task, spanning from traditional surveying techniques and photogrammetry to structured light scanners, laser scanners and so on. New technological advancements in both hardware and software create new recording techniques, tools and approaches. In this paper we present a new recording and modelling approach based on the SwissRanger SR4000 range camera coupled with a Canon 400D dSLR camera. The hardware component of our approach consists of a fixed base, which encloses the range and SLR cameras. The two sensors are fully calibrated and registered to each other thus we were able to produce colorized point clouds acquired from the range camera. In this paper we present the initial design and calibration of the system along with experimental data regarding the accuracy of the proposed approach. We are also providing results regarding the modelling of interior spaces and artefacts accompanied with accuracy tests from other modelling approaches based on photogrammetry and laser scanning.
1. INTRODUCTION
Three dimensional modelling of artefacts and building interiors is a highly active research field in our days. Several techniques are being utilized to perform such a task, spanning from traditional surveying techniques and photogrammetry to structured light scanners, laser scanners and so on. New technological advancements in both hardware and software create new recording techniques, tools and approaches. Several approaches, methods and tools have been developed in the recent years. In (Georgiadis et all, 2009) new tools and methodologies for the 3d modelling of small objects were presented. Furthermore extensive studies regarding the SR400 have been performed. Kahlmann et all, 2006, Robbins et all, 2008, Chiabrando et all, 2009 presented calibration methodologies to increase the accuracy of a swissranger range camera,
In this paper we present a new recording and modelling approach based on the SwissRanger SR4000 range camera coupled with a Canon 400D dSLR camera. The hardware component of our approach consists of a fixed base, which encloses the range and SLR cameras. The two sensors are fully calibrated and registered to each other thus we were able to produce colorized point clouds acquired from the range camera. In this paper we present the initial design and calibration of the system along with experimental data regarding the accuracy of the proposed approach. We are also providing results regarding the modelling of interior spaces and artefacts accompanied with accuracy tests from other modelling approaches based on photogrammetry and laser scanning.
The calibration procedure was applied using our home made software that was able to automatically recognize the intensity image of GCPs groundels measured by the range camera and to correlate them with the visual image captured with the dSLR camera. As a result we were able to produce coloured point clouds using our software. The next step was to perform a series
of experiments regarding the accuracy of the range camera data. Our initial processing showed that we achieved an accuracy of approximately 1/5 of the range camera’s groundels.
2. THE DESIGN OF THE PROPOSED SYSTEM
Figure 1. The Proposed System’s setup (front view, side view) In figure 2 the range camera coordinate system is presented.
Figure 2. Swiss ranger SR4000 coordinate system The calibration of the system was necessary to provide colour information of the generated point cloud since the range camera lacks of an imaging sensor. To implement the calibration of the system, the exterior orientation and the calibration parameters of the camera should be calculated.
2.1 Camera Calibration
For the camera calibration the OpenCV library was used to develop a standalone application that has the ability to process images, depicting the circular targets of a printed calibration field, and calculates the additional camera calibration parameters (Balletti, et. al. 2014).
A modified Brown camera calibration mathematical model has been used to determine all the appropriate parameters and correct lens deformation appearing on an image (Brown, D.C., 1971).
The equations (1-4) supply to the generic collinearity equations a model to eliminate systematic errors.
The final estimation of the camera position (X0, Y0, Z0) and attitude (ω, φ, κ) is calculated if we take into account the mathematical model including the additional camera calibration parameters namely:
f: precise focal distance calculated from the self-calibration process
x0,y0: principal point location (projection of the centre of lenses on the camera sensor)
k1, k2, k3, p1, p2: coefficients for the modelling of radial and tangential distortion
All the above mentioned parameters are estimated before the camera use and are taken into account for the better estimation of the camera pose, however there is way to provide with the help of the camera calibration parameters (x0, y0, k1, k2, k3, p1, p2) another image that is similar to the original created by our camera
but it is free of systematic errors. The image is called idealized and all the previous mentioned errors are corrected after the calibration process.
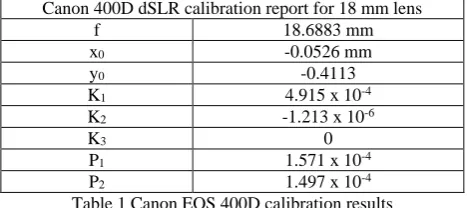
The following table presents the camera calibration parameters. Canon 400D dSLR calibration report for 18 mm lens
f 18.6883 mm
Table 1 Canon EOS 400D calibration results
The idealized image is more accurate since there is no visual effect of the barrel distortion which might an obstacle to recognize long linear futures on the images.
2.2 System Calibration
The exterior orientation of the idealized image was then extracted using ground control points coordinates determined automatically on the intensity image of the range camera and the optical image derived by the dSLR camera.
For the system calibration a calibration field was constructed. The calibration field had 14 control points (circular targets). In figure 3 the optical image captured by the camera and the intensity image captured by the TOF sensor are presented.
Figure 3a
The intensity image is coupled with a file including the Cartesian coordinates XYZ of the measured points from the range camera. Each pixel (i, j) is connected to a unique point in the 3D space which is stored in the 3D Cartesian coordinates file. For the accurate detection of the control points in both the optical and intensity images a centre of gravity algorithm was used. The algorithm detects the centre of the elliptical structure of the control points in the images and the 3D Cartesian coordinates of the points. Using these GCP the exterior orientation was calculated by applying a resection adjustment. The following table presents the exterior orientation parameters.
The system calibration accuracy (estimation of the exterior orientation parameters) is limited by the spatial resolution of the range camera point cloud acquisition, which is approximately 0.5 centimetres.
2.3 Point cloud colouring
The point cloud is coloured using the exterior orientation and the camera calibration parameters. For the colouring of the point cloud the idealized image is used using the collinearity equations.
= 0− ��� −− +�+� −− +�+� −− (5)
= 0− ��� −− +�+� −− +�+� −− (6)
Where
x0, y0 are the coordinates of the principal point f is the focal length
x, y are the image coordinates of a point P
X, Y, Z are the 3D Cartesian coordinates of a point P X0, Y0, Z0 are the camera station coordinates,
and R11, …., R33 are the elements of the rotation matrix. Figure 4 demonstrates the point cloud colouring procedure.
Figure 4.SR 4000 captured point cloud (left), Acquired image of the scene (middle), coloured point cloud (right)
3. ACCURACY ASSESSMENT
For the accuracy assessment of the measuring system a series of experiments and measurements were conducted. The first step was to choose the control objects. Two different setups were used. The first setup involved the modelling of an indoor building space, while the second setup involved the modelling of a medium scale artefact. For the interior space modelling a corner wall with three doors has been chosen, while for the medium scale artefact the back side of a mannequin (resembling a sculpture) has been chosen.
3.1 Interior space modelling
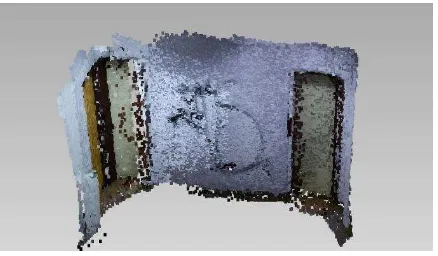
Figure 5 shows the interior building space that was used for the experiments.
Figure 5 View of the interior building space
The wall section was approximately 4.5 x 1.5 meters with a height of approximately 2.5 meters.
3.1.1 The creation of the control model
In order to create the control model, the wall section was scanned using a FARO FOCUS 3D laser scanner. The section was scanned from two different positions resulting in point cloud of approximately 22 million points. The resulted point cloud was triangulated to produce the 3D model of the wall section (figure 6).
Figure 6 3D model of the wall section captured by Faro Focus 3D laser scanner
3.1.2 Creation of the model using the Swiisranger SR4000 and Canon 400D camera device
For the modelling of the same section using the proposed system data were acquired from 7 positions. The average distance of the scans from the wall section were 5 meters. Each scan was processed in order to clear the noise and wrong points acquired by the SR4000 range camera. The produced coloured point clouds were aligned and formed a final point cloud of the section with a total of approximately 141 thousand points (figure 7).
Figure 7 Coloured point cloud captured by the proposed system
3.1.3 Accuracy Assessment
Figure 8 Deviation Map between Faro laser scanner and the proposed system (scale in meters)
Type Data to Reference
(Data Point)
Mean -7 mm
Standard Deviation 29 mm
RMS Error 30 mm
Table 3 Deviation statistics between Faro laser scanner and the proposed system
The results showed an achieved accuracy of 30 mm in the point cloud produced by the proposed system. The highest deviations were observed in corner sections. Furthermore in this experiment the SR4000 range scanner was operating in its maximum acquisition distance.
3.2 Medium scale artefact modelling
For the medium scale artefact modelling a mannequin back was selected. The back’s dimensions are approximately 295 x 425 mm, with a depth variation of 100 mm. 82 points were visualized in the object and 7 of them were used as control points, while the remaining 75 were used as check points. The back surface of the mannequin was modelled using 3 different methods. At first it was measured using the NextEngine 3D laser scanner, then the 82 points were measured using close range photogrammetry techniques. Three images were acquired using a Canon 400D dSLR camera and were processed with Iwitness software. Finally a 3D model was created using our proposed system. The model that was created using the NextEngine 3D laser scanner served as our reference frame.
3.2.1 The creation of the control model
For the creation of the reference 3 dimensional model we used the NextEngine 3D laser scanner. The NextEngine 3D laser scanner is based on triangulation (Tsioukas et all, 2004). It has an accuracy of approximately 12.7 μm, and a resolution of approximately 64 μm in distances up to 30 centimetres. For the creation of the model three individual scans were captured (figure 9), a left one, a right one, and one covering the top of the back.
Figure 9 NextEngine laser scans (left, right and top of the back)
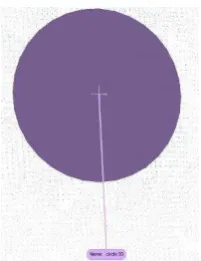
From the left side scan 1,797,989 points were captured, from the right side scan 1,786,459 points were captured and from the top scan 1,153,089 points were captured. The point clouds were merged using the Innovemetric Polyworks software. The total point cloud was comprised of 3,767,254 points. The next step was to estimate the position of the control and check points. For each marker all its points were selected and a circle was fitted (figure 10). We consider the centre of the circle to be the point’s coordinates.
Figure 10 Best fitted circle to marker points
As a result a total of 82 markers were measured. 7 of them were used as control points and 75 as check points.
3.2.2 The creation of the Photogrammetric Model
For the creation of the photogrammetric model 3 images were used (left, centre and right) figure 11 that were captured with a Canon 400D dSLR camera using an 18 mm lens. At first the camera and lens were calibrated using the Iwitness software (Table 4). Then all the markers were measured semi-automatically. Using the coordinates of the 7 control points obtained by the NextEngine 3D measurements, we determined the coordinates of the remaining 75 check points.
Figure 11 Photogrammetric processing images (left, centre, right)
the Y Axis, and 0.20 mm along the Z axis, while the image reference accuracy was 0.36 pixels.
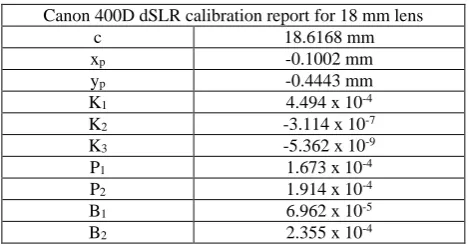
Canon 400D dSLR calibration report for 18 mm lens
c 18.6168 mm
xp -0.1002 mm
yp -0.4443 mm
K1 4.494 x 10⁻⁴
K2 -3.114 x 10⁻⁷
K3 -5.362 x 10⁻⁹
P1 1.673 x 10⁻⁴
P2 1.914 x 10⁻⁴
B1 6.962 x 10⁻⁵
B2 2.355 x 10⁻⁴
Table 4: Canon 400D Iwitness Calibration Report
3.2.3 Creation of the model using SR4000 and Canon 400D camera system
For the creation of the 3D model using our system we captured the scene from a distance of approximately 3 meters. We used an average range image of 10 consecutive frames to compute the scene coordinates. The resolution of our scans was approximately 7.5 mm. Using the coordinates of the 7 control points we calculated a 3 dimensional affine transformation to convert the coordinates to the coordinate system of our reference frame (NextEngine 3D measurements). Finally the coordinates of the 75 check points were estimated.
3.2.4 Accuracy Assessment
The next step was the result’s comparison of our proposed system to the results achieved with the laser scanner and the photogrammetric approach. At first we compared the laser scanner data with the results achieved using the photogrammetric approach. We used two different approaches. At the first approach we compared the differences along the three axes using the check points. The total RMS along each coordinate axis were the following 0.36 mm along the X axis, 0.36 mm along the Y axis, and 0.26 mm along the Z axis. For the second comparison we used the photogrammetrically defined points to create a TIN 3D model of the back, and we compared it with the model created using the NextEngine 3D laser scanner data. In figure 11 we present a difference map of the models. While in table 5 we present the comparison statistics.
Figure 12 Deviation map between NextEngine 3D model and Iwitness model, scale in mm
Type Data to Reference
(Data Point)
Mean 0.3 mm
StdDev 1.6 mm
RMS Error 1.6 mm
Table 5 Deviation statistics between NextEngine and Iwitness Model
It is obvious that the differences in the two approaches are caused by the fact that our photogrammetric model is based on 82 points while the reference model in the overlapping area is comprised by 2894268 points. In general we can assume that the differences between these two approaches are minimal, and both methods can achieve sub millimetre accuracy.
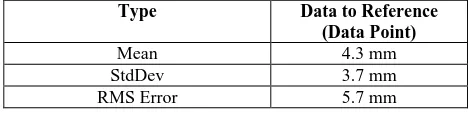
The comparison of the models created by the NextEngine 3D laser scanner and our proposed system followed the same principles. The total RMS along each coordinate axis were the following 2.56 mm along the X axis, 2.35 mm along the Y axis , and 3.48 mm along the Z axis. Comparing the two models difference map (figure 13), and statistics (table 6), we can assume that we can achieve sub centimetre accuracy nearly 0.5 centimetres for most of the points.
Type Data to Reference (Data Point)
Mean 4.3 mm
StdDev 3.7 mm
RMS Error 5.7 mm
Table 6 Deviation statistics between NextEngine and our proposed system Model
4. CONCLUSIONS
In this paper we presented a novel 3D data acquisition system based on the Swissranger SR4000 range camera and a Canon 400D DSLR camera. The system was designed for the creation of 3D models of building’s interior spaces and of small - medium scale artefacts. The designed system was tested in real word conditions to model a medium scale artefact and an interior wall section. Regarding the modelling of the artefacts the system achieved an accuracy of approximately 0.5 centimetres when the data acquisition distance was in the neighbourhood of 3 meters. Furthermore during the mannequin acquisitions the scans were more stable with regard to noise and blunders. In all the scans the noisy and blunder points summed to 4-5% of the total acquired points. In the case of the interior wall section an accuracy of approximately 3 centimetres was achieved for acquisition distances of nearly 5 meters. In this case the noisy and blunder points for most of the scans summed to 10-20% of the acquired points, while in two scans the noisy and blunder points reached 40%. The range camera demonstrated sensitivity in lighting condition and produced erroneous results when acquiring data from dark surfaces. In all the data acquisition procedures the range camera was using the default settings. In the future we plan to develop a calibration method that will calibrate both the distance acquisition and the lens distortion of the range camera.
REFERENCES
Balletti, C., Guerra, F., Tsioukas, V., & Vernier, P. (2014). Calibration of Action Cameras for Photogrammetric Purposes. Sensors, 14(9), 17471-17490.
Georgiadis, Ch., P. Patias, G. Stylianou, 2009. Capturing the past and present: Tools and methodologies for 3D modeling of small objects. CIPA Archives for Documentation of Cultural Heritage, Vol. XXII, ISSN 2076-7730 (proceedings on cd), Proceedings of the CIPA XXII Symposium, October, Kyoto, Japan
Brown, D.C., (1971): Close-range camera calibration. PE&RS, Vol. 37(8), pp.855-866.
Chiabrando, F.; Chiabrando, R.; Piatti, D.; Rinaudo, F. Sensors for 3D Imaging: Metric Evaluation and Calibration of a CCD/CMOS Time-of-Flight Camera. Sensors 2009, 9, 10080-10096.
Kahlmann, T., Remondino, F. and Ingensand, H., 2006. Calibration for increased accuracy of the range imaging camera SwissRanger. International Archives of Photogrammetry, Remote Sensing and Spatial Information Sciences, 36(Part 5), pp.136-141.
Robbins S., SchroederB., Murawski B.;Heckman N, Leung J, 2008. Photogrammetric calibration of the SwissRanger 3D range imaging sensor, Proc. SPIE 7003, Optical Sensors 2008, 700320 (April 28, 2008); doi:10.1117/12.781551;
Tsioukas, V., Patias, P., & Jacobs, P. F. (2004). A novel system for the 3D reconstruction of small archaeological objects.