Variants in the cholesterol ester transfer protein and lipoprotein
lipase genes are predictors of plasma cholesterol response to
dietary change
Alison J. Wallace
a, Jim I. Mann
a,*, Wayne H.F. Sutherland
b, Sheila Williams
c,
Alexandra Chisholm
a, C. Murray Skeaff
a, Vilmundur Gudnason
d,
Philippa J. Talmud
d, Steve E. Humphries
daDepartment of Human Nutrition,PO Box56,Room7n8,Science II Building,Union Street,Uni6ersity of Otago,Dunedin,New Zealand bDepartment of Medicine,Uni6ersity of Otago,PO Box56,Dunedin,New Zealand
cDepartment of Pre6enti6e and Social Medicine,Uni6ersity of Otago,PO Box56,Dunedin,New Zealand
dDepartment of Medicine,Uni6ersity College London Medical School,Rayne Institute,5Uni6ersity St.,London WC1E6JJ,UK
Received 15 June 1999; received in revised form 8 November 1999; accepted 6 December 1999
Abstract
There are no definitive explanations as to why individuals with hypercholesterolemia, a major cardiovascular risk factor, respond differently to dietary change. Fifty five free-living individuals completed a double crossover trial with two dietary regimens, a high saturated fat diet (providing 21% energy from saturated fat and 3% energy from polyunsaturated fat) and a high polyunsaturated fat diet (providing 11% energy as saturated fat and 10% energy as polyunsaturated fat), each phase continuing for 4 weeks. Extensive genotyping and several measures of dietary compliance have provided further insights regarding the determinants of extent of cholesterol response to changes in the nature of dietary fat. Individuals with the CETP B1B1 genotype and the LPL X447+ allele showed an average 0.44 (95% CI: 0.22, 0.66) and 0.45 (95% CI: 0.18, 0.72) mmol/l greater change in total cholesterol, respectively, than those with one or more CETP B2 allele or homozygous for the LPL S447 allele when comparing diets high and low in saturated fat. Indices of dietary compliance including changes in reported saturated and polyunsaturated fat intake and change in triglyceride linoleate were not significantly different between the CETP genotypes. Change in reported saturated (r=0.36, P=0.04) and polyunsaturated (r=0.22, P=0.05) fat intake and change in triglyceride linoleate (reflecting polyunsaturated fat intake) (r=0.21, P=0.07), also predicted total cholesterol response to dietary fat changes. In multivariate analyses, variation in the cholesterol ester transfer protein and lipoprotein lipase genes predicted response independent of measures of dietary compliance, suggesting that these two genes are important determinants of variation in cholesterol response to dietary change in free-living individuals. © 2000 Elsevier Science Ireland Ltd. All rights reserved.
Keywords:Dietary response; Genetics; Cholesterol; Hypercholesterolemia
www.elsevier.com/locate/atherosclerosis
1. Introduction
Predictable changes in total and low-density lipo-protein cholesterol occur when groups of people change the nature of dietary fat [1]. Several studies have shown considerable individual variation in response to diets differing in nature and amount of fat [2 – 9]. Informa-tion relating to determinants of the extent of individual
response to dietary change is relatively sparse. Male gender, older age, high body mass index, a predomi-nance of small dense LDL particles and high levels of total cholesterol, triglycerides, apolipoprotein (apo) B and cholesterol ester transfer (CET) activity are charac-teristics that have been associated with relatively large changes in plasma total cholesterol levels when nature of dietary fatty acids changes [2,4,6,10]. People with the apo E4E4 or apo E4E3 genotype also appear to be more responsive to changes in the quality of dietary fat than those who have other apoE genotypes [11 – 13]. In * Corresponding author. Tel.: +64-3-4797959; fax: +
64-3-4797958.
E-mail address:[email protected] (J.I. Mann).
addition, polymorphisms of the apoB, apoC, apoA-IV and lipoprotein lipase (LPL) genes have been related to the extent of cholesterol response [14 – 18], though fewer data are available and the findings are less consistent than those relating to the apoE genotypes. We report here on predictors of plasma total cholesterol change in a group of 55 individuals during four dietary periods of high or low saturated fat intake. More extensive geno-typing than had been undertaken previously in a single study has enabled analysis of the extent to which a range of polymorphisms contribute to variation in cholesterol response to alterations in the nature of dietary fat in free-living individuals. Particular attention was paid to effects of variation in the cholesterol ester transfer protein (CETP) and LPL genes as plasma CET activity and the LPL HindIII polymorphisms were as-sociated with response of plasma cholesterol to changes in the type of dietary fat in our earlier study [4,18]. It was also possible to estimate the effect of compliance to dietary advice on variation in response among free living individuals.
2. Methods
2.1. Participants
Sixty two people aged 26 – 64 years, with plasma cholesterol concentration 5.5 – 7.9 mmol/l and
triglyce-ride concentration below 3 mmol/l, were recruited from
a group of 300 volunteers who responded to advertise-ments in the widely read local daily newspaper. None were suffering from chronic medical conditions or tak-ing drugs known to influence lipid metabolism. Fifty-five individuals (23 men and 32 women) completed the 20-week study. Four males and three females withdrew from the study. Their age, baseline total and low-den-sity lipoprotein (LDL) cholesterol were not significantly different from those individuals who completed the study. Participants continued their usual activities throughout the experimental period. Ethical approval was obtained from Southern Regional Health Author-ity and informed consent gained from each participant.
2.2. Experimental design
The study involved a randomised double crossover trial of two dietary interventions: one high in saturated fatty acids (SAFA), the other high in polyunsaturated fatty acids (PUFA). After recruitment, participants recorded their usual diet for a 4-day period. This infor-mation was used to plan the experimental diets. They were then asked to follow a standard lipid-lowering diet (total and saturated fatty acids providing around 30 and 10% of total energy respectively) for 3 weeks (baseline diet). Thereafter they were randomised to one
of two groups following the dietary sequences, SAFA –
PUFA – SAFA – PUFA or PUFA – SAFA – PUFA –
SAFA, each dietary phase continuing for 4 weeks without washout periods. Weight was recorded and a fasting blood sample collected on two occasions, 1 day apart, during the final week of the baseline and each experimental diet. Participants were also asked to com-plete a 3-day estimated diet record of all food and drink consumed on the Thursday, Friday and Saturday pre-ceding the week during which blood samples were taken. The diet records were analysed using the ‘Diet Cruncher’ programme [19].
3. Experimental diets
Participants’ diets were individually planned on the basis of personal food preferences and usual energy requirements calculated from the 4-day diet record completed following recruitment into the study. On both the SAFA and PUFA diets, fat sources relevant to the experimental diets (butter and hardened coconut oil on SAFA and polyunsaturated margarine and safflower oil on diet PUFA) were provided free of charge and added to the relatively low fat baseline diet so that protein provided about 15% energy, carbohydrate 44% and total fat 36%, but fat composition differed. In the SAFA diet, 20% of energy came from saturated fatty acids and 3% from polyunsaturated fatty acids. In the PUFA diet, 10% of energy came from saturated fatty acids and 10% from polyunsaturated fatty acids. Mo-nounsaturated fatty acids remained constant in both diets at about 10% total energy. Exchange lists were provided to enable participants to select appropriate foods. Detailed instructions, menus, and recipes were provided and reinforced during regular interviews and telephone calls.
4. Dietary compliance
5. Laboratory analysis
Blood specimens were centrifuged at 2500×g for 15
min. Before cholesterol analysis, the plasma was spun
at 8000×gfor 4 min in a bench top Zentifuge 3200, to
remove any fibrin that had been formed on storage. HDL cholesterol was measured in the supernatant after precipitation of apolipoprotein B (apoB)-containing
lipoproteins in plasma with phosphotungstic acid/
mag-nesium chloride solution [20]. Cholesterol concentration of plasma and lipoprotein fractions were measured, using the Boehringer enzymatic colourimetric method with a Boehringer CHOD PAP enzymatic colourimetric reagents [21]. Measurement of plasma triglycerides was conducted using Roche Triglycerides PAP. Coefficient of variation was 1.3% for cholesterol and 2.6% for triglyceride measurements in the Royal Australasian College of Pathologists’ quality assurance programme. Plasma LDL cholesterol was calculated using the
Friedewald equation [22]. Apolipoprotein B and
apolipoprotein A-1 levels were measured by an im-munoturbidimetric method using Boehringer kits (co-efficient of variation 5 and 3% respectively). Plasma cholesteryl ester transfer (CET) activity was assessed by measuring the transfer of newly synthesised cholesterol esters from HDL to apoB-containing lipoproteins using an isotopic assay (coefficient of variation, 10%) [23]. Values from this assay correlate closely with cholesterol ester mass transfer measured by chemical methods [24]. An estimate of small dense LDL levels was obtained
by ultracentrifuging EDTA plasma adjusted to d=
1.040 g/ml for 48 h at 40 000 rpm in a Beckman 50.3 Ti
rotor, measuring cholesterol in the d\1.040 g/ml
plasma fraction, subtracting the sum of plasma HDL cholesterol and Lp(a) cholesterol calculated as 34% of Lp(a) mass then converting dense LDL cholesterol to lipoprotein mass using the chemical composition of dense LDL (d=1.040 – 1.054 g/ml) [25].
Plasma triglyceride fatty acid composition was deter-mined for each of the experimental periods using an adaptation of the Bligh and Dwyer method [26]. The internal standard employed was C17:0. The triglyceride fatty acids were separated using a Hewlett Packard HP5890 gas chromatograph (GC) equipped with a DB 225 megabore column and detected by flame ionisation. The following conditions were maintained during GC operation: oven temperature, 200°C; detector and
injec-tor temperature 250°C; helium gas flow 6.5 ml/min;
split ratio, 5:1. Triglyceride fatty acids were identified by matching retention times with commercial standards (Nu-Check Prep). The precision of the fatty acid analy-sis was determined by repeated analyanaly-sis of a pooled plasma sample. The coefficient of variation for triglyce-ride linoleate was 6.4%.
5.2.1. DNA preparation and analysis
DNA was extracted from frozen whole blood, col-lected after an overnight fast, by the salting out method [27]. Genotype was determined by the polymerase chain reaction (PCR) using previously published methods and amplifying oligonucleotides. Taq polymerase was ob-tained from Bethesda Research Laboratories and reac-tions were performed on a Hybaid Intelligent Heating Block. ApoCIII – C1100-T genotype was carried out by amplification and the use of allele specific oligonucle-otides [28]. ApoB signal peptide genotype was deter-mined by direct electrophoresis of the amplified fragments on a 10% acrylamide gel [29]. CETP geno-type was determined by amplifying a 535 bp fragment of intron 1 of the CETP gene by PCR followed by Taq I digestion, and separation of fragments on MADGE polyacrylamide gels [30]. Apolipoprotein E genotyping was carried out by a HhaI digestion, and primers were the same as previously described [31]. LPL HindIII genotyping was undertaken using restriction enzyme digestion and separation of the fragments on an agarose gel [32]. The LPL S447X polymorphism in exon 9 was identified by the introduction of a forced HindfI restriction enzyme site into the PCR product [33].
5.3. Statistical methods
Statistical analysis was performed using the statistical package STATA. The mean of the measurements made on the 2 consecutive days at the end of each diet period was taken as the value for that phase of the experiment.
Although the study involved a double dietary
crossover, of interest were the three measures of differ-ence in cholesterol and their association with the three corresponding measures of dietary compliance and other predictors of extent of cholesterol change. The correlations between difference in cholesterol on the SAFA and PUFA diets and the continuous variables were computed using the method described by Bland and Altman [34], to adjust for multiple observations for each person. Means for the change in cholesterol for the different genotypes were also adjusted for multiple observations using the robust standard error proce-dures provided in STATA [35]. Multiple regression analysis was used to examine the association between the change in cholesterol and the genotypes of interest after adjusting for measures of compliance and screen-ing cholesterol. Genetic polymorphisms examined in Table 5 had previously been shown to be predictive of individual cholesterol response or coded for enzymes important in lipoprotein metabolism. To be considered for inclusion in the multiple regression model, variables
analyses. Other metabolic variables for which prior hypotheses existed were also tested in multiple regres-sion analyses. The observed average difference in total cholesterol between saturated and polyunsaturated fat periods was compared with the predicted value on the basis of reported dietary change and the metaanalyses of Clarke and colleagues [36].
6. Results
Thirty two females, mean (9S.D.) age, 46 (11) years
and 23 males, 45 (8) years completed the study. Mean
(9S.D.) weight and body mass index were 69.9 (11.6)
kg and 26.6 (4.4) kg/m2 for women and 80.5 (10.5) kg
and 26.6 (2.7) kg/m2 for men. Body weight fluctuated
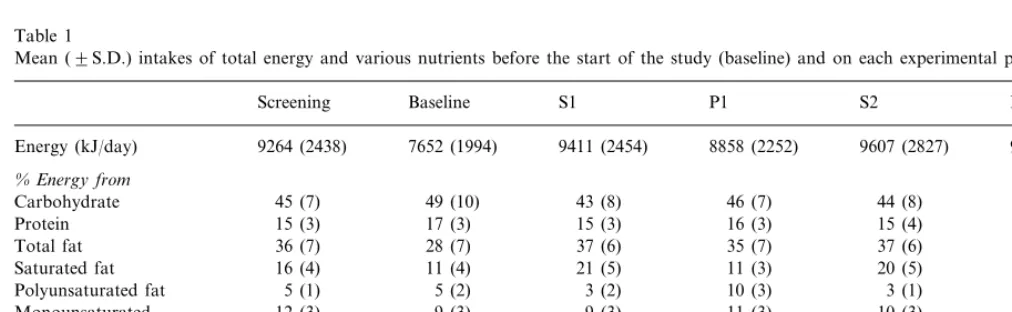
slightly but did not change significantly throughout the study period. Reported total energy intake, percentage of energy derived from macronutrients, total daily cholesterol and ratio of polyunsaturated to saturated (P:S) fatty acids are shown in Table 1. Average intakes suggest a high overall level of compliance with dietary advice; reported intakes of saturated fatty acids were
decreased to approximately half, and P:S ratio
in-creased about five-fold on the polyunsaturated com-pared with the saturated fatty acid periods. Total fat, carbohydrate and protein intakes remained fairly con-stant throughout the four experimental periods. The mole percent contribution of selected fatty acids to total triglyceride fatty acids on the different diets is shown in Table 2. Plasma triglyceride linoleate was higher on the polyunsaturated than the saturated diets and lauric, myristic and palmitic acids higher on the saturated than the polyunsaturated diets.
Table 3 summarises, for the entire study group, the levels of total, HDL and LDL cholesterol at the time of screening, before the start of the study (baseline) and on each of the experimental periods. For each individ-ual the value for a given diet is taken as the mean of the two measurements made during the final week of the dietary period. The average difference between total
cholesterol measured on the 2 days was 0.05 mmol/l.
Mean levels of total and LDL cholesterol were signifi-cantly lower on the polyunsaturated than the saturated diet periods. The observed average difference in total cholesterol on the saturated and polyunsaturated fat
Table 1
Mean (9S.D.) intakes of total energy and various nutrients before the start of the study (baseline) and on each experimental perioda
P2 S2
P1 S1
Baseline Screening
7652 (1994) 9264 (2438)
Energy (kJ/day) 9411 (2454) 8858 (2252) 9607 (2827) 9177 (2649)
%Energy from
45 (8) 44 (8)
46 (7) 43 (8)
Carbohydrate 45 (7) 49 (10)
15 (3) 17 (3) 15 (3) 15 (4) 16 (3)
Protein 16 (3)
36 (7) 28 (7) 37 (6) 37 (6) 36 (7)
Total fat 35 (7)
11 (3)* 20 (5)
11 (3) 21 (5)
Saturated fat 16 (4) 11 (4)
10 (3) 3 (1) 10 (4)**
5 (1)
Polyunsaturated fat 5 (2) 3 (2)
12 (3) 9 (3) 9 (3)
Monounsaturated 11 (3) 10 (3) 11 (2)
0.3 0.4 0.2
P:Sratio 1.1 0.2 1.0**
323 (130) 236 (109) 307 (173) 304 (113) 248
Cholesterol (mg/day) 219 (112)
(120)***
aS1, S2 and P1, P2 represent the first and second periods on high saturated and polyunsaturated fatty acid diets, respectively.
* Means significantly greater on S1 and S2 than P1 and P2,PB0.001. ** Means significantly greater on P1 and P2 than S1 and S2,PB0.001.
*** Means significantly lower on P1 than S1,PB0.001, and on P2 than S2,PB0.01.
Table 2
Mean (9S.D.) mole percentage contribution of linoleic, lauric, myristic and palmitic acids to total triglyceride fatty acids on each experimental dieta
S1 P1 S2 P2
11.01 (3.74) 18.81 (7.29)
Linoleic acid(C18:2n-6) 11.79 (4.11) 18.28 (6.39)*
0.89 (1.32)
Lauric acid (C12.0) 0.32 (0.23) 0.79 (1.01) 0.35 (0.25)**
Myristic acid (C14.0) 4.23 (2.08) 2.69 (0.96) 3.99 (1.67) 2.85 (1.06)** Palmitic acid (C16.0) 29.88 (3.38) 26.50 (4.25) 29.46 (3.61) 26.89 (3.90)**
aS1, S2 and P1, P2 represent the first and second periods of high saturated and polyunsaturated fatty acids respectively.
Table 3
Mean (9S.D.) concentrations of total, LDL and HDL cholesterol and triglycerides during the study. Values are in mmol/l
Baseline S1 P1
Screening S2 P2
Total cholesterol 6.31 (0.71) 6.05 (0.82) 6.60 (1.07) 5.94 (0.81) 6.44 (0.95) 6.08 (0.97)* 4.17 (0.76) 4.46 (0.96) 3.92 (0.75)
4.28 (0.71) 4.41 (0.90)
LDL cholesterol 4.09 (0.91)*
1.32 (0.34)
HDL cholesterol 1.18 (0.32) 1.39 (0.36) 1.34 (0.32) 1.36(0.41) 1.30 (0.29)**
1.57 (0.54) 1.63 (0.64) 1.48 (0.53)
Triglyceride 1.53 (0.56) 1.49 (0.63) 1.51 (0.66)
* Means significantly greater on S1 and S2 than P1 and P2,PB0.001.
** Baseline HDL cholesterol significantly lower than HDL cholesterol at all other times,PB0.01.
Table 4
Change in plasma lipids and lipoproteins and baseline characteristics of subjects in the cholesteryl ester transfer protein (CETP) TaqB genotypesa
CETP TaqB1B1n=17 CETP TaqB1B2+B2B2n=38 Difference (95% CI)
Change
0.74 (0.50)
TC (mmol/l) 0.40 (0.49) −0.34 (−0.05,−0.63)
LDL-C (mmol/l) 0.68 (0.56) 0.33 (0.56) −0.34 (−0.08,−0.61)
0.05 (0.24)
0.02 (0.25) 0.03 (−0.09, 0.15)
HDL-C (mmol/l)
0.05 (0.37)
TAG (mmol/l) 0.04 (0.45) −0.01 (−0.18, 0.15)
10 (8)
SAFA (% energy) 9 (6) −1 (−5, 3)
7 (4)
8 (4) −1 (−2, 2)
PUFA (% energy)
5.9 (5.7)
TAG 18:2 (mol%) 7.0 (8.2) 1.1 (−2.1, 4.2)
Baseline
CET (nmol/ml/hr) 36.7 (11.2) 34.1 (11.2) −2.6 (−9.1, 4.0)
45 (11)
Age (years) 48 (8) −3 (−9, 3)
26.9 (4.0)
26.1 (3.3) 0.7 (−1.5, 2.9)
BMI (kg/m2)
6.01 (1.04)
TC (mmol/l) 6.07 (0.71) 0.06 (−0.42, 0.54)
LDL-C (mmol/l) 4.15 (0.86) 4.18 (0.72) 0.03 (−0.42, 0.48)
1.20 (0.36)
1.13 (0.21) 0.07 (−0.12, 0.25)
HDL-C (mmol/l)
1.63 (0.66)
TAG (mmol/l) 1.55 (0.48) −0.08 (−0.40, 0.24)
Dense LDL (mg/dl) 74 (56) 64 (39) −10 (−35, 17)
aValues are mean (9S.D.) unless stated otherwise.
diets (0.57 mmol/l) is similar to the change predicted on
the basis of reported dietary change (0.59 mmol/l).
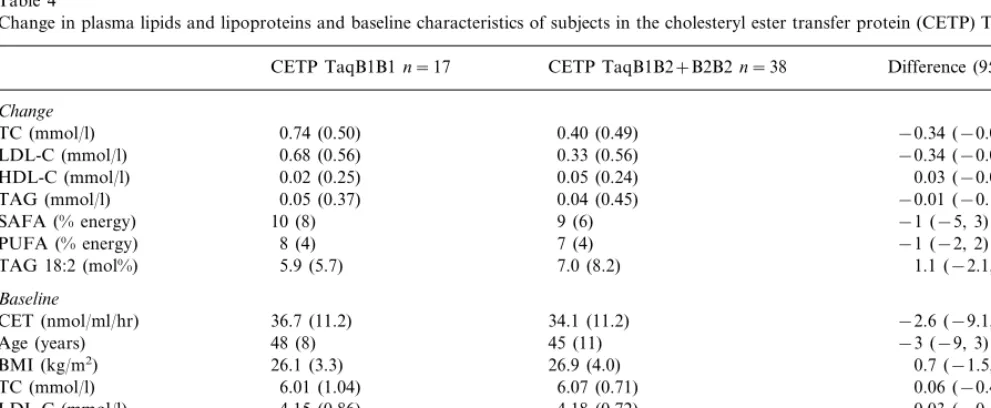
HDL cholesterol and triglyceride levels did not change significantly throughout the experimental period, but HDL cholesterol levels were significantly lower on the baseline diet than at all other times during the study. Genotype distributions were as expected according to Hardy – Weinburg equilibrium. Table 4 shows the aver-age differences in plasma lipids, lipoproteins and in-dices of dietary compliance on the three dietary cross-overs and baseline characteristics in subjects with
the CETPB1B1 and CETPB1B2+B2B2 genotypes.
Changes in plasma cholesterol and LDL cholesterol
were significantly greater in subjects with the
CETPB1B1 genotype compared with those with one or more B2 alleles. Change in indices of dietary compli-ance and baseline characteristics did not differ signifi-cantly between subjects in the CETP genotypes. Plasma CET activity tended to be higher in those with the
CEPTB1B1 genotype but not significantly so (P=
0.17). Eight of the subjects with the CEPTB1B1
geno-type also had one or more apoE4 alleles.
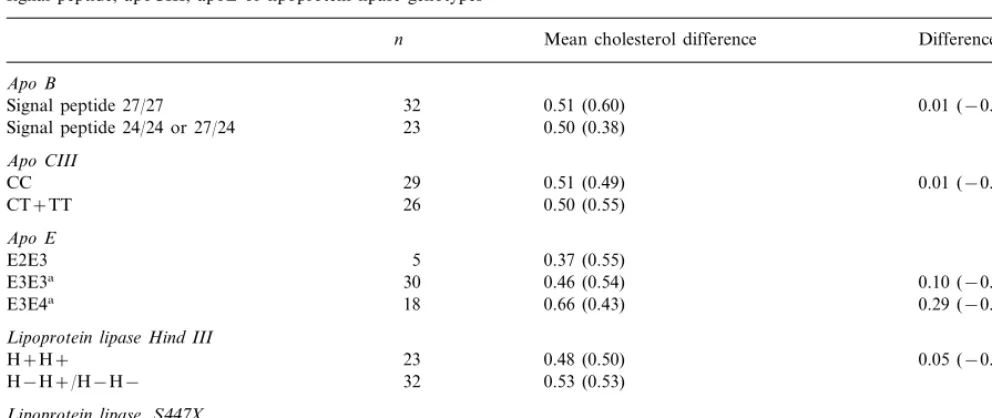
Polymorphisms of apoB signal peptide, apoCIII, apoE
or lipoprotein lipase did not significantly influence plasma cholesterol response to type of dietary fat (Table 5), though there was a trend toward greater cholesterol responses in those with apoE3E4 and
lipo-protein lipase X447+ compared with those with other
genotypes. Plasma cholesterol response to dietary change was similar in men and women.
Table 6 examines the extent to which various mea-sures of dietary compliance, baseline body mass index (BMI) and biochemical measurements predict the mag-nitude of the differences in cholesterol between diets high and low in saturated fat. Change in reported saturated and polyunsaturated fat intake, as assessed by 3-day diet records and change in plasma triglyceride linoleate, explained some individual variation in these univariate analyses. HDL cholesterol at screening was also predictive of change in plasma total cholesterol in univariate analyses.
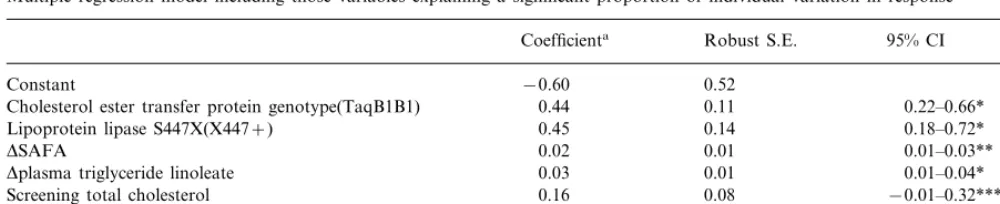
The model shown in Table 7 suggests that CETP and LPL S447X genotypes are the most powerful determi-nants of cholesterol change. Individuals with the CETP
genotype B1B1 and the LPL X447+ allele showed a
Table 5
Mean (9S.D.) difference in cholesterol between diets high and low in saturated fat on the three crossovers in individuals with different apoB signal peptide, apoCIII, apoE or lipoprotein lipase genotypes
Mean cholesterol difference Difference (95% CI) n
Apo B
0.51 (0.60)
32 0.01 (−0.25, 0.27)
Signal peptide 27/27
0.50 (0.38)
Lipoprotein lipase Hind III
0.48 (0.50)
23 0.05 (−0.23, 0.33)
H+H+
H−H+/H−H− 32 0.53 (0.53)
Lipoprotein lipase,S447X
S447S447 47 0.47 (0.51) 0.27 (−0.08, 0.63)
0.74 (0.48)
X447+ 8
aCompared to apoE2E3.
mmol/l greater change in total cholesterol respectively
than those with one or more CETP B2 allele or ho-mozygous for the LPL S447 allele when other factors were held constant. Each 1% change in total energy from SAFA resulted in an average change of 0.02
mmol/l in total cholesterol and a mole percent change
in plasma triglyceride linoleate in an average change in cholesterol of 0.03 mmol/l. Cholesterol level at the time of initial screening was also an independent predictor of response. The variables identified by the model in Table 7 accounted for just under a third of the variation in response. Similar estimates for the influence of the
CETP gene (0.40 (95% CI 0.19, 0.61) mmol/l) and LPL
haplotypes (0.35 (95% CI 0.12, 0.58) mmol/l) on
choles-terol response was obtained by regressing cholescholes-terol measurements at the end of each diet period on the corresponding cholesterol levels at the beginning of each period and including effects for treatment, dietary
SAFA and PUFA in each dietary period and
interaction.
In the last part of the analysis, a number of addi-tional variables for which prior hypotheses existed were included in the model to see whether their inclusion affected the estimates. None of these other variables (gender, dense LDL, CET activity, apo B or any other genotypes) appeared to influence change in cholesterol or the strength of the associations demonstrated in Table 7. Substitution of apolipoprotein E genotype for screening plasma cholesterol demonstrated a similar predictive power with no diminution of the effects of CETP and LPL genotypes or for reported change in dietary saturated fatty acids or for triglyceride linoleate. It is interesting to note that Apo E2E3 individuals had
a screening total cholesterol of 5.79 mmol/l (n=5), apo
E3E3 individuals, 6.26 mmol/l (n=30) and apo E4E3
individuals, 6.52 mmol/l (n=18). Finally we considered interactions between the LPL and CETP genes and
Table 6
Simple correlation between change in plasma total cholesterol and several measures of dietary compliance (change in reported intake of saturated fatty acids,DSAFA; change in reported intake of polyun-saturated fatty acids,DPUFA; change in ratio of reported intake of polyunsaturated:saturated fatty acid, DP:S; change in triglyceride linoleate), baseline BMI and metabolic variables
Potential determinants of response n r P*
Compliance measure
Dplasma triglyceride linoleate 0.07
53
Total cholesterol (screening) 0.20 0.08
HDL cholesterol 53 0.24 0.04
53
LDL cholesterol 0.11 0.22
Triglycerides 53 −0.03 0.42
0.13 0.17 55
Total cholesterol (baseline)
55
HDL cholesterol 0.12 0.19
LDL cholesterol 55 0.14 0.15
55
Triglycerides −0.17 0.11
55 0.20
Apo B 0.12
55
Dense LDL 0.13 0.18
55
Cholesterol ester tranfer protein activity −0.10 0.23
55 −0.13 0.17 BMI
Table 7
Multiple regression model including those variables explaining a significant proportion of individual variation in response
Robust S.E.
Coefficienta 95% CI
0.52
−0.60 Constant
0.11
Cholesterol ester transfer protein genotype(TaqB1B1) 0.44 0.22–0.66* 0.14
0.45 0.18–0.72*
Lipoprotein lipase S447X(X447+)
DSAFA 0.02 0.01 0.01–0.03**
0.01
0.03 0.01–0.04*
Dplasma triglyceride linoleate
0.08 −0.01–0.32***
Screening total cholesterol 0.16
R2=0.28 aThe coefficient is a measure of the change in total cholesterol for a unit change in the variable concerned.
*PB0.005. **PB0.01. ***P=0.06.
triglyceride linoleate. Although there was an interaction between LPL S447X and plasma triglyceride linoleate, this did not add significantly to the explanatory power of the model (P=0.09). The difference between the linear effects (difference between the slopes for LPL S447S447
and LPLX447+individuals) was significant (P=0.002).
The coefficients for the plasma triglyceride linoleate
terms were 0.08 (95%CI: 0.03, 0.13) for LPL X447+
individuals and 0.02 (95%CI: 0.01, 0.03) for individuals homozygous for the S447 allele. The interaction between CETP and plasma triglyceride linoleate did not add to
the explanatory power of the model (P=0.79).
7. Discussion
These data provide for the first time evidence that variation at the CETP gene is an important determinant of individual difference in cholesterol response to dietary change. This effect appeared to be independent of the nature and extent of change in dietary fat. Of the previously documented genetic determinants of variation in response, our data provide limited confirmation of the effect of apoE and LPL genes.
Variation in compliance to dietary advice did not appear to explain the difference in the magnitude of response of plasma cholesterol to change in the quality of dietary fat between subjects in the CETP genotypes. On average, compliance to the dietary regimen indicated by the diet records and plasma TG linoleate levels, appeared to be similar in those with CETPB1B1 and
CETP B2+B2B2 genotypes. In these free-living
sub-jects, adherence to the experimental diets undoubtedly varied despite considerable efforts to maintain compli-ance, and contributed to individual variation in plasma cholesterol. Any differences in compliance between the CETP genotypes not accounted for by our measures of adherence to dietary advice are unlikely to be substantial or sufficient to account for the relatively large difference in plasma cholesterol response. Also, it is difficult to
envisage a direct effect of CETP genotype on compliance to diet changes, whereas there is both theoretical and experimental support for an influence of cholesteryl ester transfer on plasma LDL cholesterol levels [37].
Presumably, the effect of the CETP gene on individual response of plasma cholesterol and LDL cholesterol to dietary fat is mediated altered rates of cholesteryl ester transfer. In subjects with the CETPB1B1 genotype, higher plasma CETP concentrations have been observed [38] but whether cholesteryl ester transfer rates are also increased is uncertain. Plasma CETP concentration does not appear to be rate-limiting for cholesteryl ester transfer when plasma triglyceride levels are below about 3 mmol/l [39]. In the present study, mean baseline plasma CET activity was 7.6% higher in those with the CETPB1B1 genotype, but not significantly so. However, in vitro measures of cholesteryl ester transfer may not adequately reflect the impact of the genotypes on cholesteryl ester transfer in vivo. Whatever the effect of the CETP genotype on cholesteryl ester transfer it did not appreciably affect baseline plasma cholesterol and LDL cholesterol levels in this study and in previous reports [38,40]. It is possible that diet-induced change in plasma CETP concentration and CET activity may be more important than baseline levels as determinants of the corresponding change in LDL cholesterol. Previous studies have reported an increase in plasma CET activity associated with a parallel increase in plasma LDL cholesterol when saturated fat replaced other types of fats in the diet [41 – 43]. It has been calculated that CETP could be directly responsible for about one-third of the increase in plasma LDL cholesterol with change in dietary fat [37]. We [4] and others [37] have reported an association between baseline plasma CET activity and change in plasma cholesterol with dietary fat. In our earlier study, baseline plasma CET activity was measured when patients were consuming their usual diet [4] whereas in the present study, the measurement was made
diet. The low fat diet was associated with low baseline plasma HDL cholesterol levels and may have perturbed the relationship between baseline plasma CET activity and diet-induced change in plasma cholesterol.
The effect of LPL genotypes on plasma cholesterol response to change in the type of dietary fat remains unclear. While response tended to be greater in subjects
with the LPL X447+ haplotype the confidence interval
of the response was wide and the numbers of those with this haplotype was small. We did not confirm our earlier finding that individuals with one or more LPL HindIII H-allele show a larger change in plasma choles-terol response to change in the nature of dietary fat [18]. This earlier finding was based on small numbers of individuals and is less reliable than the present data that contain substantially larger numbers with the LPL
HindIII H− allele. Further investigation of the effect
of the LPL S447X genotype on plasma cholesterol response to diet changes is needed.
Several other determinants of response have been identified in previous studies. The most consistent of these are high levels of plasma cholesterol and the presence of the apoE4 allele. The apoE4E4 and apo E3E4 genotypes have both been associated with greater responses than the other apoE genotypes [11 – 13]. There is some confirmation in our data from the multi-ple regression model and the univariate analysis (Table 5) for these associations, though in the latter conven-tional levels of statistical significance are not achieved. Furthermore, there is a suggestion from the model that apoE genotype may be responsible for the observed contribution of plasma cholesterol to variation in re-sponse. Individuals with the apoE2E3 genotype had the lowest cholesterol levels and the smallest cholesterol response to dietary change, whereas the apo E3E4 had the highest levels and the greatest response. Other groups have made similar observations. Studies regard-ing the potential importance of polymorphisms of apoB, apoCIII and apoAIV genes as predictors of response have produced inconsistent results [14 – 18] and our data provide no support for a role of apoB and apoCIII genes. Indeed, the multiple regression model (Table 7) suggests that only a small number of factors including alteration in the two measures of dietary change, the cholesterol level at screening, CETP and LPL genotypes, alteration in the two measures of di-etary change and the cholesterol level at screening, explain nearly a third of the variation in individual response to change in the nature of dietary fat.
Dietary manipulation intended to reduce levels of total and LDL cholesterol in this study involved two distinct dietary changes, both of which would be ex-pected to influence cholesterol levels [44], a reduction in saturated fatty acids and an increase in polyunsaturated fatty acids. Change in total saturated fatty acid intake was calculated from 3-day dietary records, since
changes in blood levels of these fatty acids are relatively small and endogenous synthesis contributes substan-tially to blood levels. Linoleic acid, an essential fatty acid, is the predominant polyunsaturated fatty acid in the western diet, and in individuals consuming such a diet, blood levels are primarily determined by dietary intake [45]. Alterations in polyunsaturated fatty acid intake were therefore monitored by means of changes in plasma triglyceride linoleate. These are relatively crude measures of monitoring change in dietary intake, but the best available in free-living subjects. The extent of both sets of changes was related to changes in plasma cholesterol. It is of interest to note here that similar correlations (Table 6) were observed when analyses were undertaken using both change in plasma triglyceride linoleate and change in polyunsaturated fatty acids from diet records, providing reassurance regarding the appropriateness of these measures of dietary change. Changes in these measures (Tables 1 and 2) and the finding that observed average difference in cholesterol on the two diets was virtually identical to the predicted difference [36] suggest that as a group these highly motivated volunteers complied closely with the required dietary changes. Ideally this study would have been carried out in a closely controlled environ-ment in a metabolic unit. However, when the findings of such a study are applied to a free-living population, dietary compliance will need to be taken into account. Our study provides information on the estimation of dietary compliance and its impact compared with ge-netic factors on plasma cholesterol response to dietary changes in highly motivated individuals. Confirmation of our findings in subjects in a more closely controlled environment is now appropriate.
Exploratory work in the multiple regression analyses suggested that there may be an interaction between LPL S447X genotype and plasma triglyceride linoleate. Individuals homozygous for the S447 allele showed very little change in plasma cholesterol regardless of the extent to which triglyceride linoleate changed. Those carrying the X447 allele showed the most marked plasma cholesterol change in association with the change in plasma triglyceride linoleate. If this finding is confirmed there may be important implications for dietary advice given to hypercholesterolemic individu-als. For individuals homozygous for the LPL S447 allele, the most important dietary advice appears to be reduction of saturated fatty acids. The source of re-placement energy may be unimportant.
difference in response between these different genotypes (about half a mmol/l), if confirmed, suggests the possi-bility that genotyping may help to identify those who are likely to be particularly responsive to dietary change and others for whom cholesterol lowering drug treatment might be introduced without a prolonged period during which cholesterol response to diet is assessed.
Acknowledgements
This work was supported by the National Heart
Foundation of New Zealand, grant 797. Steve
Humphries, Philippa Talmud and Vilmundur Gudna-son are supported by the British Heart Foundation, grant PG007 and Sheila Williams by the Health Re-search Council of New Zealand. The authors gratefully acknowledge the cooperation of participants in the study and the excellent technical and research assis-tance of Margaret Waldron, Ashley Duncan, Sylvia de Jong, Heather Walker, Louise Mainvil and Rachel Brown.
References
[1] Keys A, Anderson J, Grande F. Prediction of serum cholesterol responses of man to changes in fats in the diet. Lancet 1957;ii:957.
[2] Clifton P, Nestel P. Influence of gender, body mass index and age on response of plasma lipids to dietary fat plus cholesterol. Arterioscler Thromb 1992;12:955 – 62.
[3] Cobb M, Risch N. Low-density lipoprotein cholesterol respon-siveness to diet in normolipidemic subjects. Metabolism 1993;42:7 – 13.
[4] Cox C, Mann J, Sutherland W, Ball M. Individual variation in plasma cholesterol response to dietary saturated fat. Br Med J 1995;311:1260 – 4.
[5] Denke M, Grundy S. Individual responses to a cholesterol-low-ering diet in 50 men with moderate hypercholesterolemia. Arch Intern Med 1994;154:317 – 25.
[6] Grundy S, Vega G. Plasma cholesterol responsiveness to satu-rated fatty acids. Am J Clin Nutr 1988;47:822 – 4.
[7] Jacobs D, Anderson J, Hannan P, Keys A, Blackburn H. Variability in individual serum response to change in diet. Arte-riosclerosis 1983;3:349 – 56.
[8] Keys A, Anderson J, Grande F. Serum cholesterol in man: diet fat and intrinsic responsiveness. Metabolism 1959;19:201 – 13. [9] Keys A, Anderson J, Grande F. Serum cholesterol response to
changes in the diet. III. Differences among individuals. Metabolism 1965;14:766 – 74.
[10] Dreon D, Fernstrom H, Miller B, Krauss R. Low-density lipo-protein subclass patterns and lipolipo-protein response to a reduced-fat diet in men. FASEB J 1994;8:121 – 6.
[11] Dreon D, Fernstrom H, Miller B, Krauss R. Apolipoprotein E isoform phenotype and LDL subclass response to a reduced-fat diet. Arterioscler Thromb Vasc Biol 1995;15:105 – 11.
[12] Manttari M, Koskinen P, Ehnholm C, Huttunen J, Manninen V. Apolipoprotein E polymorphism influences the serum cholesterol response to dietary intervention. Metabolism 1991;40:217 – 21.
[13] Tikkanen M, Huttunen J, Ehnholm C, Pietinen P. Apolipo-protein E4 homozygosity predisposes to serum cholesterol eleva-tion during high fat diet. Arteriosclerosis 1990;10:285 – 8. [14] Friedlander Y, Berry EM, Eisenberg S, Stein Y, Leitersdorf E.
Plasma lipids and lipoprotein response to a dietary challenge: analysis of four candidate genes. Clin Genet 1995;47:1 – 12. [15] Ordovas JM, Civeria F, Genest J, Craig S, Robbins AH, Meade
T, Pocovi M, Frossard PM, Masharani U, Wilson PW. Restric-tion fragment length polymorphisms of the apolipoprotein A-I, C-III, A-IV gene locus: relationships with lipids, apolipoproteins and premature coronary heart disease. Atherosclerosis 1991;87:75 – 86.
[16] Jansen S, Lopez-Miranda J, Salas J, Ordovas JM, Castro P, Marin C, Ostos MA, Lopez-Segura F, Jimenez-Pereperez JA, Blanco A, Perez-Jimenez F. Effect of 347-Serine mutation in apoprotein A-IV on plasma LDL cholesterol response to dietary fat. Arterioscl Thromb Vasc Biol 1997:1532 – 1538.
[17] Ordovas JM, Lopez-Miranda J, Matta P, Perez-Jimenez F. Gene – environment interactions in lipoprotein metabolism. Nutr Metab Cardiovasc Dis 1998;8:47 – 61.
[18] Humphries S, Talmud P, Cox C, Sutherland W, Mann J. Ge-netic factors affecting the consistency and magnitude of changes in plasma cholesterol in response to dietary challenge. Q J Med 1996;89:671 – 80.
[19] Marshall R. Diet Entry and Storage. Otago, New Zealand, 1995. [20] Assmann G, Schriewer H, Schmitz G, Hagele E. Quantification of high-density-lipoprotein cholesterol by precipitation with phosphotungistic acid/MgCl2. Clin Chem 1983;29:2026 – 30.
[21] Siedel J, Hagele E, Ziefenhorn J, Wahlefeld A. Reagent for the enzymatic determination of serum total cholesterol with im-proved lipolytic efficiency. Clin Chem 1983;29:1075 – 80. [22] Friedewald W, Levy R, Fredrickson D. Estimation of
low-den-sity lipoprotein cholesterol in plasma, without use of the prepar-ative ultracentrifuge. Clin Chem 1972;18:499 – 502.
[23] Channon KM, Clegg RJ, Bhamagar D, Ishola M, Arrol S, Durrington PN. Investigation of lipid transfer in human serum leading to the development of an isotopic method for determina-tion of endogenous cholesterol esterficadetermina-tion and transfer. Atherosclerosis 1990;80:217 – 26.
[24] Sutherland WH, Walker RJ, Lewis-Barned NJ, Pratt H, Pratt HC, Tillman HC. Plasma cholesteryl ester transfer in patients with non-insulin dependent diabetes mellitus. Clin Chem Acta 1994;231:29 – 38.
[25] Tribble DL, Thiel PM, van der Berg JJM, Krauss RM. Differing alpha-tocopherol oxidative liability and ascorbic acid sparing affects in buoyant and dense LDL. Arterioscler Thromb Vasc Biol 1995;15:2025 – 31.
[26] Bligh EG, Dwyer WJ. A rapid method of total lipid extraction and purification. Can J Biochem Physiol 1959;37:911 – 7. [27] Miller SA, Dykes DD, Polesky HF. A simple salting out
proce-dure for extracting DNA from human nucleated cells. Nucleic Acid Res 1989;16:1215.
[28] Xu C-F, Talmud P, Schuster H, Houlston R, Miller G, Humphries SE. The association between genetic variation at the apo A1-CIII-AIV gene cluster and familial combined hyperlipi-daemia. Clin Gen 1994;46:385 – 97.
[29] Peacock R, Dunning A, Hamsten A, Tornvall P, Humphries SE, Talmud P. Apolipoprotein B gene polymorphisms, lipoproteins and coronary atherosclerosis: a study of young myocardial sur-vivors and healthy population-based individuals. Atherosclerosis 1992;92:151 – 62.
[31] Bolla MK, Humphries SE, Winder AF, Day INM. A method for the rapid determination of hundreds of apo E genotypes, combining simplified, optimised protocols from sample acquisi-tion to PCR and restricacquisi-tion digesacquisi-tion analysis by microplate array diagonal gel electrophoresis (MADGE). Clin Chem 1995;41:1599 – 604.
[32] Peacock RE, Hamsten A, Nilsson-Ehle P, Humphries SE. Asso-ciations between lipoprotein lipase gene polymorphisms and plasma correlations of lipids, lipoproteins and lipase activities in young myocardial survivors and age-matched healthy individuals from Sweden. Atherosclerosis 1992;97:171 – 85.
[33] Humphries SE, Nicaud V, Margalef J, Tiret L, Talmud PJ. Lipoprotein lipase gene variations is associated with paternal history of premature coronary heart disease and fasting and postpriandial plasma triglycerides: European Atherosclerosis Re-search Study. Arterioscler Thromb Vasc Biol 1998;18:526 – 34. [34] Bland JM, Altman DG. Calculating correlation coefficients with
repeated observations: part 2 — correlations between subjects. Br Med J 1995;510:633.
[35] STATA statistical software, release 5.0. 1997.
[36] Clarke R, Frost C, Collins R, Appleby P, Peto R. Dietary lipids and blood cholesterol: quantitative meta-analysis of metabolic ward studies. Br Med J 1997;314:112 – 7.
[37] Fielding CJ. Response of low-density lipoprotein cholesterol levels to dietary change: contributions of different mechanisms. Curr Opin Lipidol 1997;8:39 – 42.
[38] Fumeron F, Betoulle D, Luc G, et al. Alcohol intake modulates the effect of a polymorphism of the cholesterol ester transfer protein gene on plasma high density lipoprotein and risk of myocardial infarction. J Clin Invest 1995;96:1664 – 71.
[39] Mann CJ, Yen FT, Grant AM, Bihain BE. Mechanism of plasma cholesteryl ester transfer in hypertriglyceridemia. J Clin Invest 1991;88:2059 – 66.
[40] Kuivenhoven JA, de Knijff P, Boer JMA, Smalheer HA, Botma G-J, Siedell JC, Kastelein JJP, Pritchard PH. Heterogeneity at the CETP gene locus. Influence on plasma CETP concentrations and HDL cholesterol levels. Arterioscler Thromb Vasc Biol 1997;17:560 – 8.
[41] Cox C, Mann J, Sutherland W, Chisholm A, Skeaff M. Effects of coconut oil, butter and safflower oil in persons with moder-ately elevated cholesterol levels. J Lipid Res 1995;36:1787 – 95. [42] Groener JEM, van Ramshorst EM, Katan MB, Mensink RP,
van Tol A. Diet-induced alteration in the activity of plasma lipid transfer protein in normolipidemic human subjects. Atheroscle-rosis 1991;87:221 – 6.
[43] Schwab US, Maliranta HM, Sarkkinen ES, Savolainen KJ, Kesaniemi YA, Ussitupa MIJ. Different effects of palmitic and stearic acid enriched diets on serum lipids and lipoproteins and cholesteryl ester transfer. Metabolism 1996;45:143 – 9.
[44] Grundy SM, Denke MA. Dietary influences on serum lipids and lipoproteins. J Lipid Res 1990;31:1149 – 72.
[45] Moore RA, Oppert S, Eaton P, Mann JI. Triglyceride fatty acids confirm a change in dietary fat. Clin Endocrinol 1977;7:143 – 9.