www.elsevier.nlrlocateraqua-online
Fat deposition and flesh quality in seawater reared,
ž
/
triploid brown trout Salmo trutta as affected by
dietary fat levels and starvation
C. Regost
a, J. Arzel
a,), M. Cardinal
b, M. Laroche
c, S.J. Kaushik
da
Fish Nutrition Laboratory, Unite mixte INRA-IFREMER, Centre de Brest IFREMER,´
29280 Plouzane, France´
b
VPrGA, IFREMER, 44000 Nantes, France
c
LEIMA, INRA, 44316 Nantes, France
d
Fish Nutrition Laboratory, Unite mixte INRA-IFREMER, 64310 Saint Pee-sur-Ni´ ´ Õelle, France
Received 3 April 2000; received in revised form 14 August 2000; accepted 14 August 2000
Abstract
Ž . Ž
Three isoproteic crude protein content: 56% diets with different fat levels 11%, 20%, and
. Ž .
26% were fed to triplicate groups of triploid brown trout initial average body weight of 1.5 kg ,
Ž .
reared in seawater. At the end of 3 months of feeding, fish fed the high-fat HF diet were split into two groups: a triplicate group of fish received the low-fat diet and another triplicate group was kept unfed for a further 2-month period. Fish initially fed the low-fat diet during the first
Ž .
period were continued to be fed the same diet. Fish fed the medium-fat MF diet during period 1 were eliminated for period 2. At the end of each period, comparative whole body analyses,
Ž .
sensory and instrumental texture and colour analyses were made on fresh and smoked fillets. During the first period, increasing dietary fat level had no significant effect on growth or feed
Ž . Ž
utilisation, but increased whole body 14.6% to 17.9%, on wet weight basis and muscle 8.3% to
.
11.0% fat content. During the second period, the fish fed the low-fat diet had similar growth performance irrespective of previous nutritional history, whereas starvation led to significant loss
Ž .
of weight and fillet yield. Whole body fat content did not differ between groups around 15% at the end of period 2. In fish initially fed the HF diet, both starvation and feeding a low-fat diet led to a reduction in muscle lipid content. Sensory analyses revealed few differences between
)Corresponding author. Tel.:q33-2-98-22-43-85; fax:q33-2-98-22-46-53.
Ž .
E-mail address: [email protected] J. Arzel .
0044-8486r01r$ - see front matterq2001 Elsevier Science B.V. All rights reserved. Ž .
treatments, in terms of visual colour aspects, for both cooked and smoked fillets at the end of
Ž ) ) ) .
period 1. A positive relationship between instrumental colour analyses L , a , b values and dietary fat levels was observed, but no difference was observed for instrumental texture measure-ments. At the end of period 2, a significant increase in parameters of colour was observed in unfed fish. Although both feed withdrawal and feeding a low-fat diet 2 months before slaughtering led to a reduction in fat content, starvation had the disadvantage of leading to significant weight loss.
q2001 Elsevier Science B.V. All rights reserved.
Keywords: Salmo trutta; Dietary fat; Starvation; Fat deposition; Sensory analyses; Colour; Texture
1. Introduction
Ž .
Since the early findings of Lee and Putnam 1973 on the beneficial effects of dietary fat in protein sparing in salmonids, it has become a common practice to use high-fat
Ž .
diets Hillestad et al., 1998 . There is evidence that high dietary lipid levels increase fat deposition in fish and alter flesh quality in terms of freshness, storage stability,
Ž
processing yields and organoleptic and physical properties Sheehan et al., 1996;
.
Gjedrem, 1997; Einen and Skrede, 1998 . According to species and age, fat depots can
Ž .
be located in different tissues or organs Corraze and Kaushik, 1999 and affect flesh quality variably. In salmonids, lipids located in the visceral cavity lead to decreased slaughter yield and the part of fat accumulated in muscle may modify flesh quality
ŽFauconneau et al., 1993 . Studies with other salmonids have shown that nutritional.
Ž
factors such as dietary fat sources Thomassen and Røsjø, 1989; Greene and
Seliv-. Ž
onchick, 1990 , fat levels Hillestad and Johnsen, 1994; Bjerkeng et al., 1997; Hemre
. Ž .
and Sandnes, 1999 , or vitamin E Boggio et al., 1985 can influence physical and
Ž
organoleptic quality. Since starvation is known to induce fat mobilisation Jezierska et
.
al., 1982; Takeuchi and Watanabe, 1982 , in recent years, farmed salmon are occasion-ally starved prior to slaughter in order to stimulate lipid catabolism and mobilisation and
Ž
thus improve flesh quality Blokhus, 1986; Lie and Huse, 1992; Bonnet et al., 1996;
.
Einen et al., 1998 .
Seafarmed brown trout are of commercial interest in France. Earlier studies have
Ž . Ž
evaluated the effects of growth rates Bauvineau et al., 1993 and of dietary lipids Arzel
.
et al., 1994 on flesh quality. Post-mortem changes in flesh quality of brown trout have
Ž .
also been studied to some extent Bonnet et al., 1996; Laroche et al., 1996a,b . An increase in dietary lipid levels are known to improve protein utilisation in brown
Ž . Ž
trout Gabaudan et al., 1989; Arzel et al., 1994 as in many other fish Lee and Putnam,
.
1973; Alliot et al., 1979; Cho and Kaushik, 1990 . Lipid-rich diets are also known to
Ž
depress the activities of enzymes involved in lipid synthesis in coho salmon Lin et al.,
. Ž . Ž .
1977b , Atlantic salmon Arnesen et al., 1993 , rainbow trout Alvarez et al., 1998 and
Ž .
seabass Dias et al., 1998 .
Ž .
The aims of this study were to evaluate 1 the effects of different dietary fat levels
Ž . Ž .
2. Materials and methods
2.1. Experimental diets
Ž .
Three isoproteic diets crude protein: 56% of dry matter were formulated containing graded levels of fish oil to obtain total crude fat levels of 11%, 20%, and 26%. Mineral
Ž
and vitamin mixes were added to meet the requirements of marine fish Kaushik and
. Ž .
Cuzon, 1999 . Based on formulations provided, extruded diets 9-mm diameter were
Ž
manufactured by a commercial feed company Le Gouessant Aquaculture, 29 Lamballe,
.
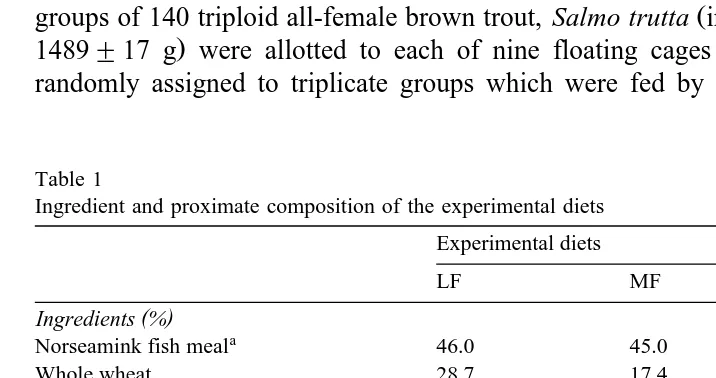
France . Ingredient and chemical composition of the diets are reported in Table 1.
2.2. Growth study
The growth trials were conducted during December 1997 to May 1998 in our
Ž .
experimental sea cage-culture facility SEMII, 29 Camaret sur Mer, France . Triplicate
Ž
groups of 140 triploid all-female brown trout, Salmo trutta initial average body weight:
. 3
1489"17 g were allotted to each of nine floating cages of 60 m . Each diet was randomly assigned to triplicate groups which were fed by hand three times a day to
Table 1
Ingredient and proximate composition of the experimental diets Experimental diets
LF MF HF
( ) Ingredients %
a
Norseamink fish meal 46.0 45.0 45.0
Whole wheat 28.7 17.4 8.5
Wheat gluten 17.9 20.7 21.7
Fish oil 6.6 16.1 24.0
b
Mineral and vitamin premix 0.5 0.5 0.5
Choline chloride 0.2 0.2 0.2
c
Funginib 2A 0.1 0.1 0.1
d
Rovimix stay C 0.04 0.04 0.04
Chemical composition
Crude protein % DM 56.5 55.3 56.2
Ž .
Energy kJrg DM 21.3 23.2 23.8
a
Norseamink, Norsildmel, Minde, Norway.
b
Mineral mixture in kg of diet: KCl, 90; KI, 0.04; CaHPO4P2H O, 500; NaCl, 40; CuSO2 4P5H O, 3;2
ZnSO4PH O, 4; CoSO2 4P7H O, 0.02; FeSO2 4P7H O, 20; MnSO2 4PH O, 3; CaCO , 215; MgCO , 124; NaF, 1.2 3 3
Vitamin mixture in mg or UIrkg of diet: retinyl acetate, 10000 UI; cholecalciferol, 1000 UI; all-rac-a -tocopheryl acetate, 40; menadione sodium bisulfide, 1; thiamin, 10; riboflavin, 25;D-calcium pantothenate, 50; pyridoxine, 10; vitamin B , 0.06; niacin, 100; folic acide, 5; biotin, 1; myo-inositol, 1000.12
c
Antifungal agent.
d
visual satiety and the feed amount distributed was recorded. Water temperature was
recorded each day at a depth of 2 m and varied between 98C and 128C, while salinity
remained constant at 35‰. Each treatment group was weighed every 3 weeks to follow growth and feed utilisation. At the end of an initial growth period lasting 12 weeks, fish fed the HF diet were split into two groups of 60 fish: a triplicate group of fish received
Ž X.
the low-fat diet LF and the other triplicate group was kept unfed for a further
Ž . Ž .
pre-harvest period of 8 weeks period 2 . Fish initially fed the low-fat LF diet during the first period were continued to be fed with the same diet but the number of fish was
Ž .
reduced to 60 fish per cage. Fish fed the medium-fat MF diet during period 1 were eliminated for period 2.
2.3. Samplings
At the beginning of the growth study, a representative sample of 14 fish from an
initial pool was withdrawn and stored at y208C for analyses of whole body
composi-tion. At the end of each period, the same protocol of slaughter was strictly followed for each group. Fish were fasted for 2 days before slaughter. Thirteen fish from each cage were stunned with a thick round rod on the head, bled in cold seawater with ice and covered with ice before dissection. Gutting and filleting were realised within 30 min to 1 h after slaughter when fish were still in a pre-rigor state. Five whole fish per cage were
Ž .
sampled for whole body composition analyses water, ash, protein, fat and energy and nutrient retention calculation. Eight fish per cage were withdrawn to weigh the liver and
Ž . Ž .
the digestive tract including visceral fat for calculating hepatosomatic index HSI and
Ž .
viscerosomatic index VSI and for the following analyses: three fish for sensory
Ž .
analyses left fillet smoked and right fillet cooked , three fish for instrumental analyses
Ž .
of texture and colour left fillet cooked and right fillet raw , and finally, two fish were
Ž .
withdrawn for lipid analyses in muscle left whole fillet . On six fish from each treatment group, liver and viscera were analysed for total lipids and hepatic activities of
Ž .
glucose-6-phosphate dehydrogenase G6PD, EC 1.1.1.49 and fatty acid synthetase
ŽFAS, EC 2.3.1.38 . Whole muscles and organs for lipid analyses were frozen in liquid.
nitrogen and stored aty808C.
Ž .
Immediately upon capture and stunning, blood samples 2 ml were withdrawn by cardiac puncture from 13 fish per replicate cage using heparinised syringes. After
Ž .
centrifugation 1200=g, 10 min, 58C , plasma was separated and stored frozen at
y208C as separate aliquots for analyses of triglyceride and total cholesterol
concentra-tions.
2.4. Analytical methods
Proximate composition of diets and chemical composition of whole body and tissues
Ž .
were determined by the following standard procedures AOAC, 1984 : dry matter after
Ž . Ž
desiccation in an oven 1058C for 24 h , ash combustion incineration at 5508C for 12
. Ž .
h , crude protein Dumas, nitrogen analyser, Fisons instrument, N=6.25 , crude fat
Ždichloromethane extraction by Soxhlet’s method and gross energy IKA adiabatic. Ž
.
Ž
concentrations were determined using commercial kits Boehringer no. 1442341,
.
Mannheim, Germany and bioMerieux no. PAP150, France, respectively . For lipid
´
Ž .
analyses of tissues, extraction was done according to Folch et al. 1957 , chloroform
Ž .
being replaced by dichloromethane Chen et al., 1981 .
For assays of hepatic lipogenic enzyme activities, liver samples were homogenised in
Ž
three volumes of ice-cold buffer 0.02-M Tris–HCl, 0.25-M sucrose, 2-mM EDTA,
0.1-M sodium fluoride, 0.5-mM phenylmethylsulphonylfluoride, 0.01-M b
-mercapto-.
ethanol, pH 7.4 and the homogenates were centrifuged at 20 000=g at 48C for 20 min.
Soluble protein content of liver homogenates was determined by the method of Bradford
Ž1976 using bovine serum albumin as the standard. Enzyme activities were assayed on.
Ž .
supernatant fractions according to Bautista et al. 1988 for the G6DP and according to
Ž . Ž .
Hsu et al. 1969 for FAS. Enzyme activity units IU defined as micromol substrate
Ž .
converted to product per minute at assay temperature 308C , were expressed either per
Ž .
milligram hepatic soluble protein or per gram liver tissue wet weight .
2.5. Flesh quality eÕaluation
Ž .
Sensory profiling Stone et al., 1974; ISO 11035 was performed on cooked and
Ž .
smoked fillets by a trained internal sensory panel IFREMER, Nantes, France consist-ing of 20 individuals selected for their interest, availability, and sensorial capacities of memorising stimuli or discriminating intensities. All were volunteers and received regular training sessions to develop their sensory performances and knowledge of marine products. Sessions were conducted in an air-conditioned room designed for
Ž .
sensory analysis divided into 10 individual boxes with standardised light Ts6500 K
Ž .
and equipped with a computerised system Fizz, Biosystemes, Dijon . These conditions
`
were conducive to concentration and avoided communication between assessors and
Ž . Ž
disturbance by external factors AFNOR, 1995 . The raw samples coming from the
. Ž
middle part of fillet were cooked for 2.5 min in a microwave oven Panasonic NN8550,
. Ž
850 W in closed bowl before analyses and the smoked fillets traditional smoking:
.
salting during 3.5 h at 108C, drying during 2 h at 208C and smoking during 6 h at 208C
were sliced and kept at ambient temperature. Products were assigned three-digit numbers, randomised and served simultaneously. The samples were evaluated using a
Ž . Ž
continuous scale presented on a computer screen from 0 low intensity to 10 high
.
intensity for the following attributes: intensity and salmonid odour, pink colour, visual compact aspect, salty flavour, intensity of flavour, firmness, smooth, fat and damp
Žimpression of moisture texture and exudation corresponding to a loss of water for. Ž .
cooked fillet and smoky and salmonid odour, pink and orange colour, colour homogene-ity, salty flavour, salty and smoky aftertaste, firmness and fat texture for smoked fillet
Žsee Tables 6 and 7 . The odour attributes were assessed immediately after opening the.
bowl, while flavour and texture in mouth were evaluated after cutting the samples. The data were immediately transferred by the network to a central computer for statistical processing.
Instrumental colour and texture analyses were performed 7 days after slaughter on fillets kept in ice in vacuum sealed packing after threading and were done on raw and
Ž .
Ž .
Kramer shear press 64=64 mm was used with compression up to breaking using a
Ž .
universal testing machine INSTRON, model 4501 with a load cell of 5 kN and during
this test at constant speed of 1 mmrs into the fillets. Samples were taken from the
Ž .
anterior part of flesh corresponding approximately to the part used in sensory analyses and measured 64-mm long and fillet size in width. For each sample, the weight was recorded to calculate the specific resistance expressed as maximal force divided by
Ž .
sample weight Szczesniack et al., 1970 . Instrumental colour analysis of fillets was
made with a Dr. Lange colorimeter using light source D65 and 108-observer angle.
Measures were made on the internal part of raw fillet and on cooked minced flesh. Data
were expressed in L)a)b) system, representing lightness, redness, and yellowness,
Ž .
respectively, as recommended by CIE 1976 . The instrumental analyses were performed
Ž .
according to the procedures described by Laroche et al. 1996b .
2.6. Statistical analysis
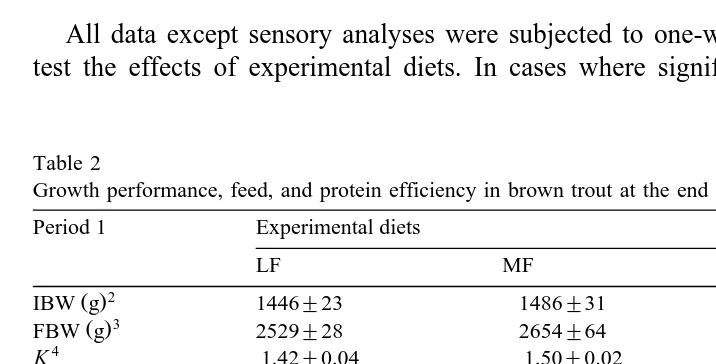
All data except sensory analyses were subjected to one-way analysis of variance to test the effects of experimental diets. In cases where significant differences occurred
Table 2
Growth performance, feed, and protein efficiency in brown trout at the end of the two growth periods1 Period 1 Experimental diets
Values are means"standard deviations ns3 . Values in the same row with different superscripts are
Ž .
significantly different P-0.05 .
1
Period 1 corresponds to an initial duration of 12 weeks during which fish were fed different dietary fat levels. Period 2 corresponds to another 8 weeks during which fish fed the HF diet were subsequently either kept unfed or fed the LF diet.
2
SGR, specific growth rates100 ln FBWyln IBWrdays .
6 Ž .
FE, feed efficiencys100 wet weight gainrdry feed intake .
7 Ž .
Žsignificance level-0.05 , the means were compared using Student Newman–Keuls.
Ž .
test. The statistical tests were performed using the STAT-ITCF ITCF, 1988 software. The results of sensory analyses were subjected to two-way analysis of variance to test the effects of experimental diets and assessors. In cases where significant differences
occurred, the means were compared using Duncan test with the FIZZ, Biosystemes
`
software.
3. Results
3.1. Growth performance and whole body composition
Ž .
During the first 3 months period 1 , growth performance were high for all fish with
Ž .
no differences between the groups Table 2 . A slight but not significant increase in growth rate was observed with increased dietary fat levels. No significant differences
Ž . Ž .
were found among treatments for condition factor K , feed efficiency FE , and protein
Ž .
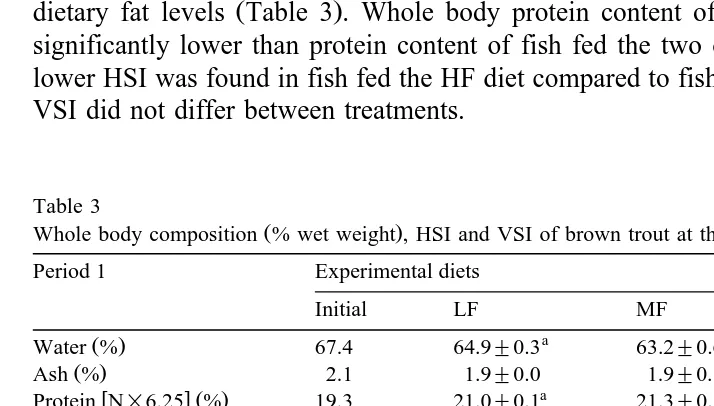
efficiency ratio PER . Concerning whole body composition of fish fed during period 1, higher contents of dry matter, fat, and gross energy were observed in fish fed higher
Ž .
dietary fat levels Table 3 . Whole body protein content of fish fed the HF diet was significantly lower than protein content of fish fed the two other diets. A significantly lower HSI was found in fish fed the HF diet compared to fish fed LF and MF diets. The VSI did not differ between treatments.
Table 3
Ž . 1
Whole body composition % wet weight , HSI and VSI of brown trout at the end of the two growth periods
Period 1 Experimental diets
Values are means"standard deviations ns3 . Values in the same row with different superscripts are
Ž .
significantly different P-0.05 .
1
Ž
During period 2, the growth performance was similar for the two groups LF and
X. Ž .
LF fed the low-fat diet Table 2 , whereas fish kept unfed lost weight and their
Ž .
condition factor decreased significantly P-0.05 . FE and PER were not different
ŽP)0.05 between the two groups of fed fish. At the end of period 2, dry matter, ash,.
Ž .
fat and gross energy content were not affected by treatments Table 3 . A significant
ŽP-0.05 decrease of protein content of whole fish was observed in unfed fish. Fat.
content of whole fish in period 2 was lower than fat content in period 1. Starvation led to a decrease in HSI in comparison to those of fed fish.
3.2. Nutrient utilisation
Ž .
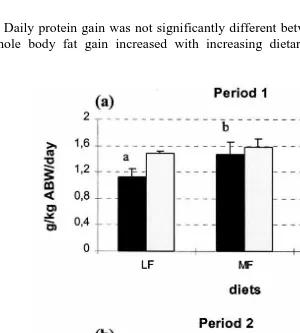
Daily protein gain was not significantly different between treatments Fig. 1a . Daily whole body fat gain increased with increasing dietary fat levels. During period 2,
Ž .
Fig. 1. Daily protein and fat gain in brown trout. Error bars are standard deviations ns3 . Different
Ž . Ž .
Ž . X
significant body protein and fat loss occurred in unfed fish Fig. 1b . For fish of LF
Ž .
groups transferred from a HF diet to a low-fat diet , daily protein gain was similar to the LF group and daily fat gain was just below zero and significantly different from LF and unfed groups.
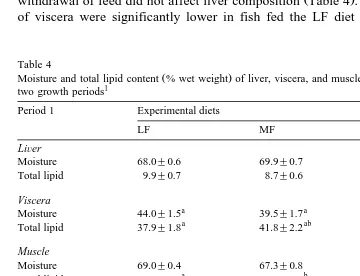
3.3. LiÕer,Õiscera, and muscle composition
In period 1, liver moisture and fat contents were not significantly affected by dietary
Ž . Ž
fat levels Table 4 . Hepatic fat content varied between 8.7% and 9.9% in wet weight
.
basis . Visceral fat content varied between 38% and 47% and fish fed the HF diet had a
Ž .
significantly P-0.05 higher fat deposition. In period 1, muscle fat content increased
and varied between 8.3% and 11.0% and the values of fish fed the LF diet were significantly different from those of fish fed the diets MF and HF. During period 2,
Ž .
withdrawal of feed did not affect liver composition Table 4 . Dry matter and fat content of viscera were significantly lower in fish fed the LF diet than unfed fish or in fish
Table 4
Ž .
Moisture and total lipid content % wet weight of liver, viscera, and muscle in brown trout at the end of the two growth periods1
Period 1 Experimental diets
LF MF HF
LiÕer
Moisture 68.0"0.6 69.9"0.7 68.8"0.5
Total lipid 9.9"0.7 8.7"0.6 8.8"0.7
Viscera
a a b
Moisture 44.0"1.5 39.5"1.7 32.6"2.8
a ab b
Total lipid 37.9"1.8 41.8"2.2 47.2"1.8
Muscle
Moisture 69.0"0.4 67.3"0.8 67.5"0.5
a b b
Total lipid 8.3"0.3 10.4"0.8 11.0"0.6
X
Ž . Ž .
Period 2 LF Unfed HF LF HF
LiÕer
Moisture 71.7"0.7 72.5"0.7 71.4"0.8
Total lipid 6.2"0.6 6.3"0.5 6.3"0.7
Viscera
a b b
Moisture 45.3"2.5 33.1"2.1 36.3"1.9
a b b
Total lipid 38.2"3.3 50.4"2.7 47.9"1.5
Muscle
a b a
Moisture 67.9"0.4 69.4"0.3 67.5"0.7
Total lipid 8.8"0.4 8.5"0.5 9.4"0.8
Ž .
Values are means"standard deviations ns6 . Values in the same row with different superscripts are
Ž .
significantly different P-0.05 .
1
Ž .
previously fed the HF diet P-0.05 . Although moisture content of muscle increased in
unfed fish, this had no significant effect on fat content.
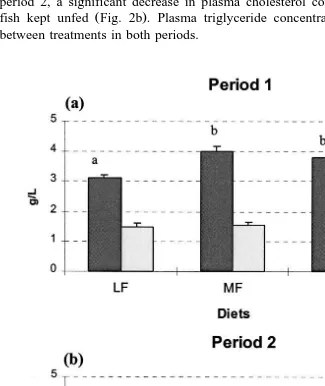
3.4. Plasma cholesterol and triglycerides
At the end of the first period, plasma cholesterol concentrations increased with
Ž .
increasing dietary fat levels and were higher in fish fed diets MF and HF Fig. 2a . In period 2, a significant decrease in plasma cholesterol concentration was observed for
Ž .
fish kept unfed Fig. 2b . Plasma triglyceride concentrations showed no differences between treatments in both periods.
Fig. 2. Plasma total cholesterol and triglyceride concentrations of brown trout. Error bars are standard
Ž . Ž .
Table 5
Activities of G6PD and FAS in the liver of brown trout at the end of the two growth periods1
Period 1 Experimental diets
LF MF HF
G6PD
a b b
IUrg liver 23.54"1.69 17.43"0.88 18.65"0.68
a b b
IUrmg protein 0.50"0.04 0.39"0.02 0.37"0.01
FAS
mIUrg liver 3.19"0.14 3.01"0.53 2.69"0.32
mIUrmg protein 0.08"0.01 0.07"0.01 0.06"0.01
X
Ž . Ž .
Period 2 LF Unfed HF LF HF
G6PD
a b a
IUrg liver 19.28"3.71 7.56"0.57 15.21"1.60
a b a
IUrmg protein 0.33"0.06 0.17"0.01 0.33"0.03
FAS
a b a
mIUrg liver 2.33"0.17 0.54"0.17 2.23"0.18
a b a
mIUrmg protein 0.04"0.01 0.01"0.00 0.04"0.01
Ž .
Values are means"standard deviations ns6 . Values in the same row with different superscripts are
Ž .
significantly different P-0.05 .
1
See footnote 1 of Table 2 for description of periods.
3.5. ActiÕities of lipogenic enzymes
At the end of period 1, the activity of hepatic G6PD in fish fed the low-fat diet was
Ž .
significantly lower than those of fish fed MF and HF diets Table 5 . Hepatic FAS activities were low and showed a similar trend although without significant differences. At the end of period 2, both enzyme activities were found to be significantly lower
ŽP-0.05 in unfed fish as compared to fed fish..
3.6. Gutted and fillet yields
Ž .
During period 1, there was no significant effect P)0.05 of dietary fat levels on
Ž .
gutted and fillet yield Fig. 3 . At the end of period 2, gutted yield did not differ between
Ž . Ž .
treatments Fig. 3a . Fillet yield of unfed fish was significantly lower P-0.05 than
Ž .
the two groups of fish fed the LF diet Fig. 3b .
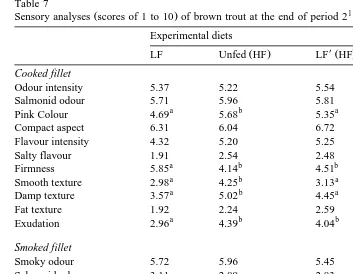
3.7. Sensory analyses
Ž .
w xŽ . w
Fig. 3. Gutted gutted yieldsgutted carcass weightrfish weight a and fillet fillet yieldsfillet weightrgutted
xŽ . Ž .
fish weight b yields in brown trout. Error bars are standard deviations ns9 . Different superscripts are
Ž .
significantly different P-0.05 .
observed for cooked fillets. Only compactness was significantly different, fillets from fish fed the HF diet presenting the lowest value. At the end of period 1, salty flavour and salty aftertaste in smoked fillets of fish fed the low-fat diet seemed to be significantly
Ž .
higher than in the other groups P-0.05 . At the end of period 2, cooked fillets from
unfed fish versus fed fish were significantly different in terms of colour and texture in
Ž .
mouth Table 7 . Intensity of red colour was more pronounced and fillets appeared more smooth and damp in unfed group. Cooked fillets from fish fed the low-fat diet during the
Ž .
whole trial had a firmer texture and a lower exudation than the other groups P-0.05 .
Table 6
Ž . 1
Sensory analyses scores of 1 to 10 of brown trout at the end of period 1
Ž .
Experimental diets ANOVA p
LF MF HF
Cooked fillet
Odour intensity 4.68 5.43 5.79 0.066
Salmonid odour 4.86 5.41 5.17 0.62
Pink colour 5.39 5.31 5.62 0.78
a a b
Compact aspect 6.52 6.61 5.94 0.023
Flavour intensity 5.08 5.31 4.68 0.27
Salty flavour 3.22 3.42 3.24 0.84
Firmness 5.18 4.51 4.54 0.20
Smooth texture 4.04 4.32 4.24 0.83
Damp texture 4.36 4.46 4.06 0.75
Fat texture 2.94 2.92 2.81 0.94
Exudation 3.97 3.94 4.26 0.74
Smoked fillet
Smoky odour 5.97 6.08 5.67 0.73
Salmonid odour 2.40 2.30 2.13 0.76
Pink colour 1.45 1.42 1.53 0.87
Orange colour 6.72 6.73 6.32 0.28
Colour homogeneity 6.21 6.91 6.60 0.067
a b b
Salty flavour 4.40 3.84 3.39 0.022
a b b
Salty aftertaste 3.74 2.90 2.99 0.015
Smoky aftertaste 4.75 4.33 4.62 0.59
Firmness 3.51 3.67 3.44 0.90
Fat texture 3.68 3.38 4.18 0.12
Values in the same row with different superscripts are significantly different.
1
See footnote 1 of Table 2 for description of periods.
3.8. Instrumental colour analysis
Ž ) )
After period 1, higher values for all parameters of colour L slightness, a s
) .
redness, and b syellowness were observed in fish fed MF and HF diets particularly
Ž . ) Ž .
in uncooked fillets Table 8 . On cooked fillets, only C saturation values presented a
significant difference between treatments. Starvation induced an intensification of
colour. Values of C), a), and b) were significantly higher in unfed fish than the
Ž .
others in both raw and cooked fillets P-0.05 . In fish fed the low-fat diet only in
Ž X. ) )
period 2 group LF , the values of L and a of raw fillets were significantly different
from those of fish fed the LF diet during the whole study. Instrumental colour analysis
Ž X.
did not show any differences between cooked fillets from the two groups LF and LF fed the low-fat diet during the finishing period.
3.9. Instrumental texture analyses
No significant effects of dietary fat levels were observed for any of the parameters of
Ž .
Table 7
Ž . 1
Sensory analyses scores of 1 to 10 of brown trout at the end of period 2
Ž .
Experimental diets ANOVA p
X
Ž . Ž .
LF Unfed HF LF HF
Cooked fillet
Odour intensity 5.37 5.22 5.54 0.77
Salmonid odour 5.71 5.96 5.81 0.88
a b a
Pink Colour 4.69 5.68 5.35 0.017
Compact aspect 6.31 6.04 6.72 0.11
Flavour intensity 4.32 5.20 5.25 0.12
Salty flavour 1.91 2.54 2.48 0.21
a b b
Firmness 5.85 4.14 4.51 0.001
a b a
Smooth texture 2.98 4.25 3.13 0.03
a b a
Damp texture 3.57 5.02 4.45 0.046
Fat texture 1.92 2.24 2.59 0.15
a b b
Exudation 2.96 4.39 4.04 0.01
Smoked fillet
Smoky odour 5.72 5.96 5.45 0.54
Salmonid odour 3.11 2.89 2.83 0.70
Pink colour 2.31 2.05 2.43 0.06
Orange colour 6.45 6.80 6.06 0.08
a b b
Colour homogeneity 5.67 6.16 6.15 0.037
Salty flavour 3.08 3.11 2.94 0.90
Salty aftertaste 2.51 2.78 2.23 0.29
Smoky aftertaste 4.04 4.60 4.44 0.59
Firmness 3.91 4.37 3.94 0.47
Fat texture 4.35 4.54 4.82 0.39
Values in the same row with different superscripts are significantly different.
1
See footnote 1 of Table 2 for description of periods.
At the end of the study, maximal force of raw fillets was significantly higher for fish
kept unfed than fed fish. The work expressed as mJrg was lower for fish fed the HF diet
Ž X.
during period 1 and then switched to the LF diet in period 2 LF than in the two other
groups. No differences between treatments were observed for maximal force of cooked fillets.
4. Discussion
The growth rate of fish in this study was higher than those reported by Arzel et al.
Ž1994 for brown trout of similar size grown over the same season winter . Increased. Ž .
dietary fat levels were found to improve feed and protein utilisation in brown trout by
Ž . Ž .
Table 8
Parameters of instrumental colour analyses of brown trout fillets at the end of the two growth periods1
Period 1 Experimental diets
Values are means"standard deviations ns9 . Values in the same row with different superscripts are
Ž .
significantly different P-0.05 .
1
See footnote 1 of Table 2 for description of periods.
2
weight loss here as in studies with other salmonids Takeuchi and Watanabe, 1982; Lie
.
and Huse, 1992; Einen et al., 1998 . However, body length did not change significantly
Ž .
in unfed fish contrary to observations of Bonnet et al. 1996 in brown trout. Lie and
Ž .
Huse 1992 showed that body length of Atlantic salmon increased in fish starved 35
Ž .
and 78 days. Einen et al. 1998 found that body length did not change significantly in Atlantic salmon starved for 30 days or less and increased in those starved beyond 58
Ž .
Table 9
Parameters of instrumental texture analyses of brown trout at the end of the two growth periods1
Period 1 Experimental diets
Work mJrg 249.0"8.6 233.7"11.5 246.8"12.5
X
Work mJrg 286.3"7.6 248.3"13.5 251.9"14.1
Ž .
Values are means"standard deviations ns9 . Values in the same row with different superscripts are
Ž .
significantly different P-0.05 .
1
See footnote 1 of Table 2 for description of periods.
The increase in whole body fat deposition with the increase of dietary fat levels as
Ž .
observed here are in accordance with earlier data from brown trout Arzel et al., 1994
Ž
as well as those from other species: Atlantic salmon Hillestad and Johnsen, 1994;
. Ž
Bjerkeng et al., 1997; Hemre and Sandnes, 1999 , rainbow trout Storebakken and
. Ž .
Austreng, 1987; Alvarez et al., 1998 , seabass Alliot et al., 1979 or gilthead seabream
ŽVergara et al., 1996 . At the end of period 2, although unfed fish had a lower liver size.
ŽHSI , neither starvation nor a switch to a low-fat diet of fish initially fed with the.
high-fat diet led to a decrease in VSI. A reduction in muscle fat was however observed
Ž .
in these fish. These results differ from those of Jezierska et al. 1982 and of
Ž .
Storebakken et al. 1991 in rainbow trout where viscera and liver were found to be more susceptible to fat mobilisation than carcass and muscle. In Atlantic salmon, the
Ž .
visceral fat content stays stable during starvation of 3–86 days Einen et al., 1998 . In
Ž .
the present study, reduction in whole body protein content was much lower 5% than
Ž .
that in lipid content 12% , suggesting that at least under the conditions prevailing, brown trout could better conserve their protein than lipid when kept unfed. Based on the respective changes in gross energy and total nitrogen in unfed fish, the contribution of
protein for energy purposes appears to range from 2.0 to 3.4 mgNrkJ, values
compara-Ž
ble to those found in other species Kaushik and Luquet, 1977; Kaushik and Medale,
´
.
Plasma cholesterol concentrations were comparable to values found in rainbow trout
ŽAlexis et al., 1985; Kaushik et al., 1995 . According to Fremont and Leger 1981 ,.
´
Ž .Ž .
plasma cholesterol concentrations depend on the nutritional status. Kaushik et al. 1995 observed that soy protein had a possible hypocholesterolemic effect. In Atlantic salmon
Ž .
fed different dietary fat levels, Hemre and Sandnes 1999 found no changes in plasma cholesterol or triglyceride levels. Starvation induced a decrease of plasma cholesterol concentrations as in rainbow trout where starvation was accompanied by significant decreases in serum glucose and blood cholesterol concentrations reflecting a decrease in
Ž .
feed intake or an increase in general lipid metabolism Heming and Paleczny, 1987 .
Ž .
Lipogenic processes in fish are similar to those in mammals Iritani et al., 1984 . The hepatic tissue is recognised as the preferential site of de novo fatty acid synthesis in fish
ŽLin et al., 1977a; Sargent et al., 1989 . Dietary non-protein energy sources are known.
to affect G6PD, malic enzyme and FAS activities in rainbow trout, channel catfish, and
Ž
European seabass Lin et al., 1977a,b; Likimani and Wilson, 1982; Arnesen et al., 1993;
.
Alvarez et al., 1998; Dias et al., 1998 . The values of G6PD activities in brown trout as
Ž
found here were similar to those recorded in rainbow trout Barroso et al., 1994; Alvarez
.
et al., 1998; Dias et al., 1999 . The decrease in G6PD activities with increasing dietary fat levels reflects most reasonably the effects of the concomitant decrease in dietary carbohydrate levels. The absence of significant changes in the activities of FAS with increase in dietary fat levels is also noteworthy and corresponds well with a lack of significant differences in overall daily fat gain. The decrease in G6PD and FAS activities observed in unfed brown trout possibly results from a change in metabolic flux
Ž .
as seen in other species Lin et al., 1977b; Barroso et al., 1993 .
Ž .
Even with the accumulation of perivisceral fat Table 4 , there was no reduction in gutted yield, the values of which as observed here are in the range of values found in
Ž .
other salmonids Einen et al., 1998; Hillestad et al., 1998 . In Atlantic salmon, starvation
Ž .
increases the slaughter yield Lie and Huse, 1992; Einen et al., 1998 , whereas our data suggest only a slight but not significant increase. However, the decrease in fillet yield
Ž .
under unfed conditions was also observed in Atlantic salmon Einen et al., 1998 . Among the most important quality attributes of animal or fish products from a consumer’s point of view are sensory attributes such as colour, texture, odour and
Ž .
flavour Boggio et al., 1985 . Sensory assessment showed no clear differences between groups except that smoked fillet of fish fed the low-fat diet has less fat and judged as more salty after smoking. Starvation induced modifications on sensory parameters such as smooth and damp texture and colour intensity confirmed by the instrumental colour analyses. In rainbow trout, starvation of 1 or 2 months did not significantly affect the
Ž .
odour or taste of cooked fillets Johansson and Kiessling, 1991 . Einen and Thomassen
Ž1998 found that starvation decreased the fresh flavour of cooked fillets of Atlantic.
salmon. These results show that the currently available data on sensory analyses are a bit contradictory and suggest that, at least, a standardisation of methodologies would be most useful.
In salmonids, flesh colour is an important parameter of quality for the consumers conferring an «elite» image to these fish. Increasing dietary fat levels induced an
intensification of colour of fillets, particularly of raw fillets. Values of saturation C)
Ž .
Better pigmentation with an increase of dietary fat levels has already been found in
Ž . Ž
rainbow trout Torissen, 1985; Choubert et al., 1991 and in Atlantic salmon Bjerkeng
.
et al., 1997; Einen and Roem, 1997; Einen and Skrede, 1998 . In Atlantic salmon, Einen
Ž .
and Skrede 1998 found that increasing fat levels of the fillets significantly increased
Ž ). Ž ).
redness a and yellowness b values of the raw fillets. Also, Nickell and Bromage
Ž1998 found in rainbow trout that lightness L. Ž ). values were significantly correlated
with flesh lipid content when dietary lipid level increased from 8% to 27%. Whether the increase in values of colour parameters observed in unfed fish are due to an internal redistribution of the pigment in fillets in the absence of dietary pigment intake
ŽChoubert, 1985 is also worth investigating, especially since there was a significant.
drop in muscle lipid content of fish after 2 months of fasting.
Ž .
Given that texture is a multiple parameter attribute Sigurgisladottir et al., 1997 , we employed different parameters like maximal force and work. Changes in dietary fat levels did not cause any noticeable difference in the parameters of instrumental texture evaluation, neither of cooked fillets nor of raw fillets. Very early, it was suggested that
Ž
when fat content in muscle is high, texture of the fillet becomes more tender Dunajski,
. Ž .
1979 . Kunisaki et al. 1986 also found a relation between fat content and muscle hardness in horse mackerel. In rainbow trout, while parameters of texture of raw fillet are conditioned by flesh fat content, those of cooked fillets are independent of fat
Ž .
content Fauconneau et al., 1993 . In fasted brown trout, an increase in maximal force
Ž .
was observed. After long-term starvation, an increase in pH at day 4 and 12 and in
Ž
hardness of muscle texture has been observed in Atlantic salmon Einen and Thomassen,
.
1998 . In the present study, the hardness of cooked fillets was significantly higher only in brown trout fed the low-fat diet during the whole study. This effect is probably due to a different lipid distribution in muscle rather than overall muscle lipid content.
In conclusion, high dietary fat levels lead to increased lipid deposition in the whole body and muscle of brown trout as in other salmonids. Both feeding a low-fat diet or feed withdrawal for 2 months prior to slaughter lead to a reduction in whole body as well as muscle fat content, without however having a clear effect on the sensory quality of flesh. However, compared to fasting, feeding a low-fat diet has the definite advantage of conserving growth performance.
Acknowledgements
The authors would like to express their gratitude to the personnel of the SEMII
experimental station of Camaret and to Herve Le Delliou for his technical assistance for
´
chemical analysis. C. Regost is a recipient of a partial financial scholarship from Region
´
Bretagne.
References
Ž
AFNOR, 1995. Directives generales pour l’implantation de locaux destines a l’analyse sensorielle NF V´ ´ ´ `
.
Ž .
AOAC Association of Official Analytical Chemists , 1984. Official Methods of Analysis. 12th edn. Association of Official Analytical Chemists, Washington, DC, USA, 1141 pp.
Alexis, M.N., Papaparaskev-Papoutsoglou, E., Theochari, V., 1985. Formulation of practical diets for rainbow
Ž .
trout Salmo gairdneri made by partial or complete substitution of fishmeal by poultry by-products and certain plant by-products. Aquaculture 50, 61–73.
Alliot, E., Pastoureaud, A., Nedellec, J., 1979. Etude de l’apport calorique et du rapport calorico-azote dans´ l’alimentation du bar Dicentrarchus labrax. Influence sur la croissance et la composition corporelle. In:
Ž .
Halver, J.E., Tiews, K. Eds. , Proc. World Symp. on Finfish Nutrition and Fishfeed Technology, Hamburg, Germany Heenemann, Berlin, vol. I, pp. 241–255.
Alvarez, M.J., Lopez-Bote, C.J., Diez, A., Corraze, G., Arzel, J., Dias, J., Kaushik, S.J., Bautista, J.M., 1998. Dietary fish oil and digestible protein modify susceptibility to lipid peroxydation in the muscle of rainbow
Ž . Ž .
trout Oncorhynchus mykiss and sea bass Dicentrarchus labrax . Br. J. Nutr. 80, 281–289.
Arnesen, P., Krogdahl, A., Kristiansen, I.O., 1993. Lipogenic enzyme activities in liver of Atlantic salmon
ŽSalmo salar . Comp. Biochem. Physiol. 105B, 541–546..
Arzel, J., Martinez Lopez, F.X., Metailler, R., Stephan, G., Viau, M., Gandemer, G., Guillaume, J., 1994.´ ´
Ž .
Effect of dietary lipid on growth performance and body composition of brown trout Salmo trutta reared in seawater. Aquaculture 123, 361–375.
Barroso, J.B., Garcia-Salguero, L., Peragon, J., de la Higuera, M., Lupianez, J.A., 1993. Effects of long term˜
Ž
starvation on the NADPH production systems in several different tissues of rainbow trout Oncorhynchus
. Ž .
mykiss . In: Kaushik, S.J., Luquet, P. Eds. , Fish Nutrition in Practice. Biarritz, France, pp. 333–338,
INRA Editions. Les Colloques no. 61.
Barroso, J.B., Garcia-Salguero, L., Peragon, J., de la Higuera, M., Lupianez, J.A., 1994. The influence of˜ dietary protein on the kinetics of NADPH production systems in various tissues of rainbow trout
ŽOncorhynchus mykiss . Aquaculture 124, 47–59..
Bautista, J.M., Garrido-Pertierra, A., Soler, G., 1988. Glucose-6-phosphate dehydrogenase from
Dicentrar-chus labrax liver: kinetic mechanism and kinetic of NADPH inhibition. Biochim. Biophys. Acta 967,
354–363.
Bauvineau, C., Laroche, M., Heil, F., Dumont, J.P., Cardinal, M., Cornet, J., Vallet, J.L., Fauconneau, B., Faure, A., 1993. Incidence de la vitesse de croissance sur les caracteristiques de la chair de la truite fario´ ´
ŽSalmo trutta elevee en mer. Sci. Aliment. 13, 201–211..´ ´
Bjerkeng, B., Refstie, S., Fjalestad, K.T., Storebakken, T., Rødbotten, M., Roem, A.J., 1997. Quality
Ž .
parameters of the flesh of Atlantic salmon Salmo salar as affected by dietary fat content and full-fat soybean meal as a partial substitute for fish meal in the diet. Aquaculture 157, 297–309.
Ž .
Blokhus, H., 1986. Aspects related to quality of farmed salmon Salmo salar . In: Kramer, D.E., Liston, J.
ŽEds. , Seafood Quality Determination. International Symposium co-ordinated by the University of Alaska.
Sea Grant College Program, Anchorage, Alaska, USA, 10–14 Nov.. Elsevier, Amsterdam, pp. 615–628. Boggio, S.M., Hardy, W.H., Babbitt, J.K., Brannon, E.L., 1985. The influence of dietary lipid source and
Ž .
alpha-tocopheryl acetate level on product quality of rainbow trout Salmo gairdneri . Aquaculture 51, 13–24.
Bonnet, S., Fauconneau, B., David, K., Faure, A., Laroche, M., 1996. Effect of fasting and stress on post mortem changes in brown trout reared in sea water. Refrigeration Science and Technology. Refrigeration and Aquaculture, Bordeaux, France, pp. 137–144.
Bradford, M.M., 1976. A rapid and sensitive method for the quantitation of microgram quantities of protein utilising the principle of protein-dye binding. Anal. Biochem. 72, 248–254.
Chen, I.S., Shen, C.S.J., Sheppard, A.J., 1981. Comparison of methylene chloride and chloroform for extraction of fats from food products. J. Am. Oil Chem. Soc. 50, 599–601.
Cho, C.Y., Kaushik, S.J., 1990. Nutritional energetics in fish: protein and energy utilization in rainbow trout.
Ž .
In: Bourne, G.H. Ed. , Aspects of food production, consumption and energy values. World Rev. Anim. Nutr. 61, 132–172.
Ž
Choubert, G., 1982. Method for colour assessment of canthaxanthin pigmented rainbow trout Salmo gairdneri
.
Rich. . Sci. Aliment. 2, 451–463.
Choubert, G., 1985. Effects of starvation and feeding on canthaxanthin depletion in the muscle of rainbow
Ž .
Choubert, G., de la Noue, J., Blanc, J.M., 1991. Apparent digestibility of canthaxanthin in rainbow trout:¨ effect of dietary fat level, antibiotics and number of pyloric caeca. Aquaculture 99, 323–329.
Corraze, G., Kaushik, S.J., 1999. Les lipides des poissons marins et d’eau douce. Ol., Corps Gras, Lipides 6, 111–115.
Dias, J., Alvarez, M.J., Diez, A., Arzel, J., Corraze, G., Bautista, J.M., Kaushik, S.J., 1998. Regulation of
Ž .
hepatic lipogenesis by dietary proteinrenergy in juvenile European seabass Dicentrarchus labrax .
Aquaculture 161, 169–186.
Dias, J., Corraze, G., Arzel, J., Alvarez, M.J., Bautista, J.M., Lopez-Bote, C., Kaushik, S.J., 1999. Effets du rapport proteinerenergie des regimes alimentaires chez la truite et le bar d’elevage. Perspectives de´ ´ ´ ´ controle nutritionnel. Cybium 23, 127–137, suppl. 1.ˆ
Dunajski, E., 1979. Texture of fish muscle. J. Texture Stud. 10, 301–318.
Einen, O., Roem, A.J., 1997. Dietary proteinrenergy ratios for Atlantic salmon in relation to fish size: growth; feed utilisation and slaughter quality. Aquacult. Nutr. 3, 115–126.
Ž
Einen, O., Skrede, G., 1998. Quality characteristics in raw and smoked fillets of Atlantic salmon Salmo
.
salar , fed high-energy diets. Aquacult. Nutr. 4, 99–108.
Ž .
Einen, O., Thomassen, M.S., 1998. Starvation prior to slaughter in Atlantic salmon Salmo salar : II. White muscle composition and evaluation of freshness, texture and colour characteristics in raw and cooked fillets. Aquaculture 169, 37–53.
Ž
Einen, O., Waagen, B., Thomassen, M.S., 1998. Starvation prior to slaughter in Atlantic salmon Salmo
.
salar : I. Effects on weight loss, body shape, slaughter and fillet-yield, proximate and fatty acid
composition. Aquaculture 166, 85–104.
Fauconneau, B., Chmaitilly, J., Andre, S., Cardinal, M., Cornet, J., Vallet, J.L., Dumont, J.P., Laroche, M., 1993. Caracteristiques de la chair de truite arc en ciel: II. Composantes physiques et sensorielles. Sci.´ Aliment. 13, 188–199.
Folch, J., Lees, M., Stanley, G.H.S., 1957. A simple method for the isolation and purification of total lipids from animal tissues. J. Biol. Chem. 226, 497–509.
Ž .
Fremont, L., Leger, C., 1981. Le transport des lipides plasmatiques. In: Fontaine, M. Ed. , Nutrition des´ Poissons. Editions du Centre National de la Recherche Scientifique, Paris, pp. 263–282.
Ž
Gabaudan, J., Metailler, R., Guillaume, J., 1989. Nutrition comparee de la truite arc en ciel Oncorhynchus´
. Ž . Ž .
mykiss , la truite fario Salmo trutta et le saumon coho Oncorhynchus kisutch . Effet des taux de
proteines totales et de lipides. ICES 5, 1–13.´
Gjedrem, T., 1997. Flesh quality improvement in fish through breeding. Aquacult. Int. 5, 197–206. Greene, D.H.S., Selivonchick, D.P., 1990. Effects of dietary vegetable, animal and marine lipids on muscle
Ž .
lipid and hematology of rainbow trout Oncorhynchus mykiss . Aquaculture 89, 165–182.
Heming, T.A., Paleczny, E.D., 1987. Compositional changes in skin mucus and blood serum during starvation of trout. Aquaculture 66, 265–273.
Hemre, G.I., Sandnes, K., 1999. Effect of dietary lipid level on muscle composition in Atlantic salmon Salmo
salar. Aquacult. Nutr. 5, 9–16.
Hillestad, M., Johnsen, F., 1994. High-energyrlow protein diets for Atlantic salmon: effects on growth, nutrient retention and slaughter quality. Aquaculture 124, 109–116.
Hillestad, M., Johnsen, F., Austreng, E., Asgard, T., 1998. Long-term effects of dietary fat level and feeding rate on growth, feed utilisation and carcass quality of Atlantic salmon. Aquacult. Nutr. 4, 89–97. Hsu, R.Y., Butterworth, P.H.W., Porter, J.W., 1969. Pigeon liver fatty acid synthetase. In: Lowenstein, J.M.
ŽEd. , Methods in Enzymology Academic Press, New York, vol. 14, pp. 33–39..
Iritani, N., Ikeda, Y., Fukuda, H., Katsurada, A., 1984. Comparative study of lipogenic enzymes in several vertebrates. Lipids 19, 828–835.
ITCF, 1988. STAT-ITCF, 4 eme ed. Service des Etudes Statistiques, Paris.` ´
Jezierska, B., Hazel, J.R., Gerking, S.D., 1982. Lipid mobilization during starvation in the rainbow trout,
Salmo gairdneri Richardson, with attention to fatty acids. J. Fish Biol. 21, 681–692.
Johansson, L., Kiessling, A., 1991. Effects of starvation on rainbow trout. Acta Agric. Scand. 41, 207–216. Kaushik, S.J., Cuzon, G., 1999. Besoins nutritionnels, formules types, tables de rationnement, et donnees´
Ž .
Kaushik, S.J., Luquet, P., 1977. Endogenous nitrogen loss from the muscle of rainbow trout starved in freshwater and in seawater. Ann. Hydrobiol. 8, 129–134.
Kaushik, S.J., Medale, F., 1994. Energy requirements, utilization and dietary supply to salmonids. Aquaculture´ 124, 81–97.
Kaushik, S.J., Cravedi, J.P., Lalles, J.P., Sumpter, J., Fauconneau, B., Laroche, M., 1995. Partial or total replacement of fish meal by soya protein on growth, protein utilization, potential estrogenic or antigenic effects, cholesterolemia and flesh quality in rainbow trout. Aquaculture 133, 257–274.
Kunisaki, N., Takada, K., Matsuura, H., 1986. On the study of lipids contents, muscle hardness and fatty acid compositions of wild and cultured horse mackerel. Fish. Sci. 52, 333–336.
Laroche, M., Bonnet, S., Fauconneau, B., Marcel, J., 1996a. Evolution post mortem de quelques caracteris-´
Ž . Ž .
tiques de la chair de truite fario Salmo trutta et de carpe Cyprinus carpio . Refrigeration Science and Technology. Refrigeration and Aquaculture, Bordeaux, France, pp. 117–125.
Ž
Laroche, M., Fauconneau, B., Marcel, J., 1996b. Effet de la duree et des conditions de stockage refrigeration´ ´ ´
. Ž .
et congelation sur des caracteristiques de texture de filets de truite fario´ ´ Salmo trutta et de carpe
ŽCyprinus carpio . Refrigeration Science and Technology. Refrigeration and Aquaculture, Bordeaux,.
France, pp. 393–400.
Lee, D.J., Putnam, G.B., 1973. The response of rainbow trout to varying proteinrenergy ratios in a test diet. J. Nutr. 103, 916–922.
Ž .
Lie, Ø., Huse, I., 1992. The effect of starvation on the composition of Atlantic salmon Salmo salar . Fisk. Dir. Skr., Ser. Ernoering 5, 11–16.
Likimani, T.A., Wilson, R.P., 1982. Effects of diet on lipogenic enzyme activities in channel catfish hepatic and adipose tissue. J. Nutr. 112, 112–117.
Lin, H., Romsos, D.R., Tack, P.I., Leveille, G.A., 1977a. Influence of dietary lipid on lipogenic enzyme
Ž .
activities in coho salmon Oncorhynchus kisutch . J. Nutr. 107, 846–854.
Lin, H., Romsos, D.R., Tack, P.I., Leveille, G.A., 1977b. Effects of fasting and feeding various diets on
Ž .
hepatic lipogenic enzyme activities in coho salmon Oncorhynchus kisutch . J. Nutr. 107, 1477–1483. Nickell, D.C., Bromage, N.R., 1998. The effect of dietary lipid level on variation of flesh pigmentation in
Ž .
rainbow trout Oncorhynchus mykiss . Aquaculture 161, 237–251.
Ž .
Sargent, J., Henderson, R.J., Tocher, D.R., 1989. The lipids. In: Halver, J.E. Ed. , Fish Nutrition. Academic Press, San Diego, pp. 153–218.
Sheehan, E.M., O’Connor, T.P., Sheehy, P.J.A., Buckley, D.J., FitzGerald, R., 1996. Effect of dietary fat intake on the quality of raw and smoked salmon. Irish J. Agric. Food Res. 35, 37–42.
Sigurgisladottir, S., Torrissen, O., Lie, Ø., Thomassen, M., Hafsteinsson, H., 1997. Salmon quality: methods to determine the quality parameters. Rev. Fish. Sci. 5, 223–252.
Stone, H., Sidel, J.L., Oliver, S., Woolsey, A., Singleton, R.C., 1974. Sensory evaluation by quantitative descriptive analysis. Food Technol. 28, 24–34.
Storebakken, T., Austreng, E., 1987. Ration levels for salmonids: II. Growth, feed intake, protein digestibility, body composition, and feed conversion in rainbow trout weighing 0.5–1.0 kg. Aquaculture 60, 207–221. Storebakken, T., Hung, S.S.O., Calvert, C.C., Plisetskaya, E.M., 1991. Nutrient partitioning in rainbow trout at
different feeding rates. Aquaculture 96, 191–203.
Szczesniack, A.S., Humaugh, P.R., Block, H.W., 1970. Behaviour of different foods in the standard shear compression cell of the shear press and the effect of sample weight on peak area and maximum force. J. Texture Stud. 1, 356–378.
Takeuchi, T., Watanabe, T., 1982. The effects of starvation and environmental temperature on proximate and fatty acid composition of carp and rainbow trout. Bull. Jpn. Soc. Sci. Fish. 48, 1307–1316.
Thomassen, M.S., Røsjø, C., 1989. Different fats in feed for salmon: influence on sensory parameters, growth rate and fatty acids in muscle and heart. Aquaculture 79, 129–135.
Torissen, O.J., 1985. Pigmentation of salmonids: factors affecting carotenoid deposition in rainbow trout
ŽSalmo gairdneri . Aquaculture 46, 133–142..