POINTS CLOUDS GENERATION USING TLS AND DENSE-MATCHING TECHNIQUES.
A TEST ON APPROACHABLE ACCURACIES OF DIFFERENT TOOLS.
F.Chiabrando a, A. Spanò a, *
a
Politecnico di Torino, Department of Architecture and Design,10125 Torino, Italy -
(filiberto.chiabrando,antonia.spano)@polito.it
KEY WORDS: Passive sensors, dense-matching, 3D models, architectural Heritage, TLS
ABSTRACT:
3D detailed models derived from digital survey techniques has increasingly developed and focused in many field of application, ranging from the land and urban areas survey, using remote sensed data, to landscape assets and finally to Cultural Heritage items. The high detailed content and accuracy of such models makes them so attractive and usable for large sets of purposes.
The present paper is focused on a test aimed to point clouds generation fulfilled by archaeological data; active and passive sensors techniques and related image matching systems have been used in order to evaluate and compare the accuracy of results, achievable using proper TLS and low cost image-matching software and techniques.
After a short review of approachable methods some attained results will be discussed; the test area consists of a set of mosaic floorings in a late roman domus located in Aquileia (UD-Italy) requesting a very high level of details and high scale and precision. The experimental section provides the descriptions of the applied tests in order to compare the different software and the employed methods.
* Corresponding author.
1. INTRODUCTION
The request of digital metric survey and related generation of 3D detailed models has increasingly developed for all assets of Cultural Heritage (CH). Similarly to other application fields (Mechanics, Robotics, human reconstruction) the high detailed content and accuracy of such models makes them so attractive. Moreover, according to the needs requested in diverse portions of assets or buildings, the opportunity to generate parts of models featured by different resolution and details, is very esteemed and effectual. It is necessary to consider that 3D models derived from innovative techniques of digital survey are basically a new tool, a new way to represent architectural models. After digital revolution, the remarks on architectural representation has carefully reassigned to 3D continuous models some renewed aims, featuring also traditional models. These last mainstream models (plans, front and cross sections, 3D models generated by plane entities, rotation surface or generally surfaces with known equation) can be obviously textured by orthoimages.
The difference among those derived from automated acquisition systems of digital survey is the different level of manual intervention on generation, adding to different accuracy and diverse adherence to real objects.
The opinion that 3D modelling deriving from digital survey (active or passive sensors) is more rapid and provides more details than other survey systems is well accepted. These models enable to obtain shape documentation and thematic characterization that are more sustainable in terms of costs and amount of available information respect to those derived from other systems. The ability of extracting bi-dimensional representation on section planes which are located in sensitive zones of the buildings, or 3D representation emphasizing diverse phenomena (wireframe, shaded, digital elevation
models) makes these systems more adaptable and cost-effective than others, that is very important in a low resources field such CH preservation. The CH conservation plans are even more specialized and the huge width of assets makes the preservation issue imperatively urgent, since the human community growth and the interaction with the environment makes the risk conditions upon CH more imminent. If models generation is connected to general rules of metric survey, it is possible to postpone in different phases their management and deepening. Their implementation is even bound to the development of digital web archives. These systems are planned and achieved for CH valorisation, in the meanwhile for the specialists web sharing and for knowledge spreading to the large public. The coordination of these two research sectors, foreseeing the integration of detailed and flexible models in web-GIS aimed to global management of spatial information concerning the built heritage, is under a great attention.
In the end is useful to underline that surface models generation presents semiautomatic phases, while the orthophoto production is completely automatic. On the contrary the achievement of complete and accurate surface models is surely time spending and involve very relevant critic work by human operator; these activities assure that the digital survey and the related model don’t turn out a mould, but a scaled model that represent the examined object, emphasizing characters and phenomena concerning it .
2. SENSORS FOR DIGITAL SURVEY
The instruments which are capable of recording 3D data and 3D reality based reconstruction of the objects, could be classify in different categories such as active sensors and passive sensors. Terrestrial Laser Scanner (TLS), Time of Flight (ToF) or 3d cameras belongs to the first category (Rapp, 2007), whereas passive sensors cover all digital photogrammetry techniques.
Range sensors like TLS (Terrestrial Laser Scanner) today are increasingly requested and used in architectural and archaeological survey. The main drawback of these instruments is still the high cost, then, since they are very specialized, often they cannot satisfy diverse needs requested in the same site or monument, and sometimes they are lowly portable. In order to reduce the costs and the weight of the traditional TLS some new range sensors have been introduced on the market: the Time of Flight (ToF) cameras or 3D cameras acquiring range images (Chiabrando et al.,2009); unfortunately the actual low resolution together with the problems founded in the data acquired in outdoor conditions of these new instruments don’t allow the massive use of this technology for typical architectural and archaeology surveys.
Finally only low resolution images can be acquired from TLS integrated cameras and only b&w informations from ToF cameras. For these aforementioned reasons and in order to obtain more information about the radiometry of the surveyed objects a massive use of passive optical sensors, in particular the digital cameras, are used for metric Cultural Heritage documentation, survey and 3D modelling. The actual trends in photogrammetric developments are closely related to computer vision algorithms and methodologies that allow to transform the 2D image features into 3D information. At least two images are generally required and 3D data can be derived using projective geometry formulations.
2.1 TLS (Terrestrial Laser Scanner)
The large use of Terrestrial laser scanner in last decade has highlighted the role as an active imaging device that can rapidly acquire a dense set of three-dimensional points on large kind of objects or surfaces.
Another pointed out benefit of this stand-alone instrumentation consists in the great potential for close-range measurement tasks, usually performed with traditional topographic or photogrammetric methods. Furthermore the laser scanning systems have shown their great potential with the integration of digital photogrammetric data, acquired with integrated or non integrated sensors.
From around the year 2000 onwards, TLS seemed to be one of the main technological advancements, which induced significant changes in the field of 3D modelling. Since laser scanners were used intensively for the generation of 3D models required for diverse applications such as documentation of Cultural Heritage, navigation, space exploration etc., the laser technology surpassed traditional close-range photogrammetry, because of its accuracy and automation level (Boehler et al.2004). Presently the trend is reversed; the introduction of more accurate algorithms for image matching techniques increases again the attention of close-range photogrammetric techniques for CH survey and 3D modelling.
2.2 Photogrammetry based matching methods
The chance to derive 3D information from images is mainly connected with the ability to pick out corresponding points in images shooting the same object from different positions. In analogical and analytical photogrammetry this action has always been performed manually, while with the digital photogrammetry coming up, many reasons and benefits have encouraged the semiautomatic and automatic procedure. The first proposals of image matching process was approached in the late 1970s (Helava), but only during the sequent decade the automatic photogrammetric orientations have been planned to be processed by matching techniques. The image-matching
methodology was developed and tested firstly for remote sensed data. At first it has been planned to meet orientation solutions and then to perform DTM/DSM (Digital Terrain Model / Digital Surface Model) extraction from aerial or satellite stripes. Only recently it is extensively used in close-range application concerning architectural and archaeological survey; Now, it is well accepted that the tie points (TPs) searching is easily manageable with traditional aerial stripes than using close range data, because of the major variance in geometry and radiometry of terrestrial stereopairs.
The first three methods of image-matching are distinguished for the entity used to pursue the points correspondence: the area-based matching method (ABM) works on the match of analogue small pixel areas in diverse images, and it’s widespread in photogrammetry. The quality of similarity among pixels is measured by correlation method or by a least square method; in the last case the process is called least square matching (Grun, 1985, Baltsavias, 1991), which enable to introduce more constrains to the points seeking. A second method is the feature-based matching, that uses homogeneous points, lines or areas as entities to be searched in overlapping images (if seeked objects are elements boundaries the process is called edge-matching) (Marr, Hildreth, 1980, Torre, Poggio, 1980). At last, the relational-matching process uses more entities connected themselves as searching structures; the kind of relation among them can be spatial, topological or radiometrical (Vosselman, 1992). The aforementioned methods are basically matching strategies; many algorithms solving differently applications have been proposed and tested. In general terms they are aimed to solve the ambiguity in the correspondences and they provide a restraint to the extension of search windows in order to reduce the processes. In the ABM the corresponding pixels patch, that are searched in different overlapping images, assume different characters and positions because of diverse geometries of the acquiring shootings, or because of different images radiometry or even diverse points levels on objects surfaces. The ambiguity is often amplified by repetitive textures, and, on the other side, one of the most used strategy for the reduction of the searching space is the epipolar geometry. According to this geometry, epipolar planes embody conjugated points, these last belong to epipolar lines. In normalized images (i.e. converted images where epipolar lines are parallel to the edge of the photograms), those properties enable to seek corresponding points on lines rather than on plane. A diverse or complementary approach is the option of placing constrains in the level variation of searched point; finally the hierarchical approach binds the search using a sequence of images featured by gradually enhanced resolution (Borgefors, 1988).
The feature-matching technique is based on the preliminary extraction of features from images, than a comparison searching radiometric similarities or finding disambiguities on presumed features couples is performed. The features seeking is achieved by interest operators (Harris, Stephen, 1999; Forstner, 1986): some of them work on points features, others detect edges (Sobel, Roberts, Laplacian, Canny Operator). It’s very important to notice that in the field of complex surfaces generation, acquired from close distances, strategies integrating area-based and feature-based matching seem to be more profitable (Remondino, Menna, 2008). Cultural Heritage applications are included in such cases and they benefit even from active and passive sensors integrating systems. The integrating application of methods very often uses calibrated professional cameras, in hand-handed shooting. Surely these strategies are aimed to enhance results in low cost experiences
2.2.1 Area-based matching approach (Photomodeler Scanner and Image Master): The software application tools for image-matching uses mostly stereo pairs correspondence algorithms (Brown et al., 2003). This technique uses normalized images in order to limit the search for correspondence only in one direction. Normalized images are resampled to obtain parallel images and reduce the parallax error only to the X axis direction allowing the mono-dimensional correlation (Allen et al., 2003). Through collinearity equations images are resampled reconstructing the normal shooting geometry. Afterwards in the new reference systems image coordinates are parallel to the XY plane and consequently the parallaxes errors are nullified. A method widely used is to resample single points on the images through epipolar geometry. According to these conditions only oblique images allow to determine the epipolar points, whereas the use of normal images or pseudo ones cannot resolve the equations. Indeed epipolar lines from oblique images results as oblique lines in the image planes whereas the same lines approaches to be parallel in the case of normal images. This kind of technique is widely used by commercial software. Two of them, Photomodeler Scanner by Eos Systems and Image Master by Topcon have been used for testing the area-based matching technique using nadiral and convergent images (sec. 3.2.). These applications systems uses both normal and oblique images as they are able to differently contribute to the final results. Oblique images produces better results in the exterior orientation stage due to the epipolar geometry on which this system is based. On the contrary normal images renders better results in matching phase. In fact correlation algorithms (both the area-based and feature-based ones) analyze the differences in grayscale intensity between pixels of the two stereo pairs and so require a similar shooting geometry to allow a best correspondences finding. The ABM method uses algorithms to measure the pixels level of similarity based on the base of radiometric intensity. Image pixels, converted into grayscale, are computed in order to find the best matching level of grayscale intensity. For each x position of the pixels in the first image a domain on the second image (the size of the correlation area) is defined in order to find the correspondences and consequently select the best similarity value (Babbar et al., 2010).
Constrain parameters are used to control the correlation and their appropriate setting is related to the geometry and material features of the surveyed object. The main constrains are: depth-range; correlation area size and texture type. The first of them is related to the surface elevation variation, measured from the reference approximate surface. This surface can be a fit plane interpolated from the tie and control points or, in addition, a new one can be drawn in the model to approximate the object surface. This surface is used to discard correlation matches that exceed the gap limits of the surface elevation. The other two parameters involves the correlation search and they are strictly related to the characteristics of the surface material. The second constrain defines the radius of the searching area in the normalized images. The increase of this value reduces the noise level especially in case of non repeating patterns and random textures. The last parameters, strictly related to the previous one, controls the tolerance level in the correspondence searching. Thus it defines the type pattern of the surface material and should be set according with the size of the correlation area.
2.2.2 Feature-based matching approach (MicMac IGN France)
In the dense correlation scenario, the software using the feature-based matching approach chosen for the testing is MicMac. The software has been developed by the MATIS laboratory (IGN
France) and it has been deliver as open source in 2007, usable in different contexts (satellite, aerial, terrestrial) for extracting point clouds from images. The main difference between MicMac and other open source software, which has been developed within the Computer Vision community like Bundler-PMVS (Furukawa, Ponce, 2010) or Samantha (Gherardi et al.,2011), is the introduction of photogrammetric rigidity in the equations. Moreover the camera calibration models used in MicMac are more sophisticated and allow to calibrate also Fish Eye cameras.
According to the traditional steps of the photogrammetric data processing, first of all the pipeline consists in the automated tie point extraction; after that the bundle adjustment and the camera parameters derivation are computed. Moreover a dense image matching for surface reconstruction is realized and finally the orthoimages are generated. The first step is the computation of tie points (TPs) from all pair of images: for the TPs computation a modified version of the SIFT++ implementation (Vedaldi, 2010) of SIFT algorithm (Lowe, 2004) that is able to work with large images is used (Pierrot-Deseilligny, M., Cléry, I., 2011). SIFT generally gives excellent results when the images are taken respecting a correct acquisition geometry, with an overlapping of about 80 %. The reliability of the algorithm was confirmed by our test. The second step is closely related to the employed camera and the characteristic of the optics.
The choice of the focal the length has a direct influence on the number of acquisitions and the resolution of the final point cloud is closely related to the number of pixels of the camera. A good rule is to know the calibration parameters of the employed lens before starting with the bundle block adjustment and the point cloud generation; alternatively it is possible to compute the value using lab test field or building’s corner following the basic photogrammetric rules: more than 10 convergent images at different distances from the object, with orthogonal roll angles and covering the entire image format. However if no internal parameters are available or the survey is contemporary realized on the object, a self-calibration could be performed during the bundle adjustment images procedure using in most of cases the classical Brown’s parameters strategy (Brown, D.C., 1971). After the bundle block computation, the main step of the pipeline, i.e the multi image matching, is performed. The software is based on a multi-scale, multi-resolution, pyramidal approach, with the employment of an energy minimization function (Figure 1).
This approach allow to limit combinatorial research: at the initial step, the whole depth interval is explored and a patch in the master image is identified. At any next step, the area to explore comes from the previous step (for each hypothetical 3D points), with a dilatation factor in x, y and z coordinates, and the results are projected in all the neighborhood images. At the end a global similarity is derived. Besides, MicMac software uses an energetic formalism (Pierrot-Deseillign, M., Paparoditis, N., 2006), where a function, combining a regularization term and image matching, moreover an energy minimization approach, similar to semi global matching algorithms (Hirschmuller, 2008) is applied to improve surface regularities and prevent the outliers and the unwanted jump. Several parameters could be managed in the software at each step: the optimization algorithm, the regularization parameters, the dilatation parameters, the subset of images, the post filtering on depth method, the size of the correlation window and the regularization resolution. Once the computation is performed the 3D point cloud is derived with the extraction of the elevation value from the depth image (the result of the dense matching) and at each point a colored (RGB) value is assigned
(derived from the oriented original images). Finally, thanks to the big amount of 3D information derived from the point cloud, through a simply orthographic projection is possible to carry out the single orthophoto or a mosaic of orthoimages concerning the surveyed area.
Figure 1. The multi resolution MicMac matching approach, applied on cultural asset (wooden tabernacle, XVIIth century., Piedmont)
3. EXPERIMENTAL SECTION
The tests concern some mosaic floors of a IV c. domus in Aquileia (Italy).
First of all, in whole area of the domus a complete TLS survey was performed with the FARO Focus 3D laser scanner; moreover using a telescopic pole (Chiabrando et al., 2010) a complete photogrammetric acquisition was performed.
In the following sections the results achieved using the TLS and the image-matching approach are reported; the most important aim is the comparison of the obtained accuracies on some Control Points (CPs) measured using traditional topographic techniques. Since the study area consists in mosaic floorings, the flat shape could appear not so proper for 3D modeling techniques testing. A featuring characteristic of these northern Italy mosaics is that they presents very small elements, 1 cm or lower. So very high accuracy of points position, both in cloud models than in orthoimages, were highly requested.
3.1 TLS acquisition and post-processing
The employed scanner (Faro Focus3D
), is a phase-shift measurement system that allow to acquire data at a vertical range of 305° and an horizontal range of 360°. The instrument is able to acquire up to 976.000 points/sec.
Moreover the integrated compass, the heights sensor, the dual axis compensator, and the CCD camera deliver valuable information about the scans height, orientation, level and RGB information. A complete documentation of the interesting test area surface (about 45x30 m) required 14 scans (acquired from the tripod on the floor). The following post-processing steps came after (the typical phase that usually are employed with TLS data):
Point cloud colouring / Registration / Filtering and outliers elimination. The scan rate selected for the area of the domus was 1/8 (that means a point step of 1.2 cm at 10 meters) with a quality of 2x (for each point the measure is acquired two times).
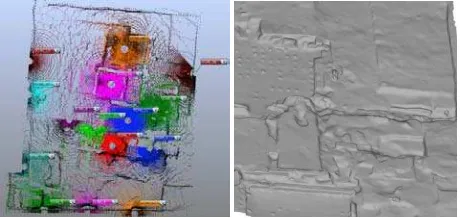
In the figure 2 the acquired registered scans and a zoom of the achieved 3D model are shown.
3.2 Area-Based matching
For all the matching tests that involves parts of the floors and the wall basement surrounding the rooms of the domus, the average acquisition distance of images was 6 m with a Ground Sampling Distance (GSD) of 0.002 m. All the acquisitions were achieved using a Canon Eos 1Ds Mark II with a focal
Figure 2. The 14 acquired scans (false color, left) and a zoom of the achieved 3D model (right).
length of 20.42 mm (the inner calibration parameters of the camera have been determined using a polygon test-field achieved in previous works and even by a self-calibration test performed by a least square bundle blocks adjustment; the acquiring distances of images were similar to the present case). These excavated ruins as the terrain features, can be easily represented through 2.5D representations, like raster DEMs and shape models, due to the small elevation differences. According to the epipolar geometry, the photo requirements for the point cloud extraction involve essentially the base to height ratio and the angle between optical axis. In the present work we assumed as reference range values, 0.2 to 0.5 for the base to height ratio and 30° as the maximum angle between optical axis. The ABM software we are going to compare are Photomodeler Scanner by Eos System and Image Master by Topcon, The oriented images using both software (Figure 2, 3) consist of two parallel nadiral and oblique stripes for a total number of 31 photograms.
Figure 2. Some views showing the shooting geometry scheme (top), and a screen shot of the matching results (TIN textured
visualization) for the test area (Photomodeler Scanner).
Figure 3. Screen shot of the employed images during the orientation process (previous page) and screen shot of the matching results (TIN
visualization) of the analyzed portion (Image Master).
The integration of the two parallel stripe composed by oblique converging images contributes to enforce the rigidity of the matching model. Best results in the exterior orientation stage are obtained through parallel stripes and converging stereo pairs. This can be assumed as the best shooting geometry for the survey of these kind of objects. For the orientation process were employed some GCPs measured on the terrain and several TPs used in order to improve the reliability of the photo-grammetric block. In the following figure some part of the processing steps and the final result using Image Master software are showed.
3.3 Feature-Based Matching
Since the domus floors are characterized by mosaic textures and since MicMac software is based on the SIFT algorithms a very rich and fruitful results during the Tie Points extraction was achieved (Figure 4).
Figure 4. Tie Point extraction using MicMac
The Bundle Block Adjustment had been earlier calculated by a traditional photogrammetric software (Leica Photogrammetric Suite), and results have been inserted in MicMac as fixed terms. The matching results (residuals equal to less than 2 pixels for each image) confirm the excellent performance of the software in this repetitive textured test area. According to the processing step, after the BBA the dense matching was performed and the 3D colored point cloud was obtained starting from the depth image related to the original RGB images.
The average step between the points in the generated cloud was about 3 mm. Furthermore with these data a 3D triangulated model was generated (Figure 5, top) in order to achieve a complete shape documentation of the surveyed area. Finally, using the color information derived from the matching process, a textured model was realized (Figure 5, below).
4. COMPARISONS
In order to evaluate the accuracy of the achieved results a complete comparison of residuals of the several points in the cloud model was performed. The check has been carried out using the 3D coordinates of different well distributed Control Points measured by a Total Station on the test floors.
Figure 5.Complete triangulated 3D model of the surveyed area (top), view of the realized textured model (below).
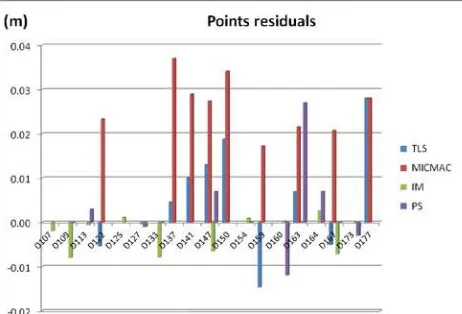
Figure 6. Diagram of the achieved results derived from comparison of
several points coordinates measured by topographic method and by different matching process or TLS survey.
In the diagram of Figure 6, the results of the comparison are shown. In the graph, the discrepancy between the sets of points belonging to the clouds and the CPs, for each generation method, are close to 2-3 cm.
The most suitable results has been carried out using Image Master software (less than 1 cm for all the analyzed CPs), on the other hand the discrepancies between the CPs and the other point clouds, generated using Photomodeler Scanner (PS), MicMac or the TLS survey are very similar with a fluctuation around 2 cm.
According to the result, it is possible to state that the achieved accuracies underline the big potentiality of the image matching approach for the generation of point clouds in CH field. Simultaneously the accuracy obtained with the TLS method (in accordance with the acquisition parameters) confirm the good performance of the Laser technology in archaeological survey and documentation.
Finally it is important to touch on the diverse properties offered by TLS survey or by image matching techniques. The first survey type requires non specialized ability and experiences to perform the acquisition phase and the data processing as well. On the other hand the use of image matching techniques requests high level of expertise in both in the acquisition process (conventional or non conventional platforms) and in all the photogrammetric process in order to achieve proper information. The use of the second methods request basically a
good knowledge in Geospatial science, and the ability to control narrowly every step of process.
The number of people involved in data acquisition and processing phases were almost the same; more than one operator was needed in the site in both methods since the good control of results accuracy depends on the measure of control points by topographical methodology. The substantial higher costs of TLS products depends on the higher cost of equipment.
5. CONCLUSION
The conclusion are focused on the image-matching techniques, since in the TLS acquisition and data-processing the typical processing steps have been adopted and a complete and continuous 3D model of the domus have been achieved without any particular problem.
Regarding the image-matching techniques it is possible to state that these systems are very promising and then their adoption is more and more successful and spread. After the widening from the land survey purposes to the lower range objects modeling, particularly the community devoted to CH conservation can benefit from passive sensors techniques. The profits meets the low costs of acquiring equipment (professional digital cameras costs about 1/10 than a scanner laser), the chance to use these systems in emergency conditions, the quick acquiring phase. The key point that sustain the great approval is the suitability to obtain versatile products, from which it’s possible to extract traditional representation or 3D models featured by high details level, accuracy, agreement of metric and photographic contents. The evaluation between equipment costs and higher level of expertise requested in passive sensors make us state that integrated methods are still recommended, but for their nature the passive sensors techniques are more sustainable in low resources field of study.
Acknowledgements
The authors wish to acknowledge the students Cristina Cartella and Francesca Cabodi for the cooperation in the accuracy tests. (Fig. 6)
6. REFERENCES
References from Journals:
Babbar, G., Bajaj, P., Chawla, A. & Gogna, M., 2010. Comparative Study Of Image Matching Algorithms. International Journal of Information Technology and Knowledge Management, Vol. 2, No. 2, pp. 337-339.
Brown, D.C.,1971. Close-range camera calibration. PE&RS, Vol. 37(8), pp.855-866.
Chiabrando, F., Chiabrando, R., Piatti, D., Rinaudo,F.,2009. Sensors for 3D imaging: metric evaluation and calibration of a CCD/CMOS time- of-flight camera. Sensors, vol. 9, no. 12, pp. 10 080–10 096.
Grün, A.,1985. Adaptive least square correlation: a powerful image matching technique. South African Journal of PRS and Cartography, Vol. 14(3), pp. 175-187.
Lowe, D.G., 2004. Distinctive Image Features from Scale-Invariant Keypoints. International journal of computer vision, Volume 60, Number 2, pp 91-110.
References from Books:
Vosselman, G., 1992. Relational matching. LNCS, Springer.
References from Other Literature:
Allen, P. K.,Troccoli, A., Smith, B., Murray, S., Stamos, I., Leordeanu, M., 2003. New methods for digital modelling of
historic sites. IEEE Computer Graphics and Applications, 23(6), pp. 32–41.
Baltsavias, E. P.,1991. Geometrically constrained multiphoto matching, Mitteilungen Nr. 49, Swiss Federal Institute of Technology (ETH), Zürich, Switzerland.
Boehler, W., Marbs, A., 2004. 3D scanning and photogrammetry for heritage recording: a comparison. Proceedings of the 12th International Conference on Geoinformatics, University of Gavle, Sweden, pp. 291–298.
Borgefors, G.,1988. Hierarchical chamfer matching: a parametric edge matching algorithm. IEEE Trans. PAMI, 10, 849–865.
Brown, M., Burschka, D., Hager, G., 2003. Advances in Computational Stereo, IEEE Transactions on Pattern Analysis and Machine Intelligence, Vol.25, NO.8.
Chiabrando, F., Costamagna, E., Spanò, A.T., Rinaudo F., 2010. Very close nadiral images: a proposal for quick digging survey. ISPRS Archives, XXXVIII/5, pp. 155-160.
Forstner W., 1986. A feature based correspondence algorithm for image matching. Proceedings of the Symposium from Analytical to Digital. Rovaniemi, Finland, pp.150-166.
Furukawa Y., Ponce, J., 2010. Accurate, Dense, and Robust Multi-View Stereopairs. IEEE Transactions on Pattern Analysis and Machine Intelligence, 32(8),pp. 1-14.
Gherardi, R., Toldo, R., Garro, V. Fusiello, A., 2011. Automatic camera orientation and structure recovery with Samantha. ISPRS Archives, International Workshop 3D-ARCH, on CD-ROM, Trento, Italy.
Harris, C., Stephen, M.,1999. A combined corner and edge detection, In M. M. Matthews, editor, Proceedings of the 4th ALVEY vision conference, University of Manchester, England pp. 147–151.
Hirschmuller, H., 2008. Stereo processing by Semi-Global Matching and Mutual Information. IEEE Transactions on Pattern Analysis and Machine Intelligence, 30(2), pp. 328–341.
Marr, D., Hildreth, E., 1980. Theory of edge detection. Proc. R. Soc. London , 207 pp. 187–217.
Pierrot-Deseillign, M., Paparoditis, N., 2006. A multiresolution and optimization-based image matching approach: An application to surface reconstruction from SPOT5-HRS stereoimagery. In IAPRS vol XXXVI-1/W41
Pierrot-Deseilligny, M. ,Clery, I.,2011. APERO, an Open Source Bundle Adjusment Software for Automatic Calibration and Orientation of a Set of Images ISPRS Archives, International Workshop 3D-ARCH, on CD-ROM, Trento, Italy.
Rapp, H., 2007. Experimental and theoretical investigation of correlating ToF- camera systems. Master’s thesis, University of Heidelberg.
Remondino, F., Menna, F., 2008. Image-Based surface measurement for close-range heritage documentation.ISPRS Archives, Beijing, Vol. XXXVII, Part B5, pp. 199-206.
Torre, V., Poggio, T.A., 1980. On edge detection. IEEE Trans. Pattern Anal. Machine Intell.,pp. 147–163
References from websites:
Vedaldi, A., 2010. www.vlfeat.org/~vedaldi/code/siftpp.html.