SOLID IMAGE EXTRACTION FROM LIDAR POINT CLOUDS
D. Munaretto a, M. Roggero b
b Politecnico di Torino, Dipartimento di Architettura e Design, Torino, [email protected]
KEY WORDS: point clouds, laser scanner, solid image
ABSTRACT:
In laser scanner architectural surveying it is necessary to extract orthogonal projections from the tridimensional model, plans, eleva-tions and cross seceleva-tions. The paper presents the workflow of architectural drawings production from laser scans, focusing on the or-thogonal projection of the point cloud on solid images, in order to avoid the time consuming surface modeling, when it is not strictly necessary. The proposed procedures have been implemented in fortran90 and included in the VELOCE software package, then tested and applied to the case study of the San Pietro church in Porto Venere (SP), integrating the architectural surveying with an existing bathymetric and coastal surveying.
1. INTRODUCTION
In laser scanner architectural surveying it is necessary to extract orthogonal projections from the tridimensional model, plans, elevations and cross sections. The paper presents the workflow of architectural drawings production from laser scans. Because of the surface modeling take a considerable amount of time (about the 30% of the total workflow) and a huge computational load, we propose to extract the architectural drawings directly from point clouds, avoiding the surface modeling step. Moreo-ver the surface modeling generally produce a loss of the finest details, that in this way can be retained.
The geometric procedures to extract the orthogonal projections of point clouds will be defined. The products of these projec-tions however are not traditional drawings, but are in the form of solid images. The solid image (or 3D image) is a concept in-troduced in photogrammetry by Prof. S. Dequal in 2003. While in a traditional bi-dimensional digital color image, consisting in a 3 band pixel-matrix, the RGB information is stored, in a 3D image a fourth band is required to store the third dimension, for example the distance from the section plane. A fifth band has also been used to store the surface reflectivity measured by the laser scanner.
The algorithms have been implemented in fortran90 and includ-ed in the VELOCE1 software package (Manzino & Roggero, 2002). VELOCE is intended for batch processing of large data sets. The software born in 2000 to process large airborne LIDAR data sets, and includes algorithms for point cloud filter-ing and segmentation. Later it has been adapted to terrestrial laser scans, including several functions for point cloud man-agement, filtering and projection. VELOCE is actually available under GNU license for academic users, but new personalized functions can be implemented also for commercial users. The studied procedures have been applied to the case study of the San Pietro church in Porto Venere (SP), integrating the ar-chitectural surveying with an existing bathymetric and coastal surveying, realized by Istituto Idrografico della Marina Militare and Codevintec in 2006. The survey consists of 15 scans in the interior and of 20 scans in the exterior, for a total of 743 mil-been produced a video of the scanned point cloud, representing the San Pietro promontory, that is intended to be used by the Comune di Porto Venere for touristic promotion and divulga-tion purposes.
2. POINT CLOUD PROCESSING
In laser scan surveying production the largest amount of time is required by point cloud processing. This phase usually takes the 60÷80% of time of the entire work, while the surveying cam-paign is much less time consuming. This leads to an optimiza-tion of the entire surveying workflow, reducing the cost of the campaign and moving the human resources to the post pro-cessing phase.
The point cloud processing includes all the software operations that are needed to fit the customer requirements (i.e. textured
EXPORT data in the format required for processing
POINT CLOUDS
3D model, solid images, ortophoto, drawings, plans, elevations and cross sections, etc.). The workflow required in Fig. 1 rough-ly shows the processing time required by the different pro-cessing phases. The mesh computation with the necessary cleaning, hole filling, smoothing and texturing, takes about 40÷45% of processing time.
Because of all the geometric and radiometric information are already contained in the point cloud, we can avoid surface mod-eling, when the 3D model is not explicitly required by the cus-tomer. On the other hand, point clouds are not suitable for a quick extraction of vector drawings; for this reason the most of commercial software require surface modeling in order to ex-tract cross sections. The present work will suggest an alternative way, that we have applied to architectural surveying.
3. POINT CLOUD PROJECTION ON SOLID IMAGES The three-dimensional model (mesh surface or point cloud) is used to extract the final products, that usually can be vector drawings or ortophotos. Because of the traditional ortophoto of a point cloud is simply an orthogonal projection of the colored points onto a plane, its limit is that the third dimension is lost, while using the concept of solid ortophoto (Bornaz, Dequal, & Lingua, 2006), the third dimension is paired to the radiometric information: a fourth band is coupled to the three RGB bands, with the same spatial resolution, in order to store the distance of the points from a reference surface.
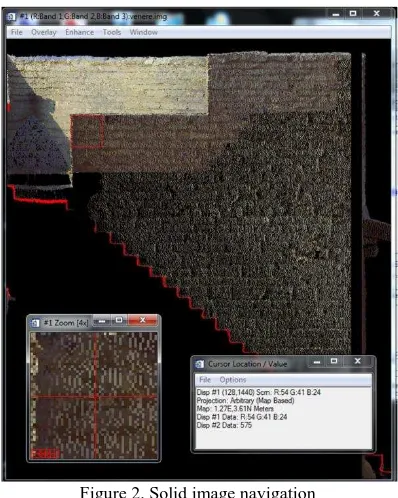
Figure 2. Solid image navigation
VELOCE produces 6 band solid images with this band struc-ture:
The R, G, B color components are stored in the 1st, 2nd and 3rd band, as short unsigned integers (1 byte per band). The laser intensity is stored in the 4th band as short
un-signed integers (1 byte).
The distance from the projection plane is stored in the 5ft band, as long signed integer (2 byte).
A 6th band can be used to record the number of scanned point projected in the pixel (scan density); to store this in-formation 1 byte is enough.
The memory used by this data structure is 7 bytes per pixel.
In the case of horizontal cross sections (plans, projection of vaults) the third dimension can be the orthometric height of points, while in the case of vertical cross sections or elevations, it can simply be the distance from the projection plane.
Navigating the solid image the three dimensional coordinates of the points can be visualized or used to measure distances or an-gles2. An example is given in Figure 2.
3.1 Point cloud pre-processing and bounding box definition We suppose to use registered and filtered point clouds, in carte-sian coordinates x, y and z. The bounding box will be defined
The VELOCE software can import binary or ASCII files in .pts or .ptx format. The data are archived in binary format designed in order to have the maximum data compression and a fast ac-cess to the information, as described in (Manzino, Roggero, 2002). Because of the coordinates are stored as REAL3 (4 byte), a shift (xT, yT, 0) is applied to the E and N components in order to contain the values inside the limit range; in the following ex-ample:
Tab. 1. Raw data imported from *.pts format file
1 0,000 0,000 73,502 90 69 63 63
Tab. 2. Raw data in the VELOCE *.raw format (binary file, after horizontal shift)
When the data are exported, the opposite shift (-xT, -yT, 0) is applied to compute the original cartographic coordinates. The VELOCE raw binary format includes some header record, where are recorded the number of points, the bounding box and horizontal shift.
The solid image is initialized with the following values: The background color is assigned to the R, G, B bands
(1st, 2nd and 3rd band)
The value 0 is assigned to the 4th band, the laser intensity To the 5ft band, the distance from the projection plane, is
assigned the maximum value of a long signed integer (32767). The distances will be then recorded in cm, up to the limit of 327.67 m, that is enough for the architectural applications.
To the 6th band is assigned the value zero.
3.2 Cross sections
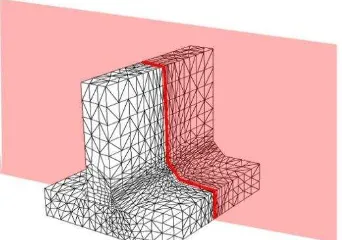
Most of commercial software compute the cross section as the intersection between the mesh surface and a plane, as in Figure 3.
2
The VELOCE software exports solid images in binary format, that can be visualized by ENVI.
3
floating point IEC 559 (IEEE)
Figure 3. Cross section from the mesh surface model
Because of the point cloud is, by definition, a set of adimensional entities, it is not possible to intersect it with a plane, but it is possible to find the points within a given distance dz from the intersecting plane itself, as in Figure 4.
Figure 4. Cross section from the point cloud
The points in the interval dz will be considered as coplanar and used to define the cross section line. The interval dz must be defined by the user, and it depends on the point density. When a point it is find to be in the interval dz, the corresponding pixel on the solid image is colored in red (or in black or in another user defined color), while when a point is out of the dz interval, it is projected with its proper color.
Figure 5. Discretized cross section projected from the point cloud on the solid image
We have seen as the distance band is initialized at the value 32767 (327.67 m), then the scanned points are sequentially red from the raw file and projected onto the solid image, with the following criteria:
If the solid image pixel is void, the point is projected on the pixel
If the solid image pixel is not void and the distance of the new point is lower than the distance in the 5th band, the point is projected on the pixel
When the algorithm finds non hidden points to be projected, the pixel values in the solid image are updated, as shown in the fol-lowing example of a plans generated by an horizontal section at the height of 1.5 m. Consider this points that are projected in the same image pixel:
The algorithm read the point 56 and verify that is under (or be-hind) the section plane:
z56 < 1.50 m
z56 > -327.67 m
This is verified, so the value z56 = -1277 is written in the solid image and the 6 bands are updated as follows:
R(36) G(24) B(33) (-1535) z(-1277) n(1) Than the point 10 is red and
z102 = -3 mm
z102 > z56
So the solid image pixel is updated and overwritten as follows: R(38) G(23) B(32) (-1503) z(-3) n(2).
The point 388 is skipped because the condition z388 > z102 it is not verified. The point 5735 is accepted and used, while the points 8290 and 9006 are skipped, because the condition z8920, z9006 < 1500 mm it is not verified. Finally the point 9197 is used and overwritten to the previous values as follows:
R(90) G(84) B(80) (929) z(1498) n(3). Fixing dz = 50 mm, the point 9197 is in the interval
1500 > z > 1500-dz = 1450
so the pixel must be colored in red and the RGB values updated: R(255) G(0) B(0) (929) z(1498) n(3).
The solid image is recursively updated up to the end of the raw data file.
The position of a pixel in the multi-band image is given by the pointer the raw data file and an a priori unknown number of image pix-els updates. Because of the points are registered by the scanner in a sequential order following the scanning path, it is possible to speed up the process neglecting some points when they can be considered not necessary (hidden points). We use the follow-ing algorithm to skip a number j of points:
If the point is behind the cross section plane, then j is zero. In this case all the following points will be se-quentially red and processed
tance from the plane is large, so we can skip some points. The number j of point to skip can be
where d is the distance from the cross section plane and d the increment in this distance.
In any case the number j must be limited to a maximum (i.e. jmax = 500) in order to avoid to go back behind the cross section plane too rapidly, loosing non hidden points. The Figure 6 ex-emplifies how the algorithm works. Suppose to produce an hor-izontal section at the height zsez. The algorithm read the point 1; it is ahead the section plane, so it must not be projected and probably we can skip some points. It is necessary to read the point 2 to compute d and j; in the example we skip 201 points and jump to the point 204. It is now necessary to know how the scanning path is approaching the section plane, recomputing d and j, so we need the point 205. The method allows to skip a large number of points, avoiding a lot of slow READ instruc-tion. Only when the scanned points approach the section plane or when we are behind the plane, it is necessary to process all the points.
Figure 6. Raw data sequential processing and skipped points
The algorithm is analogous both for horizontal and vertical cross section (as in the example in Figure 2). In the case of ver-tical cross sections or elevations, it can be useful define partial or broken out sections. Also a vertical section can be orthogo-nally project on plans with different orientation, as shown in Figure 7, where a vertical cross section is defined by the hori-zontal polyline on the (x, y) plane. The order of the polyline vertex defines the orientation of the view, conventionally on the left following the polyline path.
Figure 7. Plan of the projection on a broken vertical section plane: the cross section is in the middle line of a building.
In the case of vertical cross sections the coordinates of a point (x, y, z) are projected in the point (xp, yp, z), belonging to the projection plane. If the vertical section plane is broken, also with different planes orientations, the first question is on which plane the point must be projected, the second one is the compu-tation of the projected horizontal coordinates (xp, yp).
At first we compute the horizontal distance between the point Pi the po e verte , Po , Po 2, …, Po N, the we ook
for the two nearest vertex (Poly1 and Poly2 in the example). These two vertex identify the vertical plane on which the point Pi must be projected.
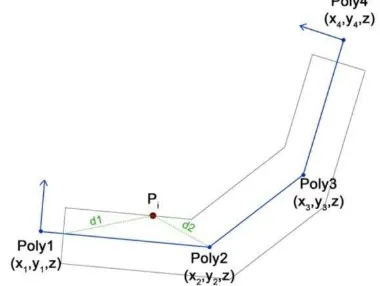
Figure 8. Projection of a point on a segment
The Figure 8 shows how to compute the horizontal coordinates
of the proje te po t. It’s e s to wr te, the for y = mx + c, the equation of the line passing through Poly1 and Poly2 (tan-gent line T), and of the line passing through Pi and normal to the segment Po Po 2 (normal line N). The coordinates of the projection are given by the intersection between these two lines. The angular coefficients are given by
Po 2 Po
Po 2 Po
N
and the two constant terms by
cT = yPoly1 - mT xPoly1 cN = yP - mN xP
the horizontal coordinates of the projected point follows:
IN N N IN N IN N
The distance of the point Pi from the projection plane (or from the projection point) cannot be simply computed as a module using the Pitagora theorem, because it is necessary to determine if the point is behind or ahead the projection plane. It is neces-sary to define a new coordinate system (xI, yI), with origin in (xINT, yINT) and orientation of the yI axis toward Pi. the coordi-nates of Pi in this new system are given by the transformation
P I
P
I P
IN P IN
where R is the rotation matrix given by
os s
-s os r t
While PI by definition, PI represents the distance of Pi from the projection plane, and will be stored in the band 5 of the solid image. Finally the position of the point in the image must be computed:
,P
P
res
s,P
f
res
where:
,P Number of line of the point Pi
,P Number of column of the point Pi
maximum z value of the bounding-box zP coordinate z of the point Pi
xf Progressive coordinate along the polyline res Image resolution (side of the pixel)
3.3 Tools for image enhancement
The obtained solid image obviously presents some lack of data, imperfections due to picture exposure and projections of distant or hidden objects. These shortcomings can be repaired to some extent, in order to make a more acceptable and readable image.
Figure 9. Solid image with lack of data filled
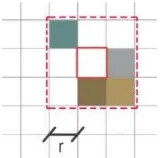
Lack of data in the point cloud can produce non colored pixels or pixels erroneously colored by projecting hidden points. Both cases are shown in Figure 2, and depends on the point density with respect to the image resolution. To correct for lack of data the VELOCE software scans the entire image with a 3x3 search matrix, loading both the RGB and the distance information. At first on the 9 elements of the search matrix it is computed the minimum distance dmin, then the pixel for which d > dmin + (2÷3)·res are considered hidden points and canceled out. If at this stage the central pixel of the search matrix is void, it is filled with a mean value of the other non void pixels, as shown in Figure 10.
Figure 10. Search matrix used to correct for lack of data. The search radius r is normally set to 1.
The central pixel is filled only if a minimum of point in the search matrix is colored, in this case we use a threshold of 20%. The result is shown in Figure 9.
To improve the readability of the image it is also possible to use color mapping, in order to represent the point that are far from the projection plane with a modified brightness or tone. VELOCE allows to fix a distance z1 from the section plane be-yond which the points are represented by a modified color, and a maximum distance z2 to completely exclude far objects. These distance intervals are represented in Figure 11. Color mapping can also be used in topographic surveying, to represent the ground heights in a DTM.
Figure 11. Distance intervals from the section plane; between dz and z1 the point are represented in real colors, between z1
and z2 are represented in modified colors.
In the interval z1÷z2 the color is modified in function of the pa-rameter
2
that ranges from 0 to 1. The color RGB is transformed in the HSL system (Hue, Saturation, Lightness), so it is possible to modify one of these three components, in function of the de-sired graphic effect. For example, if we want to vanish the far points into a black background, we can modify the lightness by
L = L (1 - d)
In this way the lightness remain unchanged for z = z1, and it is null for z = z2. Finally the RGB components are updated.
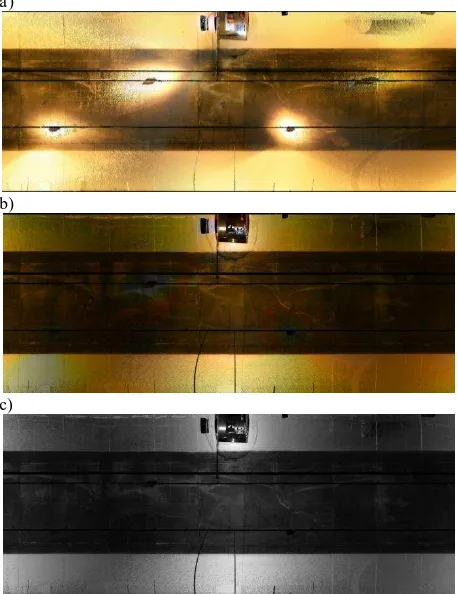
Another tool for image enhancement has been developed to cor-rect overexposures. Photographic images acquired by an inte-grated camera are commonly used by laser scanners to colorize the scan points. The integrated camera exposure is automatical-ly set by the scanner firmware over a mean vale for the spheri-cal panorama. This results obviously in some overexposed im-ages, in the direction of lights, windows or sun. The Figure 12 shows a scan of the ceiling of a tunnel, where around the light projectors the image is clearly overexposed. Image exposure has been corrected by substituting the lightness L with the laser in-tensity; then the RGB values have been updated obtaining a much more readable color image.
a)
b)
c)
Figure 12. Scan of the ceiling of a tunnel in cylindrical projec-tion. The RGB image (in a) is overexposed around the light projectors, while the laser intensity (in c) is perfectly readable. In the b image the RGB lightness is tuned according to the la-ser intensity.
4. THE CASE STUDY: THE SAN PIETRO CHURCH IN PORTO VENERE (SP)
4.1 The survey campaign
The VELOCE software has been used in a large number of aeri-al surveys, but to test it on terrestriaeri-al scans we used the case study of the San Pietro church in Porto Venere (SP), where it has been possible to acquire laser scans of the architectural ob-ject and of the surroundings. In the same area we had the data of the survey carried out by Codevintec4 in collaboration with Istituto Idrografico della Marina Militare5, that covers the entire area of the San Pietro promontory and of the seabed of the Porto Venere bay, between the seaside and the Palmaria island. A sur-vey campaign on the church has been done by Codevintec in 2006 using an ILRIS 3D terrestrial laser scanner, while in 2008 it has been done the bathymetric and coastal survey, by an ILRIS MC (motion compensation) laser scanner and a SWATHPlus-H interferometric multibeam. During our cam-paign in 2012, the survey of the church has been completely redone by a FARO CAM2 Laser Scanner Focus3D, acquiring 15 scans inside the church (with resolution of 6 mm at 10 m) and 20 scans outside the church (with resolution of 3 mm at 10 m); the apparently higher resolution of the outdoor scans is due to an higher scan distance. Merging the new survey with the pre-vious surveys, we obtained a georeferenced point cloud of about
4
http://www.codevintec.it/ 5
http://www.marina.difesa.it/conosciamoci/comandienti/scientif ici/idrografico/Pagine/home.aspx
743 millions of points. For many commercial software it is al-most impossible to process such amount of data in a single block. VELOCE can manage huge amounts of data that are lim-ited only by the hard disk capacity, with quite acceptable pro-cessing time. We have tested the software on a laptop equipped by an Intel CoreTM i7 and 8 GB of RAM. The point cloud has been converted in the RAW binary format in about 40 minutes, while the rendering of a single solid image of about 100 mega-pixels takes 15÷30 minutes.
4.2 Results
As example some results are shown. Figure 13 represents the raw solid image of a cross section exported by VELOCE. In this case the image have been enhanced repairing it only for lack of data, while color saturation and lightness have been leaved un-changed.
Figure 13. The raw solid image exported by VELOCE
The raw solid image has been then edited by a photo editing software; it is notable that the three RGB bands of the solid im-age can be treated as a common photographic imim-age. Editing involved the removal of hidden points and the inclusion of a pattern.
5. CONCLUSIONS
The goal that we set for this study, namely the extraction of drawings directly from the point cloud, has been fully achieved: while following the classical canons of the architectural draw-ings, we were able to preserve, through the solid image, the three-dimensional content that is intrinsic in laser scanner sur-veys.
This does not mean that the work is done here, on the contrary, have emerged still several areas to work on. It is still necessary to improve some aspects of the solid image graphics, the expo-sure tuning and the vectorization of the section line.
6. REFERENCES
Lingua, A., Agosto, E., & Del Bianco, P., 2007. L'ortofoto soli-da di precisione a grandissima scala in ambito urbano. In: XI conferenza nazionale ASITA, (vol. 2, pp. 1373-1378), Torino, Italy, ISBN 9788890313202
Bornaz, L., Dequal, S. & Lingua, A., 2006. L'ortofoto solida di precisione: un prodotto innovativo per la rappresentazione e la gestione dei dati tridimensionali. In: Atti Conferenza Nazionale SIFET, Palermo, Italy, ISBN 8890193921
Bornaz, L. & Dequal, S., 2003. A new concept: the solid image. In: International Archives CIPA N°XIX-2003 Vol. 1 ISPRS Vol. XXXVI-5/C34. CIPA 2003 XIXth International Sympo-sium. Antalia (Turchia). 30 settembre – 04 ottobre 2003. (vol. 1, pp. 169-174). ISBN/ISSN: 975-561-245-9 / 0256-1840.
Manzino, A. & Roggero, M., 2002. Il trattamento informatico del dato laser. In: La tecnica del laser scanning, teoria ed appli-cazioni, pp. 39-74, Udine, Italy, ISBN: 888513727X
Roggero, M., 2000. Scansione laser da piattaforma aerea. Trat-tamento e analisi dei dati, thesis.