LAMPIRAN A
PERCOBAAN VALIDASI METODE ANALISA PROPRANOLOL HCL
1. Penentuan Kurva Baku
Berikut ini adalah data dari kurva baku selama tiga hari berturut – turut C1 (µg/ ml) A1 C2 (µg/ ml) A2 C3 (µg/ ml) A3 5,1 0,085 5 0,002 5 0,09 10,2 0,18 10 0,088 10 0,173 15,3 0,259 15 0,185 15 0,253 20,4 0.387 20 0,272 20 0,362 25,5 0,472 25 0,375 25 0,466 30,6 0,503 30 0,528 30 0,643 35 0,622 35 0,698 40 0,697 40 0,815 45 0,794 45 0,877 50 0,883 50 0,925
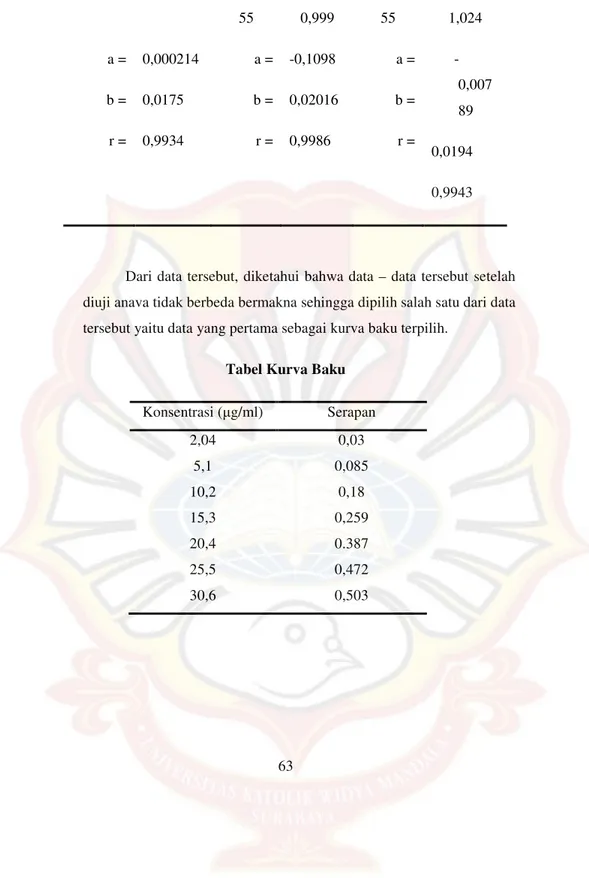
55 0,999 55 1,024 a = b = r = 0,000214 0,0175 0,9934 a = b = r = -0,1098 0,02016 0,9986 a = b = r = -0,007 89 0,0194 0,9943
Dari data tersebut, diketahui bahwa data – data tersebut setelah diuji anava tidak berbeda bermakna sehingga dipilih salah satu dari data tersebut yaitu data yang pertama sebagai kurva baku terpilih.
Tabel Kurva Baku Konsentrasi (µg/ml) Serapan 2,04 0,03 5,1 0,085 10,2 0,18 15,3 0,259 20,4 0.387 25,5 0,472 30,6 0,503
1. Perhitungan LOD dan LOQ
LOD diperoleh dari rumus Q = 3 Sy/x / b, sedangkan LOQ diperoleh dari
rumus Q = 10 Sy/x / b. C A Yi Yi - Yt ( Yi - Yt )2 2,04 0,03 0,03599 0,00599 3,588E-05 5,1 0,085 0,08968 0,00468 2,19E-05 10,2 0,18 0,1791 -0,0009 8,1E-07 15,3 0,259 0,2686 0,0096 9,216E-05 20,4 0.387 0,3581 -0,0289 8,3521 E-04 25,5 0,472 0,4475 -0,0245 6,0025 E-04 30,6 0,503 0,5369 0,0339 1,1492 E-03 Jumlah 2,73535 E-03
Sy/x =
= 0,023389527
Nilai b diperoleh dari kurva baku = 0,0175 LOD = 3 Sy/x / b
= 4,0096 µg/ml LOQ = 10 Sy/x / b
2. Uji Akurasi Penimbangan C teoritis ( µg/ml ) Serapan C pengamatan ( µg/ml ) % recov ery 50 mg/ml 30 0,518 29,52 98,4 50 mg/ml 30 0,527 30,03 100,1 50 mg/ml 30 0,523 29,80 99,3 50 mg/ml 30 0,528 30,09 100,3 49 mg/ml 30 0,517 29,46 98,2 51 mg/ml 30 0,531 30,26 100,9
Rata – rata % recovery = ( 98,4 + 100,1 + 99,3 + 100,3 + 98,2 + 100,9) / 6 = 99,53 ± 1,37
3. Uji Presisi C teoritis ( µg/ml) Serapan C pengam atan ( µg/ml) % recovery 30 0,670 38,1825 127,275 30 0,644 36,7 122,333 30 0,671 38,2395 127,465 30 0,664 37,8404 126,1347 30 0,641 36,5292 124,2493 30 0,687 39,1516 127,946
Rata – rata % recovery = ( 127,275 + 122,333 + 127,465 + 126,1347 + 124,2493 + 127,946 ) / 6
= 125,9005 SD = 2,1922
KV = x 100%
LAMPIRAN B
DATA – DATA DAN PERHITUNGAN MOISTURE CONTENT Formula (-1)
W1 (gram) W2 (gram) ( W1 – W2) % moisture content 0,3494 0,3387 0,0107 3,06 % 0,3578 0,3462 0,0116 3,24 % 0,3542 0,3388 0,0154 4,46 % Rata – rata 3,58 ± 0,88 % Formula (a)
W1 (gram) W2 (gram) ( W1 – W2) % moisture content
0,5202 0,5096 0,0106 2,04 %
0,5173 0,5064 0,0109 2,11 %
0,5187 0,5059 0,0128 2,47 %
Formula (b)
W1 (gram) W2 (gram) ( W1 – W2) % moisture content 0,8177 0,7862 0,0315 3,85 % 0,8190 0,7845 0,0345 4,21 % 0,8219 0,7913 0,0306 3,72 % Rata – rata 3,93 ± 0,28 % Formula (ab)
W1 (gram) W2 (gram) ( W1 – W2) % moisture content
0,9673 0,9417 0,0256 2,65 %
0,9513 0,9294 0,0219 2,30 %
0,9534 0,9267 0,0267 2,80 %
Anova: Single Factor SUMMARY
Groups Count Sum Average Variance
Column 1 3 10.76 3.586667 0.580133 Column 2 3 10.89 3.63 0.0889 Column 3 3 11.78 3.926667 0.064433 Column 4 3 14.03 4.676667 0.040533 ANOVA Source of
Variation SS df MS F P-value F crit
Between
Groups 2.2887 3 0.7629 3.942636 0.053608 4.066181 Within
Groups 1.548 8 0.1935
LAMPIRAN C
JUMLAH PROPRANOLOL HCL YANG MELINTASI MEMBRAN SEBAGAI FUNGSI AKAR WAKTU
Waktu (meni
t)
Jumlah proranolol HCl yang melintasi membran ( µg/ml) (-1) (a) (b) (ab) 15 31,6259 23,8163 3,03539 8,61634 30 43,5116 25,0163 8,94015 9,20682 45 54,1592 26,6925 36,454 10,0259 60 63,89253 33,0354 60,7306 10,5021 90 67,14968 36,6163 71,7973 11,0735 120 71,93063 42,883 80,5973 13,5687 150 82,71158 44,1973 105,207 20,6735 180 86,02587 53,8354 111,931 32,7116 210 96,38777 56,7116 122,654 34,6354 240 104,8259 73,3402 117,073 44,6354 270 98,57825 89,4544 111,435 45,664 300 94,88301 94,4449 105,226 44,0449 360 66,5592 53,9497 71,7402 29,4354 Data merupakan rata – rata tiga kali replikasi
LAMPIRAN D
JUMLAH PROPRANOLOL HCL YANG MELINTASI MEMBRAN SEBAGAI FUNGSI WAKTU
Waktu (menit)
Jumlah proranolol HCl yang melintasi membran ( µg/ml)
(-1) (a) (b) (ab) 15 -0,01223 4.1592 3.092533 3.054438 30 3.968724 5.016343 5.606819 7.187771 45 5.149676 5.397295 7.892533 7.587771 60 6.86396 7.930629 11.68301 8.311581 90 7.62587 8.787771 12.5973 10.33063 120 8.57825 8.738248 13.60682 10.82587 150 11.0163 10.40682 16.5973 14.31158 180 12.3878 11.66396 17.30206 21.3973 210 13.3973 12.04491 18.9592 26.78777 240 16.3878 13.11158 20.73063 33.7973 270 19.6449 15.77825 24.21634 35.94968 300 26.3687 17.28301 31.28301 40.31158 330 30.2544 22.1973 31.85444 47.68301 360 33.5878 22.73063 37.56872 45.3592 Data merupakan rata – rata tiga kali replikasi
LAMPIRAN E
PERHITUNGAN ANAVA UNTUK MODEL PELEPASAN
Response1 PELEPASAN
ANOVA for selected factorial model Analysis of variance table [Partial sum of squares -
Type III]
Sum of Mean F p-value
Source Squares df Square Value Prob> F Model 34.66 3 11.55 5172.82 < 0.0001 A-HPMC 18.65 1 18.65 8350.81 < 0.0001
B-PROPILEN
GLIKOL 1.18 1 1.18 527.52 < 0.0001 AB 14.83 1 14.83 6640.13 < 0.0001 Pure Error 0.018 8 2.233E-003
Cor Total 34.68 11
The Model F-value of 5172.82 implies the model is significant. There
is only
a 0.01% chance that a "Model F-Value" this large could occur due to noise.
Values of "Prob > F" less than 0.0500 indicate model terms are significant.
In this case A, B, AB are significant model terms.
Values greater than 0.1000 indicate the model terms are not significant. If there are many insignificant model terms (not counting those
required to support hierarchy),
model reduction may improve your model.
Std. Dev. 0.047 R-Squared 0.9995 Mean 5.23
Adj R-Squared 0.9993
C.V. % 0.90 Pred R-Squared 0.9988 PRESS 0.040 Adeq Precision 172.870
The "Pred R-Squared" of 0.9988 is in reasonable agreement with the
"Adj R-Squared" of 0.9993.
"Adeq Precision" measures the signal to noise ratio. A ratio greater
than 4 is desirable. Your
ratio of 172.870 indicates an adequate signal. This model can be used to navigate the design space.
Final Equation in Terms of Coded Factors: PELEPASAN =
+5.23
-1.25 * A
+0.31 * B
LAMPIRAN F
PERHITUNGAN ANAVA UNTUK MODEL PENETRASI
Response 2 PENETRASI
ANOVA for selected factorial model Analysis of variance table [Partial sum of
squares - Type III]
Sum of Mean F p-value
Source Squares df Square Value Prob > F Model 0.010 3 3.449E-003 537.43 < 0.0001 A-HPMC 9.075E-005 1 9.075E-005 14.14 0.0055
B-PROPILEN
GLIKOL 5.334E-00 1 5.334E-003 831.29 < 0.0001 AB 4.921E-003 1 4.921E-003 766.87 < 0.0001 Pure Error 5.133E-005 8 6.417E-006
Cor Total 0.010 11
The Model F-value of 537.43 implies the model is significant. There is only
a 0.01% chance that a "Model F-Value" this large could occur due to noise.
Values of "Prob > F" less than 0.0500 indicate model terms are significant.
In this case A, B, AB are significant model terms.
Values greater than 0.1000 indicate the model terms are not significant. If there are many insignificant model terms (not counting those
required to support hierarchy),
model reduction may improve your model.
Std. Dev. 2.533E-003 R-Squared 0.9951 Mean 0.088 Adj R-Squared 0.9932 C.V. % 2.88 Pred R-Squared 0.9889 PRESS 155E-004 Adeq Precision 56.524
The "Pred R-Squared" of 0.9889 is in reasonable agreement with the "Adj R-Squared" of 0.9932.
"Adeq Precision" measures the signal to noise ratio. A ratio greater
than 4 is desirable. Your
ratio of 56.524 indicates an adequate signal. This model can be used to
navigate the design space.
Final Equation in Terms of Coded Factors:
PENETRASI= +0.088
+2.750E-003 * A
+0.021 * B
LAMPIRAN G KONDISI UJI OPTIMAL
Lower Upper Lower Upper Name Goal Limit Limit
Weight Weight A:HPMC is in range -1 1 1 1 B:PROPILEN GLIKOL is in range -1 1 1 1 PELEPASAN maximize 3.18 7.95 1 1 PENETRASI maximize 0.048 0.133 1 1 Solutions
No. HPMC PROPILEN PELEPASAN PENETRASI Desirability GLIKOL 1 -0.82 1.00 7.48561 0.0900414 0.668 2 -0.80 1.00 7.4365 0.0905203 0.668 3 -0.86 1.00 7.58092 0.0891118 0.668 4 -0.76 1.00 7.32273 0.0916299 0.668 5 -0.90 1.00 7.66607 0.0882814 0.668