62
7.
LAMPIRAN
7.1.
Syarat Mutu Mikrobiologis Ayam SNI 7388:2009
No. Jenis Cemaran Mikroba
Satuan
Persyaratan
1.
Total Mikroba (
Total Plate Count
) CFU/g
Maksimum 1x10
6
2.
Koliform
CFU/g
Maksimum 1x10
2
3.
Salmonella sp.
Per 25 g
Negatif
4.
Staphylococcus aureus
CFU/g
Maksimum 1x10
2
5.
Escherichia coli
CFU/g
Maksimum 1x10
1
6.
Campylobacter sp.
Per 25 g
Negatif
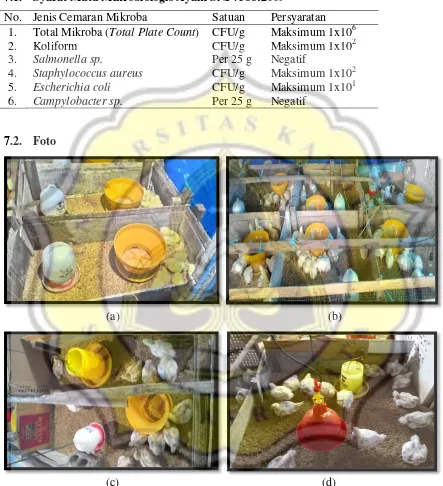
7.2.
Foto
(a)
(b)
(c)
(d)
Gambar 13. Perkembangan dan Pertumbuhan Hewan Uji: (a)
Day Old Chicken
(DOC), (b)
7.3.
Hasil Analisa Data
Lampiran 1. Tabel Hasil Uji Normalitas Kadar Air, pH dan Aw Tiap Bagian Daging Ayam
Tests of No rmal ity
.308 5 .137 .854 5 .207
.240 5 .200* .944 5 .698
.144 5 .200* .993 5 .988
.198 5 .200* .925 5 .564
.293 5 .185 .909 5 .460
.218 5 .200* .906 5 .446
.275 5 .200* .927 5 .577
.138 5 .200* .986 5 .966
.220 5 .200* .924 5 .554
.192 5 .200* .919 5 .522
.236 5 .200* .955 5 .774
.153 5 .200* .989 5 .975
.232 5 .200* .918 5 .515
.280 5 .200* .914 5 .490
.213 5 .200* .895 5 .380
.164 5 .200* .991 5 .983
.253 5 .200* .934 5 .627
.279 5 .200* .859 5 .225
.225 5 .200* .942 5 .678
.149 5 .200* .994 5 .991
.173 5 .200* .974 5 .897
.191 5 .200* .961 5 .815
.328 5 .084 .836 5 .155
.286 5 .200* .856 5 .213
.295 5 .180 .888 5 .346
.199 5 .200* .949 5 .729
.261 5 .200* .933 5 .619
.200 5 .200* .949 5 .731
.320 5 .105 .843 5 .174
.338 5 .063 .806 5 .090
dos is dos is 0 dos is 1 dos is 5 dos is 10 dos is 50 dos is 0 dos is 1 dos is 5 dos is 10 dos is 50 dos is 0 dos is 1 dos is 5 dos is 10 dos is 50 dos is 0 dos is 1 dos is 5 dos is 10 dos is 50 dos is 0 dos is 1 dos is 5 dos is 10 dos is 50 dos is 0 dos is 1 dos is 5 dos is 10 dos is 50 dada_0
paha_0
say ap_0
dada_5
paha_5
say ap_5
Stat is tic df Sig. Stat is tic df Sig.
Kolmogorov -Sm irnova Shapiro-Wilk
This is a lower bound of the true signif ic ance. *.
Tes ts of No r mal ity
.1 36 5 .2 00* .9 87 5 .9 67
.2 15 5 .2 00* .9 33 5 .6 16
.2 27 5 .2 00* .9 15 5 .4 97
.3 13 5 .1 22 .8 20 5 .1 17
.2 41 5 .2 00* .9 52 5 .7 49
.2 33 5 .2 00* .9 44 5 .6 93
.2 47 5 .2 00* .8 91 5 .3 61
.1 97 5 .2 00* .9 21 5 .5 39
.2 72 5 .2 00* .8 56 5 .2 13
.1 73 5 .2 00* .9 70 5 .8 75
.2 24 5 .2 00* .8 42 5 .1 71
.1 96 5 .2 00* .9 68 5 .8 59
.2 23 5 .2 00* .9 25 5 .5 65
.2 22 5 .2 00* .9 45 5 .7 01
.1 41 5 .2 00* .9 79 5 .9 28
.1 57 5 .2 00* .9 90 5 .9 79
.2 94 5 .1 81 .8 25 5 .1 27
.2 26 5 .2 00* .9 12 5 .4 78
.2 41 5 .2 00* .9 08 5 .4 58
.1 75 5 .2 00* .9 74 5 .8 99
.1 72 5 .2 00* .9 65 5 .8 44
.1 98 5 .2 00* .9 57 5 .7 87
.2 13 5 .2 00* .9 63 5 .8 26
.2 56 5 .2 00* .9 33 5 .6 20
.2 08 5 .2 00* .9 67 5 .8 59
.1 80 5 .2 00* .9 42 5 .6 77
.2 62 5 .2 00* .8 68 5 .2 58
.1 59 5 .2 00* .9 90 5 .9 80
.1 47 5 .2 00* .9 95 5 .9 94
.2 61 5 .2 00* .8 59 5 .2 23
dos is dos is 0 dos is 1 dos is 5 dos is 10 dos is 50 dos is 0 dos is 1 dos is 5 dos is 10 dos is 50 dos is 0 dos is 1 dos is 5 dos is 10 dos is 50 dos is 0 dos is 1 dos is 5 dos is 10 dos is 50 dos is 0 dos is 1 dos is 5 dos is 10 dos is 50 dos is 0 dos is 1 dos is 5 dos is 10 dos is 50 dad a_0
pah a_0
say ap _0
dad a_5
pah a_5
say ap _5
Stat is tic df Sig. Stat is tic df Sig.
Kolmo goro v -Sm irno va Shapiro-Wilk
This is a lower boun d of the tru e sign if ic ance. * .
Lillief ors Signif icance Correc tion a.
Tes ts of No rmali ty
.2 11 5 .2 00* .9 65 5 .8 44
.1 64 5 .2 00* .9 81 5 .9 42
.1 57 5 .2 00* .9 90 5 .9 79
.1 89 5 .2 00* .9 62 5 .8 23
.2 58 5 .2 00* .9 02 5 .4 19
.2 02 5 .2 00* .9 20 5 .5 30
.1 93 5 .2 00* .9 47 5 .7 15
.2 40 5 .2 00* .9 27 5 .5 74
.3 19 5 .1 06 .7 84 5 .0 59
.2 31 5 .2 00* .8 86 5 .3 39
.2 02 5 .2 00* .9 15 5 .5 01
.2 33 5 .2 00* .8 84 5 .3 29
.2 24 5 .2 00* .9 19 5 .5 23
.2 20 5 .2 00* .9 67 5 .8 57
.2 06 5 .2 00* .9 43 5 .6 87
.2 25 5 .2 00* .8 71 5 .2 72
.1 48 5 .2 00* .9 86 5 .9 65
.3 18 5 .1 09 .7 71 5 .0 46
.2 36 5 .2 00* .9 53 5 .7 58
.1 82 5 .2 00* .9 46 5 .7 11
.2 45 5 .2 00* .9 51 5 .7 47
.2 40 5 .2 00* .9 02 5 .4 21
.1 67 5 .2 00* .9 61 5 .8 15
.1 98 5 .2 00* .9 39 5 .6 58
.2 87 5 .2 00* .9 14 5 .4 90
.2 25 5 .2 00* .9 53 5 .7 61
.2 03 5 .2 00* .9 22 5 .5 43
.2 01 5 .2 00* .9 50 5 .7 34
.1 66 5 .2 00* .9 89 5 .9 77
.2 13 5 .2 00* .9 39 5 .6 56
dos is dos is 0 dos is 1 dos is 5 dos is 10 dos is 50 dos is 0 dos is 1 dos is 5 dos is 10 dos is 50 dos is 0 dos is 1 dos is 5 dos is 10 dos is 50 dos is 0 dos is 1 dos is 5 dos is 10 dos is 50 dos is 0 dos is 1 dos is 5 dos is 10 dos is 50 dos is 0 dos is 1 dos is 5 dos is 10 dos is 50 dad a0
pah a0
say ap 0
dad a5
pah a5
say ap 5
Stat is tic df Sig. Stat is tic df Sig.
Kolmo goro v -Sm irnova Shapiro-Wilk
This is a lower b ound of t he t rue signif icanc e. * .
Lampiran 2. Tabel ANOVA dan
Post
Hoc
Pengaruh Dosis Kromanon Deamina pada Kadar
Air, pH dan Aw Tiap Bagian Daging Ayam
ANOVA
10. 715 4 2. 679 7. 231 .001
7. 408 20 .370
18. 123 24
13. 458 4 3. 364 5. 392 .004
12. 480 20 .624
25. 938 24
90. 861 4 22. 715 10. 904 .000
41. 664 20 2. 083
132.525 24
13. 049 4 3. 262 1. 467 .249
44. 464 20 2. 223
57. 513 24
17. 546 4 4. 386 2. 127 .115
41. 254 20 2. 063
58. 800 24
65. 332 4 16. 333 2. 275 .097
143.575 20 7. 179
208.907 24
Between Groups Within Groups Tot al
Between Groups Within Groups Tot al
Between Groups Within Groups Tot al
Between Groups Within Groups Tot al
Between Groups Within Groups Tot al
Between Groups Within Groups Tot al
dada_0
paha_0
say ap_0
dada_5
paha_5
say ap_5
Sum of
Squares df Mean Square F Sig.
dada_0 Duncana
5 74. 01040
5 74. 86580
5 74. 86900
5 75. 10040
5 76. 05840
1. 000 .572 1. 000
dos is dos is 1 dos is 10 dos is 50 dos is 5 dos is 0 Sig.
N 1 2 3
Subset f or alpha = .05
Means f or groups in homogeneous subs ets are display ed. Uses Harmonic Mean Sample Size = 5. 000. a.
dada_5
Duncana
5 71. 51200 5 72. 30940 5 72. 66780 5 73. 33960 5 73. 50100 .071 dos is
dos is 50 dos is 10 dos is 1 dos is 5 dos is 0 Sig.
N 1
Subset f or alpha
= .05
Means f or groups in homogeneous subsets are display ed. Uses Harmonic Mean Sample Size = 5. 000. a.
paha_0
Duncan
a5
74. 92720
5
75. 43300
75. 43300
5
76. 45120
76. 45120
5
76. 57680
5
76. 83220
.323
.055
.480
dos is
dos is 10
dos is 5
dos is 50
dos is 1
dos is 0
Sig.
N
1
2
3
Subset f or alpha = .05
Means f or groups in homogeneous subs ets are display ed.
Uses Harmonic Mean Sample Size = 5. 000.
a.
paha_5
Duncana
5 72. 86440
5 73. 86480 73. 86480 5 74. 58340 74. 58340 5 74. 74900 74. 74900
5 75. 29060
.070 .165
dos is dos is 10 dos is 5 dos is 50 dos is 0 dos is 1 Sig.
N 1 2
Subset f or alpha = .05
Means f or groups in homogeneous subsets are display ed.
sayap_0 Duncana
5 68. 41800
5 72. 45640
5 72. 87580
5 73. 16900
5 73. 75820
1. 000 .206
dos is dos is 50 dos is 5 dos is 10 dos is 1 dos is 0 Sig.
N 1 2
Subset f or alpha = .05
Means f or groups in homogeneous subsets are display ed. Uses Harmonic Mean Sample Size = 5. 000. a.
sayap_5
Duncana
5 67. 47540
5 70. 94900 70. 94900
5 71. 20460
5 71. 35400
5 72. 09960
.054 .542
dos is dos is 50 dos is 1 dos is 5 dos is 10 dos is 0 Sig.
N 1 2
Subset f or alpha = .05
Means f or groups in homogeneous subsets are display ed. Uses Harmonic Mean Sample Size = 5. 000. a.
ANOVA
.113 4 .028 7. 853 .001
.072 20 .004
.185 24
.128 4 .032 4. 135 .013
.155 20 .008
.282 24
.329 4 .082 27. 405 .000
.060 20 .003
.389 24
.130 4 .032 12. 032 .000
.054 20 .003
.184 24
.106 4 .026 6. 552 .002
.081 20 .004
.186 24
.286 4 .071 25. 051 .000
.057 20 .003
.343 24
Between Groups Within Groups Tot al
Between Groups Within Groups Tot al
Between Groups Within Groups Tot al
Between Groups Within Groups Tot al
Between Groups Within Groups Tot al
Between Groups Within Groups Tot al
dada_0
paha_0
say ap_0
dada_5
paha_5
say ap_5
Sum of
Squares df Mean Square F Sig.
dada_0
Duncan
a5
6.0160
5
6.0320
6.0320
5
6.0480
6.0480
5
6.1080
5
6.2000
.435
.071
1.000
dos is
dos is 1
dos is 50
dos is 10
dos is 5
dos is 0
Sig.
N
1
2
3
Subset f or alpha = .05
Means f or groups in homogeneous subs ets are display ed.
Uses Harmonic Mean Sample Size = 5.000.
a.
dada_5
Duncan
a5
5.9080
5
5.9240
5
5.9600
5.9600
5
6.0180
5
6.1060
.149
.093
1.000
dosis
dosis 50
dosis 1
dosis 10
dosis 5
dosis 0
Sig.
N
1
2
3
Subset f or alpha = .05
Means f or groups in homogeneous subsets are displayed.
paha_0 Duncana
5 6. 3400
5 6. 3620
5 6. 4440 6. 4440
5 6. 4920
5 6. 5240
.091 .188
dos is dos is 0 dos is 50 dos is 10 dos is 1 dos is 5 Sig.
N 1 2
Subset f or alpha = .05
Means f or groups in homogeneous subsets are display ed. Uses Harmonic Mean Sample Size = 5. 000. a.
paha_5
Duncan
a5
6. 2060
5
6. 2260
6. 2260
5
6. 3020
6. 3020
5
6. 3460
5
6. 3720
.624
.073
.114
dos is
dos is 0
dos is 50
dos is 10
dos is 5
dos is 1
Sig.
N
1
2
3
Subset f or alpha = .05
Means f or groups in homogeneous subs ets are display ed.
Uses Harmonic Mean Sample Size = 5. 000.
a.
sayap_0
Duncan
a5
5.9800
5
6.1880
5
6.2640
5
6.2780
5
6.2840
1.000
1.000
.592
dosis
dosis 1
dosis 50
dosis 10
dosis 0
dosis 5
Sig.
N
1
2
3
Subset f or alpha = .05
Means f or groups in homogeneous subsets are displayed.
Uses Harmonic Mean Sample Size = 5.000.
a.
sayap_5
Duncan
a5
5.8800
5
6.0780
5
6.1440
6.1440
5
6.1560
5
6.1660
1.000
.065
.546
dos is
dos is 1
dos is 50
dos is 5
dos is 10
dos is 0
Sig.
N
1
2
3
Subset f or alpha = .05
Means f or groups in homogeneous subs ets are display ed.
Uses Harmonic Mean Sample Size = 5.000.
a.
ANOVA
.000
4
.000
5. 820
.003
.000
20
.000
.001
24
.000
4
.000
1. 671
.196
.001
20
.000
.001
24
.000
4
.000
3. 906
.017
.000
20
.000
.001
24
.000
4
.000
1. 499
.240
.001
20
.000
.001
24
.000
4
.000
2. 083
.121
.000
20
.000
.001
24
.000
4
.000
3. 692
.021
.000
20
.000
.001
24
Between Groups
Within Groups
Tot al
Between Groups
Within Groups
Tot al
Between Groups
Within Groups
Tot al
Between Groups
Within Groups
Tot al
Between Groups
Within Groups
Tot al
Between Groups
Within Groups
Tot al
dada0
paha0
say ap0
dada5
paha5
say ap5
Sum of
dada0
Duncan
a5
.93660
5
.93880
5
.94140
.94140
5
.94500
.94500
5
.94860
.121
.216
.216
dos is
dos is 50
dos is 1
dos is 10
dos is 0
dos is 5
Sig.
N
1
2
3
Subset f or alpha = .05
Means f or groups in homogeneous subs ets are display ed.
Uses Harmonic Mean Sample Size = 5.000.
a.
dada5 Duncana
5 .92460
5 .92740 .92740
5 .92820 .92820
5 .92980 .92980
5 .93240
.168 .184
dos is dos is 50 dos is 1 dos is 10 dos is 0 dos is 5 Sig.
N 1 2
Subset f or alpha = .05
Means f or groups in homogeneous subsets are display ed. Uses Harmonic Mean Sample Size = 5. 000. a.
paha0
Duncan
a5
.94300
5
.94700
.94700
5
.94800
.94800
5
.95020
.95020
5
.95140
.077
.271
dos is
dos is 50
dos is 10
dos is 0
dos is 5
dos is 1
Sig.
N
1
2
Subset f or alpha = .05
Means f or groups in homogeneous subsets are display ed.
Uses Harmonic Mean Sample Size = 5. 000.
a.
paha5
Duncan
a5
.93080
5
.93380
.93380
5
.93560
.93560
5
.93760
.93760
5
.93860
.053
.164
dos is
dos is 50
dos is 10
dos is 0
dos is 1
dos is 5
Sig.
N
1
2
Subset f or alpha = .05
Means f or groups in homogeneous subsets are display ed.
Uses Harmonic Mean Sample Size = 5. 000.
a.
sayap0
Duncan
a5
.93120
5
.93400
.93400
5
.93580
.93580
.93580
5
.94040
.94040
5
.94120
.167
.059
.107
dosis
dosis 50
dosis 0
dosis 10
dosis 1
dosis 5
Sig.
N
1
2
3
Subset f or alpha = .05
Means f or groups in homogeneous subsets are displayed.
Uses Harmonic Mean Sample Size = 5.000.
a.
sayap5 Duncana
5 .91820
5 .91920
5 .92300 .92300
5 .92580
5 .92680
.123 .218
dos is dos is 50 dos is 0 dos is 10 dos is 5 dos is 1 Sig.
N 1 2
Subset f or alpha = .05
Lampiran 3. Tabel Hasil Uji Korelasi
Pearson
Nilai Kadar Air, pH dan Aw Tiap Bagian
Daging Ayam
Lampiran 4. Tabel Hasil Uji
Independent Samples
T-Test
Kadar Air Bagian Dada
Co rrelati on s
1
.375**
.581**
.000
.000
150
150
150
.375**
1
.669**
.000
.000
150
150
150
.581**
.669**
1
.000
.000
150
150
150
Pears on C orrelation
Sig. (1-t ailed)
N
Pears on C orrelation
Sig. (1-t ailed)
N
Pears on C orrelation
Sig. (1-t ailed)
N
kadar_air
pH
Aw
kadar_air
pH
Aw
Correlat ion is signif icant at the 0. 01 lev el (1-t ailed).
**.
Group Statistics
5
76. 0584
.73757
.32985
5
73. 5010
.79738
.35660
perlakuan
dos is 0 jam 0
dos is 0 jam 5
kadar_air_dada
N
Mean
Std. Dev iation
Std. Error
Mean
Independent Samples Test
.011 .918 5. 265 8 .001 2. 55740 .48576 1. 43723 3. 67757
5. 265 7. 952 .001 2. 55740 .48576 1. 43605 3. 67875
Equal v ariances ass umed Equal v ariances not as sumed kadar_air_dada
F Sig.
Lev ene's Test f or Equality of Varianc es
t df Sig. (2-t ailed)
Mean Dif f erence
Std. Error
Dif f erence Lower Upper 95% Conf idenc e
Interv al of the Dif f erence t-test f or Equality of Means
Group Statistics
5
74. 01040
.669624
.299465
5
72. 66780
.955636
.427373
perlakuan
dos is 1 jam 0
dos is 1 jam 5
kadar_air_dada
N
Mean
Std. Dev iation
Independent Samples Test
.151 .707 2. 573 8 .033 1. 342600 .521850 .139212 2. 545988
2. 573 7. 165 .036 1. 342600 .521850 .114357 2. 570843
Equal v ariances ass umed Equal v ariances not as sumed kadar_air_dada
F Sig.
Lev ene's Test f or Equality of Varianc es
t df Sig. (2-t ailed)
Mean Dif f erence
Std. Error
Dif f erence Lower Upper 95% Conf idenc e
Interv al of the Dif f erence t-test f or Equality of Means
Group Statistics
5
75. 10040
.421628
.188558
5
73. 33960
.576138
.257657
perlakuan
dos is 5 jam 0
dos is 5 jam 5
kadar_air_dada
N
Mean
Std. Dev iation
Std. Error
Mean
Independent Samples Test
.158 .701 5. 515 8 .001 1. 760800 .319282 1. 024534 2. 497066
5. 515 7. 329 .001 1. 760800 .319282 1. 012644 2. 508956 Equal v ariances
ass umed Equal v ariances not as sumed kadar_air_dada
F Sig.
Lev ene's Test f or Equality of Varianc es
t df Sig. (2-t ailed)
Mean Dif f erence
Std. Error
Dif f erence Lower Upper 95% Conf idenc e
Interv al of the Dif f erence t-test f or Equality of Means
Group Statistics
5 74. 86580 .583125 .260781
5 72. 30940 2. 068474 .925050
perlakuan dos is 10 jam 0 dos is 10 jam 5 kadar_air_dada
N Mean Std. Dev iation
Std. Error Mean
Independent Samples Test
3. 025 .120 2. 660 8 .029 2. 556400 .961105 .340087 4. 772713
2. 660 4. 632 .048 2. 556400 .961105 .025543 5. 087257
Equal v ariances ass umed Equal v ariances not as sumed kadar_air_dada
F Sig.
Lev ene's Test f or Equality of Varianc es
t df Sig. (2-t ailed)
Mean Dif f erence
Std. Error
Dif f erence Lower Upper 95% Conf idenc e
Interv al of the Dif f erence t-test f or Equality of Means
Group Statistics
5
74. 86900
.584699
.261486
5
71. 12100
2. 633396
1. 177690
perlakuan
dos is 50 jam 0
dos is 50 jam 5
kadar_air_dada
N
Mean
Std. Dev iation
Lampiran 5. Tabel Hasil Uji
Independent Samples
T-Test
Kadar Air Bagian Paha
Independent Samples Test
9. 077 .017 3. 107 8 .015 3. 748000 1. 206370 .966105 6. 529895
3. 107 4. 393 .032 3. 748000 1. 206370 .513617 6. 982383 Equal v ariances
ass umed Equal v ariances not as sumed kadar_air_dada
F Sig.
Lev ene's Test f or Equality of Varianc es
t df Sig. (2-t ailed)
Mean Dif f erence
Std. Error
Dif f erence Lower Upper 95% Conf idenc e
Interv al of the Dif f erence t-test f or Equality of Means
Group Statistics
5
76. 83220
.393696
.176066
5
74. 74900
.384130
.171788
perlakuan
dos is 0 jam 0
dos is 0 jam 5
kadar_air_paha
N
Mean
Std. Dev iation
Std. Error
Mean
Independent Samples Test
.035 .856 8. 469 8 .000 2. 083200 .245989 1. 515949 2. 650451
8. 469 7. 995 .000 2. 083200 .245989 1. 515889 2. 650511 Equal v ariances
ass umed Equal v ariances not as sumed kadar_air_paha
F Sig.
Lev ene's Test f or Equality of Varianc es
t df Sig. (2-t ailed)
Mean Dif f erence
Std. Error
Dif f erence Lower Upper 95% Conf idenc e
Interv al of the Dif f erence t-test f or Equality of Means
Group Statistics
5
76. 57680
.578526
.258725
5
75. 29060
.803205
.359204
perlakuan
dos is 1 jam 0
dos is 1 jam 5
kadar_air_paha
N
Mean
Std. Dev iation
Std. Error
Mean
Independent Samples Test
.972 .353 2. 905 8 .020 1. 286200 .442681 .265376 2. 307024
2. 905 7. 270 .022 1. 286200 .442681 .247261 2. 325139
Equal v ariances ass umed Equal v ariances not as sumed kadar_air_paha
F Sig.
Lev ene's Test f or Equality of Varianc es
t df Sig. (2-t ailed)
Mean Dif f erence
Std. Error
Dif f erence Lower Upper 95% Conf idenc e
Interv al of the Dif f erence t-test f or Equality of Means
Group Statistics
5
74. 92720
1. 393590
.623232
5
72. 86440
1. 333969
.596569
perlakuan
dos is 10 jam 0
dos is 10 jam 5
kadar_air_paha
N
Mean
Std. Dev iation
Lampiran 6. Tabel Hasil Uji
Independent Samples
T-Test
Kadar Air Bagian Sayap
Independent Samples Test
.078 .788 2. 391 8 .044 2. 062800 .862736 .073328 4. 052272
2. 391 7. 985 .044 2. 062800 .862736 .072666 4. 052934
Equal v ariances ass umed Equal v ariances not as sumed kadar_air_paha
F Sig.
Lev ene's Test f or Equality of Varianc es
t df Sig. (2-t ailed)
Mean Dif f erence
Std. Error
Dif f erence Lower Upper 95% Conf idenc e
Interv al of the Dif f erence t-test f or Equality of Means
Group Statistics
5 76. 45120 .694986 .310807
5 74. 58340 2. 245006 1. 003997 perlakuan
dos is 50 jam 0 dos is 50 jam 5 kadar_air_paha
N Mean Std. Dev iation
Std. Error Mean
Independent Samples Test
14. 135 .006 1. 777 8 .113 1. 867800 1. 051005 -. 555822 4. 291422
1. 777 4. 760 .139 1. 867800 1. 051005 -. 875442 4. 611042 Equal v ariances
ass umed Equal v ariances not as sumed kadar_air_paha
F Sig.
Lev ene's Test f or Equality of Varianc es
t df Sig. (2-t ailed)
Mean Dif f erence
Std. Error
Dif f erence Lower Upper 95% Conf idenc e
Interv al of the Dif f erence t-test f or Equality of Means
Group Statistics
5
73.7582
2.21238
.98941
5
71.9096
1.68164
.75205
perlakuan
dos is 0 jam 0
dos is 0 jam 5
kadar_air_say ap
N
Mean
Std. Dev iation
Std. Error
Mean
Independent Samples Test
.639 .447 1. 487 8 .175 1. 84860 1. 24278 -1.01726 4. 71446
1. 487 7. 465 .178 1. 84860 1. 24278 -1.05338 4. 75058
Equal v ariances ass umed Equal v ariances not as sumed kadar_air_say ap
F Sig.
Lev ene's Test f or Equality of Varianc es
t df Sig. (2-t ailed)
Mean Dif f erence
Std. Error
Dif f erence Lower Upper 95% Conf idence
Interv al of the Dif f erence t-test f or Equality of Means
Group Statistics
5 73. 1690 .79737 .35660
5 70. 9490 4. 35239 1. 94645
perlakuan dos is 1 jam 0 dos is 1 jam 5 kadar_air_say ap
N Mean Std. Dev iation
Independent Samples Test
13. 396 .006 1. 122 8 .294 2. 22000 1. 97884 -2.34322 6. 78322
1. 122 4. 268 .321 2. 22000 1. 97884 -3.14063 7. 58063
Equal v ariances ass umed Equal v ariances not as sumed kadar_air_say ap
F Sig.
Lev ene's Test f or Equality of Varianc es
t df Sig. (2-t ailed)
Mean Dif f erence
Std. Error
Dif f erence Lower Upper 95% Conf idence
Interv al of the Dif f erence t-test f or Equality of Means
Group Statistics
5
72. 45640
.953727
.426520
5
70. 77560
1. 508807
.674759
perlakuan
dos is 5 jam 0
dos is 5 jam 5
kadar_air_say ap
N
Mean
Std. Dev iation
Std. Error
Mean
Independent Samples Test
.999 .347 2. 106 8 .068 1. 680800 .798260 -. 159991 3. 521591
2. 106 6. 756 .075 1. 680800 .798260 -. 220668 3. 582268 Equal v ariances
ass umed Equal v ariances not as sumed kadar_air_say ap
F Sig.
Lev ene's Test f or Equality of Varianc es
t df Sig. (2-t ailed)
Mean Dif f erence
Std. Error
Dif f erence Lower Upper 95% Conf idence
Interv al of the Dif f erence t-test f or Equality of Means
Group Statistics
5
72. 87580
1. 172792
.524489
5
71. 35400
2. 210746
.988676
perlakuan
dos is 10 jam 0
dos is 10 jam 5
kadar_air_say ap
N
Mean
Std. Dev iation
Std. Error
Mean
Independent Samples Test
2. 537 .150 1. 360 8 .211 1. 521800 1. 119182 -1.059038 4. 102638
1. 360 6. 086 .222 1. 521800 1. 119182 -1.207367 4. 250967 Equal v ariances
ass umed Equal v ariances not as sumed kadar_air_say ap
F Sig.
Lev ene's Test f or Equality of Varianc es
t df Sig. (2-t ailed)
Mean Dif f erence
Std. Error
Dif f erence Lower Upper 95% Conf idence
Interv al of the Dif f erence t-test f or Equality of Means
Group Statistics
5 68. 41800 1. 612659 .721203 5 67. 36900 1. 437619 .642923 perlakuan
dos is 50 jam 0 dos is 50 jam 5 kadar_air_say ap
N Mean Std. Dev iation
Lampiran 7. Tabel Hasil Uji
Independent Samples
T-Test
pH Bagian Dada
Independent Samples Test
.384 .553 1. 086 8 .309 1. 049000 .966169 -1.178991 3. 276991
1. 086 7. 897 .310 1. 049000 .966169 -1.184076 3. 282076 Equal v ariances
ass umed Equal v ariances not as sumed kadar_air_say ap
F Sig.
Lev ene's Test f or Equality of Varianc es
t df Sig. (2-t ailed)
Mean Dif f erence
Std. Error
Dif f erence Lower Upper 95% Conf idence
Interv al of the Dif f erence t-test f or Equality of Means
Group Statistics
5
6. 2000
.01581
.00707
5
6. 1060
.04159
.01860
dos is
dos is 0 jam 0
dos is 0 jam 5
pH_dada
N
Mean
Std. Dev iation
Std. Error
Mean
Independent Samples Test
3. 160 .113 4. 724 8 .001 .09400 .01990 .04811 .13989
4. 724 5. 132 .005 .09400 .01990 .04324 .14476
Equal v ariances ass umed Equal v ariances not as sumed pH_dada
F Sig.
Lev ene's Test f or Equality of Varianc es
t df Sig. (2-t ailed) Mean Dif f erence
Std. Error
Dif f erence Lower Upper 95% Conf idence
Interv al of the Dif f erence t-test f or Equality of Means
Group Statistics
5
6. 0160
.05128
.02293
5
5. 9240
.04722
.02112
dos is
dos is 1 jam 0
dos is 1 jam 5
pH_dada
N
Mean
Std. Dev iation
Std. Error
Mean
Independent Samples Test
.000 1. 000 2. 951 8 .018 .09200 .03118 .02011 .16389
2. 951 7. 946 .019 .09200 .03118 .02002 .16398
Equal v ariances ass umed Equal v ariances not as sumed pH_dada
F Sig.
Lev ene's Test f or Equality of Varianc es
t df Sig. (2-t ailed) Mean Dif f erence
Std. Error
Dif f erence Lower Upper 95% Conf idence
Group Statistics
5
6. 1080
.09884
.04420
5
6. 0180
.06611
.02956
dos is
dos is 5 jam 0
dos is 5 jam 5
pH_dada
N
Mean
Std. Dev iation
Std. Error
Mean
Independent Samples Test
2. 012 .194 1. 692 8 .129 .09000 .05318 -. 03263 .21263
1. 692 6. 982 .135 .09000 .05318 -. 03581 .21581
Equal v ariances ass umed Equal v ariances not as sumed pH_dada
F Sig.
Lev ene's Test f or Equality of Varianc es
t df Sig. (2-t ailed) Mean Dif f erence
Std. Error
Dif f erence Lower Upper 95% Conf idence
Interv al of the Dif f erence t-test f or Equality of Means
Group Statistics
5
6. 0480
.04970
.02223
5
5. 9600
.06782
.03033
dos is
dos is 10 jam 0
dos is 10 jam 5
pH_dada
N
Mean
Std. Dev iation
Std. Error
Mean
Independent Samples Test
.101 .759 2. 340 8 .047 .08800 .03760 .00129 .17471
2. 340 7. 334 .050 .08800 .03760 -. 00010 .17610
Equal v ariances ass umed Equal v ariances not as sumed pH_dada
F Sig.
Lev ene's Test f or Equality of Varianc es
t df Sig. (2-t ailed) Mean Dif f erence
Std. Error
Dif f erence Lower Upper 95% Conf idence
Interv al of the Dif f erence t-test f or Equality of Means
Group Statistics
5
6. 0320
.05357
.02396
5
5. 9080
.02387
.01068
dos is
dos is 50 jam 0
dos is 50 jam 5
pH_dada
N
Mean
Std. Dev iation
Std. Error
Mean
Independent Samples Test
.832 .388 4. 727 8 .001 .12400 .02623 .06351 .18449
4. 727 5. 529 .004 .12400 .02623 .05847 .18953
Equal v ariances ass umed Equal v ariances not as sumed pH_dada
F Sig.
Lev ene's Test f or Equality of Varianc es
t df Sig. (2-t ailed) Mean Dif f erence
Std. Error
Dif f erence Lower Upper 95% Conf idence
Lampiran 8. Tabel Hasil Uji
Independent Samples
T-Test
pH Bagian Paha
Group Statistics
5
6. 3700
.07969
.03564
5
6. 2080
.02588
.01158
dos is
dos is 0 jam 0
dos is 0 jam 5
pH_paha
N
Mean
Std. Dev iation
Std. Error
Mean
Independent Samples Test
6. 826 .031 4. 323 8 .003 .16200 .03747 .07559 .24841
4. 323 4. 835 .008 .16200 .03747 .06468 .25932
Equal v ariances ass umed Equal v ariances not as sumed pH_paha
F Sig.
Lev ene's Test f or Equality of Varianc es
t df Sig. (2-t ailed) Mean Dif f erence
Std. Error
Dif f erence Lower Upper 95% Conf idence
Interv al of the Dif f erence t-test f or Equality of Means
Group Statistics
5
6. 3280
.05891
.02634
5
6. 1880
.04604
.02059
dos is
dos is 1 jam 0
dos is 1 jam 5
pH_paha
N
Mean
Std. Dev iation
Std. Error
Mean
Independent Samples Test
.934 .362 4. 187 8 .003 .14000 .03344 .06290 .21710
4. 187 7. 559 .003 .14000 .03344 .06211 .21789
Equal v ariances ass umed Equal v ariances not as sumed pH_paha
F Sig.
Lev ene's Test f or Equality of Varianc es
t df Sig. (2-t ailed) Mean Dif f erence
Std. Error
Dif f erence Lower Upper 95% Conf idence
Interv al of the Dif f erence t-test f or Equality of Means
Group Statistics
5
6. 5240
.05727
.02561
5
6. 3460
.01817
.00812
dos is
dos is 5 jam 0
dos is 5 jam 5
pH_paha
N
Mean
Std. Dev iation
Std. Error
Mean
Independent Samples Test
5. 712 .044 6. 624 8 .000 .17800 .02687 .11604 .23996
6. 624 4. 797 .001 .17800 .02687 .10804 .24796
Equal v ariances ass umed Equal v ariances not as sumed pH_paha
F Sig.
Lev ene's Test f or Equality of Varianc es
t df Sig. (2-t ailed) Mean Dif f erence
Std. Error
Dif f erence Lower Upper 95% Conf idence
Lampiran 9. Tabel Hasil Uji
Independent Samples
T-Test
pH Bagian Sayap
Group Statistics
5
6. 4440
.14859
.06645
5
6. 3020
.10849
.04852
dos is
dos is 10 jam 0
dos is 10 jam 5
pH_paha
N
Mean
Std. Dev iation
Std. Error
Mean
Independent Samples Test
.608 .458 1. 726 8 .123 .14200 .08228 -. 04774 .33174
1. 726 7. 321 .126 .14200 .08228 -. 05085 .33485
Equal v ariances ass umed Equal v ariances not as sumed pH_paha
F Sig.
Lev ene's Test f or Equality of Varianc es
t df Sig. (2-t ailed) Mean Dif f erence
Std. Error
Dif f erence Lower Upper 95% Conf idence
Interv al of the Dif f erence t-test f or Equality of Means
Group Statistics
5
6. 3620
.04324
.01934
5
6. 2260
.05128
.02293
dos is
dos is 50 jam 0
dos is 50 jam 5
pH_paha
N
Mean
Std. Dev iation
Std. Error
Mean
Independent Samples Test
.257 .626 4. 533 8 .002 .13600 .03000 .06682 .20518
4. 533 7. 778 .002 .13600 .03000 .06647 .20553
Equal v ariances ass umed Equal v ariances not as sumed pH_paha
F Sig.
Lev ene's Test f or Equality of Varianc es
t df Sig. (2-t ailed) Mean Dif f erence
Std. Error
Dif f erence Lower Upper 95% Conf idence
Interv al of the Dif f erence t-test f or Equality of Means
Group Statistics
5 6. 2780 .04147 .01855
5 6. 1660 .03362 .01503
dos is dos is 0 jam 0 dos is 0 jam 5 pH_say ap
N Mean Std. Dev iation
Std. Error Mean
Independent Samples Test
.066 .803 4. 691 8 .002 .11200 .02387 .05694 .16706
4. 691 7. 671 .002 .11200 .02387 .05653 .16747
Equal v ariances ass umed Equal v ariances not as sumed pH_say ap
F Sig.
Lev ene's Test f or Equality of Varianc es
t df Sig. (2-t ailed)
Mean Dif f erence
Std. Error
Dif f erence Lower Upper 95% Conf idence
Group Statistics
5
6. 2840
.07127
.03187
5
6. 1440
.02702
.01208
dos is
dos is 5 jam 0
dos is 5 jam 5
pH_say ap
N
Mean
Std. Dev iation
Std. Error
Mean
Independent Samples Test
5. 241 .051 4. 107 8 .003 .14000 .03409 .06139 .21861
4. 107 5. 126 .009 .14000 .03409 .05302 .22698
Equal v ariances ass umed Equal v ariances not as sumed pH_say ap
F Sig.
Lev ene's Test f or Equality of Varianc es
t df Sig. (2-t ailed) Mean Dif f erence
Std. Error
Dif f erence Lower Upper 95% Conf idence
Interv al of the Dif f erence t-test f or Equality of Means
Group Statistics
5
6. 2640
.04506
.02015
5
6. 1560
.03362
.01503
dos is
dos is 10 jam 0
dos is 10 jam 5
pH_say ap
N
Mean
Std. Dev iation
Std. Error
Mean
Independent Samples Test
1. 031 .340 4. 296 8 .003 .10800 .02514 .05003 .16597
4. 296 7. 400 .003 .10800 .02514 .04920 .16680
Equal v ariances ass umed Equal v ariances not as sumed pH_say ap
F Sig.
Lev ene's Test f or Equality of Varianc es
t df Sig. (2-t ailed)
Mean Dif f erence
Std. Error
Dif f erence Lower Upper 95% Conf idence
Interv al of the Dif f erence t-test f or Equality of Means
Group Statistics
5
6. 1880
.01924
.00860
5
6. 0780
.01924
.00860
dos is
dos is 50 jam 0
dos is 50 jam 5
pH_say ap
N
Mean
Std. Dev iation
Std. Error
Mean
Independent Samples Test
.013 .913 9. 042 8 .000 .11000 .01217 .08195 .13805
9. 042 8. 000 .000 .11000 .01217 .08195 .13805
Equal v ariances ass umed Equal v ariances not as sumed pH_say ap
F Sig.
Lev ene's Test f or Equality of Varianc es
t df Sig. (2-t ailed)
Mean Dif f erence
Std. Error
Dif f erence Lower Upper 95% Conf idence
Lampiran 10. Tabel Hasil Uji
Independent Samples
T-Test
Aw Bagian Dada
Group Statistics
5
.94500
.003536
.001581
5
.92980
.005630
.002518
dos is
dos is 0 jam 0
dos is 0 jam 5
Aw_dada
N
Mean
Std. Dev iation
Std. Error
Mean
Independent Samples Test
.724 .419 5. 112 8 .001 .015200 .002973 .008344 .022056
5. 112 6. 730 .002 .015200 .002973 .008112 .022288 Equal v ariances
ass umed Equal v ariances not as sumed Aw_dada
F Sig.
Lev ene's Test f or Equality of Varianc es
t df Sig. (2-t ailed) Mean Dif f erence
Std. Error
Dif f erence Lower Upper 95% Conf idence
Interv al of the Dif f erence t-test f or Equality of Means
Group Statistics
5
.93880
.004970
.002223
5
.92740
.005079
.002272
dos is
dos is 1 jam 0
dos is 1 jam 5
Aw_dada
N
Mean
Std. Dev iation
Std. Error
Mean
Independent Samples Test
.009 .925 3. 587 8 .007 .011400 .003178 .004071 .018729
3. 587 7. 996 .007 .011400 .003178 .004071 .018729 Equal v ariances
ass umed Equal v ariances not as sumed Aw_dada
F Sig.
Lev ene's Test f or Equality of Varianc es
t df Sig. (2-t ailed) Mean Dif f erence
Std. Error
Dif f erence Lower Upper 95% Conf idence
Interv al of the Dif f erence t-test f or Equality of Means
Group Statistics
5
.94860
.004159
.001860
5
.93240
.004506
.002015
dos is
dos is 5 jam 0
dos is 5 jam 5
Aw_dada
N
Mean
Std. Dev iation
Std. Error
Mean
Independent Samples Test
.514 .494 5. 908 8 .000 .016200 .002742 .009876 .022524
5. 908 7. 949 .000 .016200 .002742 .009869 .022531 Equal v ariances
ass umed Equal v ariances not as sumed Aw_dada
F Sig.
Lev ene's Test f or Equality of Varianc es
t df Sig. (2-t ailed) Mean Dif f erence
Std. Error
Dif f erence Lower Upper 95% Conf idence
Lampiran 11. Tabel Hasil Uji
Independent Samples
T-Test
Aw Bagian Paha
Group Statistics
5
.94140
.005727
.002561
5
.92820
.005167
.002311
dos is
dos is 10 jam 0
dos is 10 jam 5
Aw_dada
N
Mean
Std. Dev iation
Std. Error
Mean
Independent Samples Test
.040 .846 3. 826 8 .005 .013200 .003450 .005245 .021155
3. 826 7. 917 .005 .013200 .003450 .005231 .021169 Equal v ariances
ass umed Equal v ariances not as sumed Aw_dada
F Sig.
Lev ene's Test f or Equality of Varianc es
t df Sig. (2-t ailed) Mean Dif f erence
Std. Error
Dif f erence Lower Upper 95% Conf idence
Interv al of the Dif f erence t-test f or Equality of Means
Group Statistics
5
.93660
.003435
.001536
5
.92460
.005899
.002638
dos is
dos is 50 jam 0
dos is 50 jam 5
Aw_dada
N
Mean
Std. Dev iation
Std. Error
Mean
Independent Samples Test
2. 019 .193 3. 931 8 .004 .012000 .003053 .004960 .019040
3. 931 6. 433 .007 .012000 .003053 .004650 .019350 Equal v ariances
ass umed Equal v ariances not as sumed Aw_dada
F Sig.
Lev ene's Test f or Equality of Varianc es
t df Sig. (2-t ailed) Mean Dif f erence
Std. Error
Dif f erence Lower Upper 95% Conf idence
Interv al of the Dif f erence t-test f or Equality of Means
Group Statistics
5
.94800
.003873
.001732
5
.93560
.004336
.001939
dos is
dos is 0 jam 0
dos is 0 jam 5
Aw_paha
N
Mean
Std. Dev iation
Std. Error
Mean
Independent Samples Test
.048 .832 4. 769 8 .001 .012400 .002600 .006404 .018396
4. 769 7. 900 .001 .012400 .002600 .006391 .018409 Equal v ariances
ass umed Equal v ariances not as sumed Aw_paha
F Sig.
Lev ene's Test f or Equality of Varianc es
t df Sig. (2-t ailed) Mean Dif f erence
Std. Error
Dif f erence Lower Upper 95% Conf idence
Group Statistics
5
.95140
.004159
.001860
5
.93760
.003912
.001749
dos is
dos is 1 jam 0
dos is 1 jam 5
Aw_paha
N
Mean
Std. Dev iation
Std. Error
Mean
Independent Samples Test
.000 1. 000 5. 404 8 .001 .013800 .002553 .007912 .019688
5. 404 7. 970 .001 .013800 .002553 .007908 .019692 Equal v ariances
ass umed Equal v ariances not as sumed Aw_paha
F Sig.
Lev ene's Test f or Equality of Varianc es
t df Sig. (2-t ailed) Mean Dif f erence
Std. Error
Dif f erence Lower Upper 95% Conf idence
Interv al of the Dif f erence t-test f or Equality of Means
Group Statistics
5
.95020
.005020
.002245
5
.93860
.004930
.002205
dos is
dos is 5 jam 0
dos is 5 jam 5
Aw_paha
N
Mean
Std. Dev iation
Std. Error
Mean
Independent Samples Test
.033 .860 3. 687 8 .006 .011600 .003146 .004344 .018856
3. 687 7. 997 .006 .011600 .003146 .004344 .018856 Equal v ariances
ass umed Equal v ariances not as sumed Aw_paha
F Sig.
Lev ene's Test f or Equality of Varianc es
t df Sig. (2-t ailed) Mean Dif f erence
Std. Error
Dif f erence Lower Upper 95% Conf idence
Interv al of the Dif f erence t-test f or Equality of Means
Group Statistics
5
.94700
.006892
.003082
5
.93380
.003834
.001715
dos is
dos is 10 jam 0
dos is 10 jam 5
Aw_paha
N
Mean
Std. Dev iation
Std. Error
Mean
Independent Samples Test
7. 756 .024 3. 743 8 .006 .013200 .003527 .005067 .021333
3. 743 6. 259 .009 .013200 .003527 .004656 .021744 Equal v ariances
ass umed Equal v ariances not as sumed Aw_paha
F Sig.
Lev ene's Test f or Equality of Varianc es
t df Sig. (2-t ailed) Mean Dif f erence
Std. Error
Dif f erence Lower Upper 95% Conf idence
Lampiran 12. Tabel Hasil Uji
Independent Samples
T-Test
Aw Bagian Sayap
Group Statistics
5
.94300
.007314
.003271
5
.93080
.006573
.002939
dos is
dos is 50 jam 0
dos is 50 jam 5
Aw_paha
N
Mean
Std. Dev iation
Std. Error
Mean
Independent Samples Test
.107 .752 2. 774 8 .024 .012200 .004398 .002059 .022341
2. 774 7. 910 .024 .012200 .004398 .002039 .022361 Equal v ariances
ass umed Equal v ariances not as sumed Aw_paha
F Sig.
Lev ene's Test f or Equality of Varianc es
t df Sig. (2-t ailed) Mean Dif f erence
Std. Error
Dif f erence Lower Upper 95% Conf idence
Interv al of the Dif f erence t-test f or Equality of Means
Group Statistics
5
.93400
.003536
.001581
5
.91920
.005630
.002518
dos is
dos is 0 jam 0
dos is 0 jam 5
Aw_say ap
N
Mean
Std. Dev iation
Std. Error
Mean
Independent Samples Test
1. 842 .212 4. 978 8 .001 .014800 .002973 .007944 .021656
4. 978 6. 730 .002 .014800 .002973 .007712 .021888 Equal v ariances
ass umed Equal v ariances not as sumed Aw_say ap
F Sig.
Lev ene's Test f or Equality of Varianc es
t df Sig. (2-t ailed) Mean Dif f erence
Std. Error
Dif f erence Lower Upper 95% Conf idence
Interv al of the Dif f erence t-test f or Equality of Means
Group Statistics
5
.94040
.006841
.003059
5
.92680
.005630
.002518
dos is
dos is 1 jam 0
dos is 1 jam 5
Aw_say ap
N
Mean
Std. Dev iation
Std. Error
Mean
Independent Samples Test
.515 .493 3. 432 8 .009 .013600 .003962 .004463 .022737
3. 432 7. 715 .009 .013600 .003962 .004404 .022796
Equal v ariances ass umed Equal v ariances not as sumed Aw_say ap
F Sig.
Lev ene's Test f or Equality of Varianc es
t df Sig. (2-t ailed)
Mean Dif f erence
Std. Error
Dif f erence Lower Upper 95% Conf idence
Group Statistics
5
.94120
.005167
.002311
5
.92580
.004494
.002010
dos is
dos is 5 jam 0
dos is 5 jam 5
Aw_say ap
N
Mean
Std. Dev iation
Std. Error
Mean
Independent Samples Test
.332 .580 5. 028 8 .001 .015400 .003063 .008337 .022463
5. 028 7. 849 .001 .015400 .003063 .008314 .022486
Equal v ariances ass umed Equal v ariances not as sumed Aw_say ap
F Sig.
Lev ene's Test f or Equality of Varianc es
t df Sig. (2-t ailed)
Mean Dif f erence
Std. Error
Dif f erence Lower Upper 95% Conf idence
Interv al of the Dif f erence t-test f or Equality of Means
Group Statistics
5
.93580
.003962
.001772
5
.92300
.002915
.001304
dos is
dos is 10 jam 0
dos is 10 jam 5
Aw_say ap
N
Mean
Std. Dev iation
Std. Error
Mean
Independent Samples Test
.195 .670 5. 818 8 .000 .012800 .002200 .007727 .017873
5. 818 7. 349 .001 .012800 .002200 .007648 .017952
Equal v ariances ass umed Equal v ariances not as sumed Aw_say ap
F Sig.
Lev ene's Test f or Equality of Varianc es
t df Sig. (2-t ailed)
Mean Dif f erence
Std. Error
Dif f erence Lower Upper 95% Conf idence
Interv al of the Dif f erence t-test f or Equality of Means
Group Statistics
5
.93120
.003701
.001655
5
.91820
.002775
.001241
dos is
dos is 50 jam 0
dos is 50 jam 5
Aw_say ap
N
Mean
Std. Dev iation
Std. Error
Mean
Independent Samples Test
.693 .429 6. 284 8 .000 .013000 .002069 .008229 .017771
6. 284 7. 417 .000 .013000 .002069 .008163 .017837
Equal v ariances ass umed Equal v ariances not as sumed Aw_say ap
F Sig.
Lev ene's Test f or Equality of Varianc es
t df Sig. (2-t ailed)
Mean Dif f erence
Std. Error
Dif f erence Lower Upper 95% Conf idence
Lampiran 13. Hasil Analisa Uji Korelasi
Bivariate
dan Korelasi
Partial
antara Kadar Air,
pH, Aw, dan Pertumbuhan Mikroorganisme pada Daging Ayam Broiler
Correlations 1.000 .200 . .624 5 5 .200 1.000 .624 . 5 5
Correlation Coef fic ient Sig. (2-tailed) N
Correlation Coef fic ient Sig. (2-tailed) N KA_0 Mo_0 Kendall's tau_b KA_0 Mo_0 Correlations 1.000 .378 . .622 0 2 .378 1.000 .622 . 2 0 Correlation Signif icance (2-tailed) df
Correlation Signif icance (2-tailed) df KA_0 Mo_0 Control Variables Kro KA_0 Mo_0 Correlations 1.000 .200 . .624 5 5 .200 1.000 .624 . 5 5
Correlation Coef fic ient Sig. (2-tailed) N
Correlation Coef fic ient Sig. (2-tailed) N KA_5 Mo_5 Kendall's tau_b KA_5 Mo_5 Correlations 1.000 .773 . .227 0 2 .773 1.000 .227 . 2 0 Correlation Signif icance (2-tailed) df
Correlation Signif icance (2-tailed) df KA_5 Mo_5 Control Variables Kro KA_5 Mo_5 Correlations 1.000 .800 . .050 5 5 .800 1.000 .050 . 5 5
Correlation Coef fic ient Sig. (2-tailed) N
Correlation Coef fic ient Sig. (2-tailed) N KA_0 Mo_0 Kendall's tau_b KA_0 Mo_0 Correlations 1.000 .933 . .067 0 2 .933 1.000 .067 . 2 0 Correlation Signif icance (2-tailed) df
Correlation Signif icance (2-tailed) df KA_0 Mo_0 Control Variables Kro KA_0 Mo_0
Correlations
1.000
.200
.
.624
5
5
.200
1.000
.624
.
5
5
Correlation Coef ficient
Sig. (2-tailed)
N
Correlation Coef ficient
Sig. (2-tailed)
N
KA_5
Mo_5
Kendall's tau_b
KA_5
Mo_5
Correlations 1.000 .652 . .348 0 2 .652 1.000 .348 . 2 0 Correlation Signif icance (2-tailed) dfCorrelation Signif icance (2-tailed) df KA_5 Mo_5 Control Variables Kro KA_5 Mo_5 Correlations 1.000 1.000* . .014 5 5 1.000* 1.000 .014 . 5 5
Correlation Coef ficient Sig. (2-tailed) N
Correlation Coef ficient Sig. (2-tailed) N KA_0 Mo_0 Kendall's tau_b KA_0 Mo_0
Correlation is signif icant at the 0.05 level (2-tailed). *. Correlations 1.000 .614 . .386 0 2 .614 1.000 .386 . 2 0 Correlation Signif icance (2-tailed) df
Correlations 1.000 .000 . 1.000 5 5 .000 1.000 1.000 . 5 5
Correlation Coef ficient Sig. (2-tailed) N
Correlation Coef ficient Sig. (2-tailed) N KA_5 Mo_5 Kendall's tau_b KA_5 Mo_5 Correlations 1.000 .802 . .198 0 2 .802 1.000 .198 . 2 0 Correlation Signif icance (2-tailed) df
Correlation Signif icance (2-tailed) df KA_5 Mo_5 Control Variables Kro KA_5 Mo_5 Correlations 1.000 .000 . 1.000 5 5 .000 1.000 1.000 . 5 5
Correlation Coef ficient Sig. (2-tailed) N
Correlation Coef ficient Sig. (2-tailed) N PH_0 Mo_0 Kendall's tau_b PH_0 Mo_0 Correlations 1.000 .440 . .560 0 2 .440 1.000 .560 . 2 0 Correlation Signif icanc e (2-tailed) df
Correlation Signif icanc e (2-tailed) df PH_0 Mo_0 Control Variables Kro PH_0 Mo_0 Correlations 1.000 .000 . 1.000 5 5 .000 1.000 1.000 . 5 5
Correlation Coef ficient Sig. (2-tailed) N
Correlation Coef ficient Sig. (2-tailed) N PH_5 Mo_5 Kendall's tau_b PH_5 Mo_5 Correlations
1. 000 .541
. .459
0 2
.541 1. 000
.459 .
2 0
Correlat ion Signif icanc e (2-tailed) df
Correlat ion Signif icanc e (2-tailed) df
PH_5
Mo_5 Control Variables Kro PH_5 Mo_5 Correlations 1.000 -.400 . .327 5 5 -.400 1.000 .327 . 5 5
Correlation Coef ficient Sig. (2-tailed) N
Correlation Coef ficient Sig. (2-tailed) N PH_0 Mo_0 Kendall's tau_b PH_0 Mo_0 Correlations 1.000 -.471 . .529 0 2 -.471 1.000 .529 . 2 0 Correlation Signif icanc e (2-tailed) df
Correlation Signif icanc e (2-tailed) df PH_0 Mo_0 Control Variables Kro PH_0 Mo_0 Correlations 1.000 -.200 . .624 5 5 -.200 1.000 .624 . 5 5
Correlation Coef ficient Sig. (2-tailed) N
Correlation Coef ficient Sig. (2-tailed) N PH_5 Mo_5 Kendall's tau_b PH_5 Mo_5 Correlations 1.000 .123 . .877 0 2 .123 1.000 .877 . 2 0 Correlation Signif icanc e (2-tailed) df
Correlation Signif icanc e (2-tailed) df PH_5 Mo_5 Control Variables Kro PH_5 Mo_5
Correlations
1.000
.105
.
.801
5
5
.105
1.000
.801
.
5
5
Correlation Coef ficient
Sig. (2-tailed)
N
Correlation Coef ficient
Sig. (2-tailed)
N
PH_0
Mo_0
Kendall's tau_b
PH_0
Mo_0
Correlations
1.000
-.189
.
.811
0
2
-.189
1.000
.811
.
2
0
Correlation
Signif icance (2-tailed)
df
Correlations 1.000 .400 . .327 5 5 .400 1.000 .327 . 5 5
Correlation Coef ficient Sig. (2-tailed) N
Correlation Coef ficient Sig. (2-tailed) N PH_5 Mo_5 Kendall's tau_b PH_5 Mo_5 Correlations 1.000 .894 . .106 0 2 .894 1.000 .106 . 2 0 Correlation Signif icanc e (2-tailed) df
Correlation Signif icanc e (2-tailed) df PH_5 Mo_5 Control Variables Kro PH_5 Mo_5 Correlations 1.000 -.400 . .327 5 5 -.400 1.000 .327 . 5 5
Correlation Coef ficient Sig. (2-tailed) N
Correlation Coef ficient Sig. (2-tailed) N Aw_0 Mo_0 Kendall's tau_b Aw_0 Mo_0 Correlati ons
1. 000 -. 344
. .656
0 2
-. 344 1. 000
.656 .
2 0
Correlat ion Signif icance (2-tailed) df
Correlat ion Signif icance (2-tailed) df
Aw_0
Mo_0 Control Variables Kro Aw_0 Mo_0 Correlations 1.000 -.200 . .624 5 5 -.200 1.000 .624 . 5 5
Correlation Coef ficient Sig. (2-tailed) N
Correlation Coef ficient Sig. (2-tailed) N Aw_5 Mo_5 Kendall's tau_b Aw_5 Mo_5 Correlations 1.000 .164 . .836 0 2 .164 1.000 .836 . 2 0 Correlation Signif icance (2-tailed) df
Correlation Signif icance (2-tailed) df Aw_5 Mo_5 Control Variables Kro Aw_5 Mo_5 Correlations 1.000 .000 . 1.000 5 5 .000 1.000 1.000 . 5 5
Correlation Coef ficient Sig. (2-tailed) N
Correlation Coef ficient Sig. (2-tailed) N Aw_0 Mo_0 Kendall's tau_b Aw_0 Mo_0 Correlations 1.000 -.177 . .823 0 2 -.177 1.000 .823 . 2 0 Correlation Signif icance (2-tailed) df
Correlation Signif icance (2-tailed) df Aw_0 Mo_0 Control Variables Kro Aw_0 Mo_0 Correlations 1.000 -.600 . .142 5 5 -.600 1.000 .142 . 5 5
Correlation Coef ficient Sig. (2-tailed) N
Correlation Coef ficient Sig. (2-tailed) N Aw_5 Mo_5 Kendall's tau_b Aw_5 Mo_5 Correlati ons
1. 000 -. 362
. .638
0 2
-. 362 1. 000
.638 .
2 0
Correlat ion Signif icance (2-tailed) df
Correlat ion Signif icance (2-tailed) df
Aw_5
Mo_5 Control Variables Kro Aw_5 Mo_5 Correlations 1.000 .000 . 1.000 5 5 .000 1.000 1.000 . 5 5
Correlation Coef ficient Sig. (2-tailed) N
Correlation Coef ficient Sig. (2-tailed) N Aw_0 Mo_0 Kendall's tau_b Aw_0 Mo_0 Correlati ons
1. 000 -. 831
. .169
0 2
-. 831 1. 000
.169 .
2 0
Correlat ion Signif icance (2-tailed) df
Correlat ion Signif icance (2-tailed) df
Aw_0
Mo_0 Control Variables Kro
Correlations
1.000 -1.000*
. .014
5 5
-1.000* 1.000
.014 .
5 5
Correlation Coef ficient Sig. (2-tailed) N
Correlation Coef ficient Sig. (2-tailed) N Aw_5
Mo_5 Kendall's tau_b
Aw_5 Mo_5
Correlation is signif icant at the 0.05 level (2-tailed). *.
Correlati ons
1. 000 -. 884
. .116
0 2
-. 884 1. 000
.116 .
2 0
Correlat ion Signif icance (2-tailed) df
Correlat ion Signif icance (2-tailed) df
Aw_5
Mo_5 Control Variables Kro
Aw_5 Mo_5
Correlations
1.000 -.400
. .327
5 5
-.400 1.000
.327 .
5 5
Correlation Coef ficient Sig. (2-tailed) N
Correlation Coef ficient Sig. (2-tailed) N ph_0
Mo_0 Kendall's tau_b
ph_0 Mo_0
Correlati ons
1. 000 -. 471
. .529
0 2
-. 471 1. 000
.529 .
2 0
Correlat ion Signif icance (2-tailed) df
Correlat ion Signif icance (2-tailed) df
ph_0
Mo_0 Control Variables Kro