D
High-Resolution Conversion of Light Intensity to FrequencyD
Programmable Color and Full-Scale Output FrequencyD
Communicates Directly With a MicrocontrollerD
Single-Supply Operation (2.7 V to 5.5 V)D
Power Down FeatureD
Nonlinearity Error Typically 0.2% at 50 kHzD
Stable 200 ppm/°C Temperature CoefficientD
Low-Profile Lead (Pb) Free and RoHS Compliant Surface-Mount Package
Description
The TCS3200 and TCS3210 programmable color light-to-frequency converters that combine confi-gurable silicon photodiodes and a current-to-fre-quency converter on a single monolithic CMOS integrated circuit. The output is a square wave (50% duty cycle) with frequency directly propor-tional to light intensity (irradiance).
The full-scale output frequency can be scaled by one of three preset values via two control input pins. Digital inputs and digital output allow direct interface to a microcontroller or other logic circuitry. Output enable (OE) places the output in the high-impedance state for multiple-unit sharing of a microcontroller input line.
In the TCS3200, the light-to-frequency converter reads an 8 x 8 array of photodiodes. Sixteen photodiodes have blue filters, 16 photodiodes have green filters, 16 photodiodes have red filters, and 16 photodiodes are clear with no filters.
In the TCS3210, the light-to-frequency converter reads a 4 x 6 array of photodiodes. Six photodiodes have blue filters, 6 photodiodes have green filters, 6 photodiodes have red filters, and 6 photodiodes are clear with no filters.
The four types (colors) of photodiodes are interdigitated to minimize the effect of non-uniformity of incident irradiance. All photodiodes of the same color are connected in parallel. Pins S2 and S3 are used to select which group of photodiodes (red, green, blue, clear) are active. Photodiodes are 110 µm x 110 µm in size and are on 134-µm centers.
Functional Block Diagram
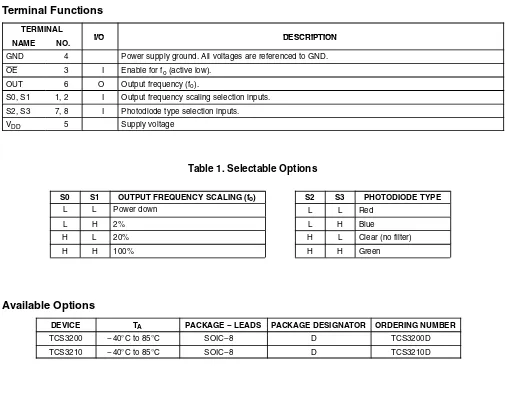
Terminal Functions
TERMINAL
I/O DESCRIPTION
NAME NO. I/O DESCRIPTION
GND 4 Power supply ground. All voltages are referenced to GND. OE 3 I Enable for fo (active low).
OUT 6 O Output frequency (fo).
S0, S1 1, 2 I Output frequency scaling selection inputs. S2, S3 7, 8 I Photodiode type selection inputs.
VDD 5 Supply voltage
Table 1. Selectable Options
S0 S1 OUTPUT FREQUENCY SCALING (fo) S2 S3 PHOTODIODE TYPE
L L Power down L L Red
L H 2% L H Blue
H L 20% H L Clear (no filter)
H H 100% H H Green
Available Options
DEVICE TA PACKAGE − LEADS PACKAGE DESIGNATOR ORDERING NUMBER
TCS3200 −40°C to 85°C SOIC−8 D TCS3200D
Absolute Maximum Ratings over operating free-air temperature range (unless otherwise noted)†
Supply voltage, VDD (see Note 1) . . . 6 V Input voltage range, all inputs, VI . . . −0.3 V to VDD + 0.3 V Operating free-air temperature range, TA (see Note 2) . . . −40°C to 85°C Storage temperature range (see Note 2) . . . −40°C to 85°C Solder conditions in accordance with JEDEC J−STD−020A, maximum temperature (see Note 3) . . . 260°C
†Stresses beyond those listed under “absolute maximum ratings” may cause permanent damage to the device. These are stress ratings only, and functional operation of the device at these or any other conditions beyond those indicated under “recommended operating conditions” is not implied. Exposure to absolute-maximum-rated conditions for extended periods may affect device reliability.
NOTES: 1. All voltage values are with respect to GND.
2. Long-term storage or operation above 70°C could cause package yellowing that will lower the sensitivity to wavelengths < 500nm. 3. The device may be hand soldered provided that heat is applied only to the solder pad and no contact is made between the tip of
the solder iron and the device lead. The maximum time heat should be applied to the device is 5 seconds.
Recommended Operating Conditions
MIN NOM MAX UNIT
Supply voltage, VDD 2.7 5 5.5 V
High-level input voltage, VIH VDD = 2.7 V to 5.5 V 2 VDD V
Low-level input voltage, VIL VDD = 2.7 V to 5.5 V 0 0.8 V
Operating free-air temperature range, TA −40 70 °C
Electrical Characteristics at TA = 25°C, VDD = 5 V (unless otherwise noted)
PARAMETER TEST CONDITIONS MIN TYP MAX UNIT
VOH High-level output voltage IOH = − 2 mA 4 4.5 V
VOL Low-level output voltage IOL = 2 mA 0.25 0.40 V
IIH High-level input current 5 µA
IIL Low-level input current 5 µA
I Supply current
Power-on mode 1.4 2 mA
IDD Supply current Power-down mode 0.1
µA
S0 = H, S1 = H 500 600 kHz
Full-scale frequency (See Note 4) S0 = H, S1 = L 100 120 kHz
Full scale frequency (See Note 4)
S0 = L, S1 = H 10 12 kHz
Temperature coefficient of responsivity λ≤ 700 nm, −25°C ≤ TA≤ 70°C ±200 ppm/°C
kSVS Supply voltage sensitivity VDD = 5 V ±10% ±0.5 %/ V
Operating Characteristics at VDD = 5 V, TA = 25
°
C, S0 = H, S1 = H (unless otherwise noted)(See Notes 5, 6, 7, and 8). Values for TCS3200 (TCS3210) are below.
PARAMETER TEST
MIN TYP MAX MIN TYP MAX MIN TYP MAX MIN TYP MAX
Ee = 47.2 µW/cm2, 12.5 15.6 18.7 61% 84% 22% 43% 0% 6%
NOTES: 5. Optical measurements are made using small-angle incident radiation from a light-emitting diode (LED) optical source. 6. The 470 nm input irradiance is supplied by an InGaN light-emitting diode with the following characteristics:
peak wavelength λp = 470 nm, spectral halfwidth Δλ½ = 35 nm, and luminous efficacy = 75 lm/W.
7. The 524 nm input irradiance is supplied by an InGaN light-emitting diode with the following characteristics: peak wavelength λp = 524 nm, spectral halfwidth Δλ½ = 47 nm, and luminous efficacy = 520 lm/W.
8. The 640 nm input irradiance is supplied by a AlInGaP light-emitting diode with the following characteristics: peak wavelength λp = 640 nm, spectral halfwidth Δλ½ = 17 nm, and luminous efficacy = 155 lm/W.
9. Output frequency Blue, Green, Red percentage represents the ratio of the respective color to the Clear channel absolute value. 10. Irradiance responsivity Re is characterized over the range from zero to 5 kHz.
11. Saturation irradiance = (full-scale frequency)/(irradiance responsivity) for the Clear reference channel.
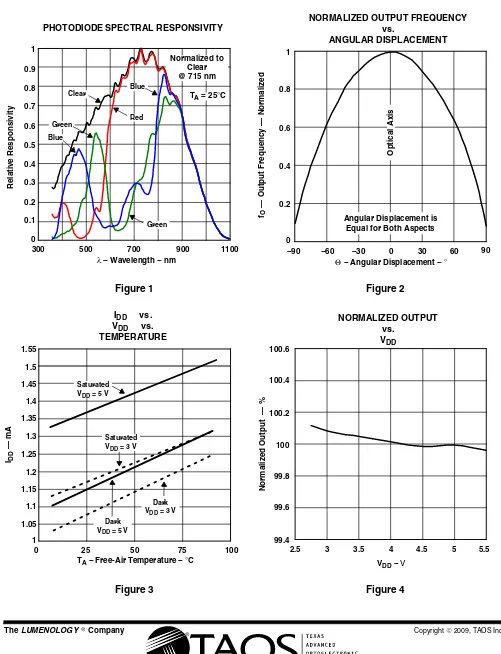
TYPICAL CHARACTERISTICS
Figure 1
300 500 700 900
Relative Responsivity
— Output Frequency — Normalized
0 Equal for Both Aspects
Figure 3
Normalized Output — %
TYPICAL CHARACTERISTICS
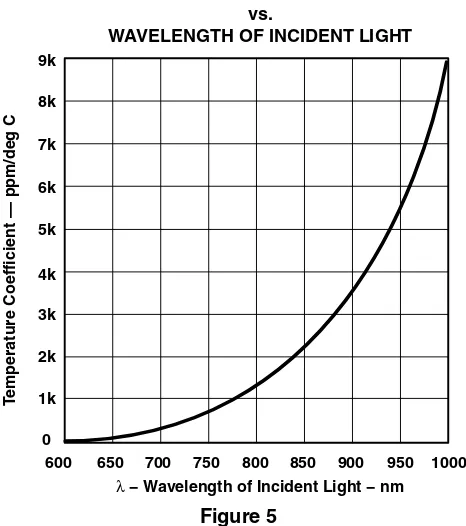
Figure 5
λ − Wavelength of Incident Light − nm
PHOTODIODE RESPONSIVITY TEMPERATURE COEFFICIENT vs.
WAVELENGTH OF INCIDENT LIGHT
T
emperature
Coefficient — ppm/deg C
600 650 700 750 800 850 900 950 1000 1k
2k 3k 4k 5k 6k 7k 8k 9k
APPLICATION INFORMATION
Power supply considerations
Power-supply lines must be decoupled by a 0.01-µF to 0.1-µF capacitor with short leads mounted close to the device package.
Input interface
A low-impedance electrical connection between the device OE pin and the device GND pin is required for improved noise immunity. All input pins must be either driven by a logic signal or connected to VDD or GND — they should not be left unconnected (floating).
Output interface
The output of the device is designed to drive a standard TTL or CMOS logic input over short distances. If lines greater than 12 inches are used on the output, a buffer or line driver is recommended.
A high state on Output Enable (OE) places the output in a high-impedance state for multiple-unit sharing of a microcontroller input line.
Power down
Powering down the sensor using S0/S1 (L/L) will cause the output to be held in a high-impedance state. This is similar to the behavior of the output enable pin, however powering down the sensor saves significantly more power than disabling the sensor with the output enable pin.
Photodiode type (color) selection
The type of photodiode (blue, green, red, or clear) used by the device is controlled by two logic inputs, S2 and S3 (see Table 1).
Output frequency scaling
Output-frequency scaling is controlled by two logic inputs, S0 and S1. The internal light-to-frequency converter generates a fixed-pulsewidth pulse train. Scaling is accomplished by internally connecting the pulse-train output of the converter to a series of frequency dividers. Divided outputs are 50%-duty cycle square waves with relative frequency values of 100%, 20%, and 2%. Because division of the output frequency is accomplished by counting pulses of the principal internal frequency, the final-output period represents an average of the multiple periods of the principle frequency.
The output-scaling counter registers are cleared upon the next pulse of the principal frequency after any transition of the S0, S1, S2, S3, and OE lines. The output goes high upon the next subsequent pulse of the principal frequency, beginning a new valid period. This minimizes the time delay between a change on the input lines and the resulting new output period. The response time to an input programming change or to an irradiance step change is one period of new frequency plus 1 µs. The scaled output changes both the full-scale frequency and the dark frequency by the selected scale factor.
APPLICATION INFORMATION
Measuring the frequency
The choice of interface and measurement technique depends on the desired resolution and data acquisition rate. For maximum data-acquisition rate, period-measurement techniques are used.
Output data can be collected at a rate of twice the output frequency or one data point every microsecond for full-scale output. Period measurement requires the use of a fast reference clock with available resolution directly related to reference clock rate. Output scaling can be used to increase the resolution for a given clock rate or to maximize resolution as the light input changes. Period measurement is used to measure rapidly varying light levels or to make a very fast measurement of a constant light source.
Maximum resolution and accuracy may be obtained using frequency-measurement, pulse-accumulation, or integration techniques. Frequency measurements provide the added benefit of averaging out random- or high-frequency variations (jitter) resulting from noise in the light signal. Resolution is limited mainly by available counter registers and allowable measurement time. Frequency measurement is well suited for slowly varying or constant light levels and for reading average light levels over short periods of time. Integration (the accumulation of pulses over a very long period of time) can be used to measure exposure, the amount of light present in an area over a given time period.
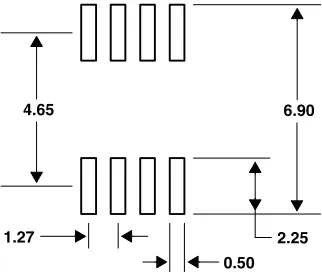
PCB Pad Layout
Suggested PCB pad layout guidelines for the D package are shown in Figure 6.
2.25 6.90 4.65
1.27
0.50
NOTES: A. All linear dimensions are in millimeters.
B. This drawing is subject to change without notice.
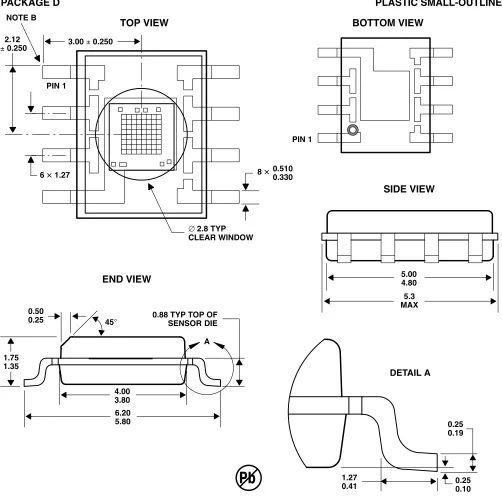
MECHANICAL INFORMATION
This SOIC package consists of an integrated circuit mounted on a lead frame and encapsulated with an electrically nonconductive clear plastic compound. The TCS3200 has an 8
×
8 array of photodiodes with a total size of 1 mm by 1 mm. The photodiodes are 110 µm×
110 µm in size and are positioned on 134 µm centers.PACKAGE D PLASTIC SMALL-OUTLINE
A 1.75
1.35 0.50 0.25
4.00 3.80 6.20 5.80 455
0.88 TYP TOP OF SENSOR DIE
5.00 4.80 5.3 MAX
1.27
0.41 0.250.10
0.25 0.19 DETAIL A PIN 1
6 y 1.27 8y0.5100.330
j2.8 TYP CLEAR WINDOW 2.12
+ 0.250 3.00 + 0.250 NOTE B
Pb
PIN 1
TOP VIEW BOTTOM VIEW
SIDE VIEW
END VIEW
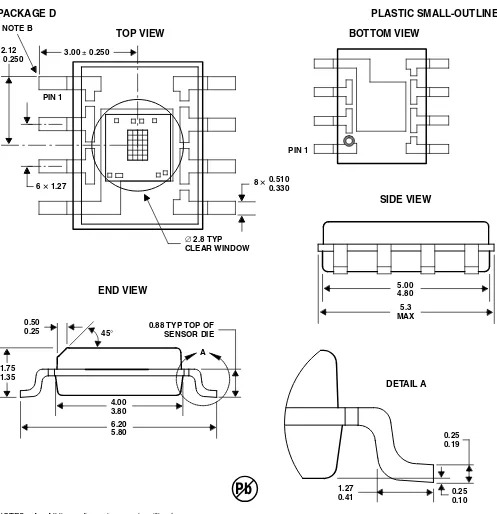
NOTES: A. All linear dimensions are in millimeters.
B. The center of the 1-mm by 1-mm photo-active area is referenced to the upper left corner tip of the lead frame (Pin 1). C. Package is molded with an electrically nonconductive clear plastic compound having an index of refraction of 1.55. D. This drawing is subject to change without notice.
MECHANICAL INFORMATION
This SOIC package consists of an integrated circuit mounted on a lead frame and encapsulated with an electrically nonconductive clear plastic compound. The TCS3210 has a 4
×
6 array of photodiodes with a total size of 0.54 mm by 0.8 mm. The photodiodes are 110 µm×
110 µm in size and are positioned on 134 µm centers.PACKAGE D PLASTIC SMALL-OUTLINE
A 1.75
1.35 0.50 0.25
4.00 3.80 6.20 5.80 455
0.88 TYP TOP OF SENSOR DIE
5.00 4.80 5.3 MAX
1.27
0.41 0.250.10
0.25 0.19 DETAIL A PIN 1
6 y 1.27 8y 0.5100.330
j2.8 TYP CLEAR WINDOW 2.12
+ 0.250 3.00 + 0.250 NOTE B
Pb
PIN 1
TOP VIEW BOTTOM VIEW
SIDE VIEW
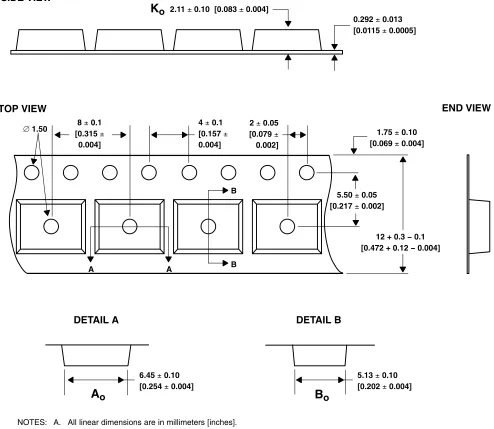
MECHANICAL INFORMATION
0.292 + 0.013 [0.0115 + 0.0005] 2.11 + 0.10 [0.083 + 0.004]
2 + 0.05 [0.079 +
0.002] 4 + 0.1
[0.157 +
0.004]
1.75 + 0.10 [0.069 + 0.004]
12 + 0.3 − 0.1 [0.472 + 0.12 − 0.004] SIDE VIEW
TOP VIEW END VIEW
DETAIL B
5.50 + 0.05 [0.217 + 0.002] 8 + 0.1
[0.315 +
0.004]
j 1.50
B
B
A A
6.45 + 0.10 [0.254 + 0.004]
5.13 + 0.10 [0.202 + 0.004] DETAIL A
A
oB
oK
oNOTES: A. All linear dimensions are in millimeters [inches].
B. The dimensions on this drawing are for illustrative purposes only. Dimensions of an actual carrier may vary slightly. C. Symbols on drawing Ao, Bo, and Ko are defined in ANSI EIA Standard 481−B 2001.
D. Each reel is 178 millimeters in diameter and contains 1000 parts.
E. TAOS packaging tape and reel conform to the requirements of EIA Standard 481−B. F. This drawing is subject to change without notice.
MANUFACTURING INFORMATION
The Plastic Small Outline IC package (D) has been tested and has demonstrated an ability to be reflow soldered to a PCB substrate.
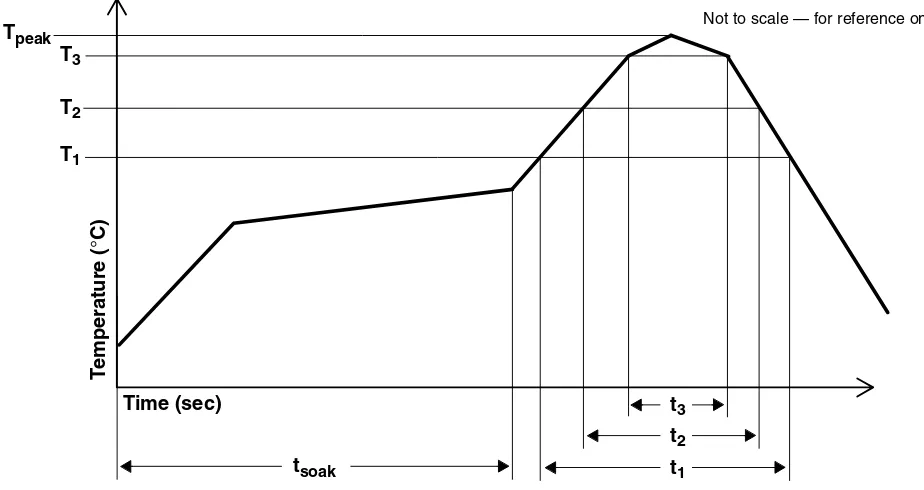
The solder reflow profile describes the expected maximum heat exposure of components during the solder reflow process of product on a PCB. Temperature is measured on top of component. The component should be limited to a maximum of three passes through this solder reflow profile.
Table 2. TCS3200, TCS3210 Solder Reflow Profile
PARAMETER REFERENCE TCS32x0
Average temperature gradient in preheating 2.5°C/sec
Soak time tsoak 2 to 3 minutes
Time above 217°C t1 Max 60 sec
Time above 230°C t2 Max 50 sec
Time above Tpeak −10°C t3 Max 10 sec
Peak temperature in reflow Tpeak 260° C (−0°C/+5°C)
Temperature gradient in cooling Max −5°C/sec
t3 t2 t1 tsoak
T3
T2
T1 Tpeak
Not to scale — for reference only
Time (sec)
T
emperature (
5
C)
Moisture Sensitivity
Optical characteristics of the device can be adversely affected during the soldering process by the release and vaporization of moisture that has been previously absorbed into the package molding compound. To prevent these adverse conditions, all devices shipped in carrier tape have been pre-baked and shipped in a sealed moisture-barrier bag. No further action is necessary if these devices are processed through solder reflow within 24 hours of the seal being broken on the moisture-barrier bag.
However, for all devices shipped in tubes or if the seal on the moisture barrier bag has been broken for 24 hours or longer, it is recommended that the following procedures be used to ensure the package molding compound contains the smallest amount of absorbed moisture possible.
For devices shipped in tubes:
1. Remove devices from tubes
2. Bake devices for 4 hours, at 90°C
3. After cooling, load devices back into tubes
4. Perform solder reflow within 24 hours after bake
Bake only a quantity of devices that can be processed through solder reflow in 24 hours. Devices can be re-baked for 4 hours, at 90°C for a cumulative total of 12 hours (3 bakes for 4 hours at 90°C).
For devices shipped in carrier tape:
1. Bake devices for 4 hours, at 90°C in the tape
2. Perform solder reflow within 24 hours after bake
PRODUCTION DATA — information in this document is current at publication date. Products conform to specifications in accordance with the terms of Texas Advanced Optoelectronic Solutions, Inc. standard warranty. Production processing does not necessarily include testing of all parameters.
LEAD-FREE (Pb-FREE) and GREEN STATEMENT
Pb-Free (RoHS) TAOS’ terms Lead-Free or Pb-Free mean semiconductor products that are compatible with the current RoHS requirements for all 6 substances, including the requirement that lead not exceed 0.1% by weight in homogeneous materials. Where designed to be soldered at high temperatures, TAOS Pb-Free products are suitable for use in specified lead-free processes.
Green (RoHS & no Sb/Br) TAOS defines Green to mean Pb-Free (RoHS compatible), and free of Bromine (Br) and Antimony (Sb) based flame retardants (Br or Sb do not exceed 0.1% by weight in homogeneous material).
Important Information and Disclaimer The information provided in this statement represents TAOS’ knowledge and belief as of the date that it is provided. TAOS bases its knowledge and belief on information provided by third parties, and makes no representation or warranty as to the accuracy of such information. Efforts are underway to better integrate information from third parties. TAOS has taken and continues to take reasonable steps to provide representative and accurate information but may not have conducted destructive testing or chemical analysis on incoming materials and chemicals. TAOS and TAOS suppliers consider certain information to be proprietary, and thus CAS numbers and other limited information may not be available for release.
NOTICE
Texas Advanced Optoelectronic Solutions, Inc. (TAOS) reserves the right to make changes to the products contained in this document to improve performance or for any other purpose, or to discontinue them without notice. Customers are advised to contact TAOS to obtain the latest product information before placing orders or designing TAOS products into systems.
TAOS assumes no responsibility for the use of any products or circuits described in this document or customer product design, conveys no license, either expressed or implied, under any patent or other right, and makes no representation that the circuits are free of patent infringement. TAOS further makes no claim as to the suitability of its products for any particular purpose, nor does TAOS assume any liability arising out of the use of any product or circuit, and specifically disclaims any and all liability, including without limitation consequential or incidental damages.
TEXAS ADVANCED OPTOELECTRONIC SOLUTIONS, INC. PRODUCTS ARE NOT DESIGNED OR INTENDED FOR USE IN CRITICAL APPLICATIONS IN WHICH THE FAILURE OR MALFUNCTION OF THE TAOS PRODUCT MAY RESULT IN PERSONAL INJURY OR DEATH. USE OF TAOS PRODUCTS IN LIFE SUPPORT SYSTEMS IS EXPRESSLY UNAUTHORIZED AND ANY SUCH USE BY A CUSTOMER IS COMPLETELY AT THE CUSTOMER’S RISK.