Analysis of Soybean Availability in Indonesia
Grace Natalia*, Dwidjono Hadi Darwanto, Slamet Hartono
Department of Agricultural Socio Economics, Faculty of Agriculture, Universitas Gadjah Mada Jln. Flora no. 1, Bulaksumur, Sleman, Yogyakarta 5528, Indonesia
*Corresponding email: [email protected]
ABSTRACT
This study aimed to determine the factors affected the soybean availability in Indonesia. This study used secondary data obtained from FAO (Food and Agriculture Organization), World Bank, and the Ministry of Finance. In this study, the data from 1964 to 2013 used to determine the factors affected soybean availability in Indonesia . The Error Correction Model (ECM) was used to determine the factors affected soybean availability. The results showed that (1) the data were stationary at first difference; (2) the data used co-integrated means long-term parameters; (3) ECT coefficient was 0.846 (significant at α = 5%) indicated the model used was valid. Soybean availability in Indonesia in the short term was positively influenced by the total planted area, total soybean consumption, and soybean import tariffs. In the long term, soybean availability in Indonesia was positively influenced by the total planted area, productivity of soybean, domestic soybean prices, soybean consumption, and rupiah exchange rate to dollar. In the long-term, availability of soybeans was negatively affected by the price of imported soybean.
Received: 6
thOctober 2016 ; Revised: 14
thDecember 2016 ; Accepted: 28
thAugust 2017
INTRODUCTION
Food is an important and strategic commodity of Indonesia because food is one of the basic human needs where its fulfillment was a shared responsibility. If it is associated with a scope of the state, food is a basic human need which its fulfillment is the rights of every Indonesian people, as mandated by the Law No. 18 Year 2012 concerning Food. The law stated that food supplies should always be sufficient, safe, high quality, diverse, affordable, and may not conflict with religion, beliefs, and culture. The GOI notes that Indonesia requires Food Systems which will provide protections for producers, as well as food consumers. The GOI asserts that its Food System is designed to fulfill basic human necessities which provides fair, equal, and sustainable benefits based on the concepts of Food Resilience, Self-Sufficiency, and Food Security.
One of the major important food commodities for consumption by the public is soybean. Soybean is a unique strategic commodity in Indonesian farm sys-tem. Soybean is included in the top three major food commodities in Indonesia, in addition to rice and
corn. The role of soybean is very important to the development of Indonesian population (Supadi, 2009). These commodities have diverse uses, mainly as an industrial raw material of vegetable protein-rich food and as raw material for animal feed industry. Aside from being a source of vegetable protein, soybean is a source of fat, minerals, and vitamins and can be processed into a variety of foods such as tofu, tempeh, tauco, soy sauce, and milk.
The development of consumption in Indonesia tends to increase greater than the increase in production in the 2002-2013 period. Soybean production has decreased, resulting in an increase in imports. Of the total domestic consumption of soybean, only an average of 30% can be met by domestic soybean production. The rest, almost 70% of soybeans, are imported.
The surge in soybean consumption is due to the increased consumption of cottage industry products (tofu and tempeh), more popularly used for substitution of animal products at some conditions. Soybeans for food processing industry in Indonesia is classified as small-medium scale, but high in number, thus causes a high consumption needs. Increased consumption
Keywords: Availability, ECM, Soybean
Ilmu Pertanian (Agricultural Science)
Vol. 2 No. 1 April, 2017 : 042-47
of soybean is not matched by the decreasing passion of farmers in soybean cultivation (Ariani 2003), which lead to a declining in planting areas and productivity is relatively stable (Oktaviani 2010). Therefore, this study aims to determine the factors which affect soybean availability in Indonesia.
MATERIALS AND METHODS
Data and Method of Collecting Data
The data used in this research were secondary data, collected as time-series data from 1964 to 2013 from several agencies, such as FAO (http://www.fao.org/faostat/en/#data) and World bank (http: //data.worldbank.org/), including data on soybean availability, soybean productivity, soybean prices, import tariffs on soybeans, and other variables which were supposed to influence soybean availability in Indonesia.
Methods of Analysis
The analytical method used was a quantitative method. Factors which presumably affected the availability of soybean in Indonesia were analysed using Error Correction Model (ECM). Data processing was done in stages, starting with grouped the data, calculating, then tabulated adjustments as necessary. The data which had been tabulated were prepared as a computer input in accordance with the model used. Calculation analysis was done using Eviews 8.
The basic concept of Error Correction Model which was developed by Engle and Granger, in principle, was the fixed equilibrium in the long term between economic variables (Gujarati and Porter, 2009). If in the short term there was an imbalance in one period, the ECM model would be corrected in the next period. EG-ECM methods were consistent with granger representation theorem, which stated that a cointegrated system always had mechanisms to correct errors. If the dependent and independent variables were cointegrated, there was a long-term relationship between the variables. Furthermore, short-term dynamics could be explained by the ECM. Meanwhile, if the ECM was a valid model, the variables used were the compilation of cointegrated variables (Insukindro, 1992).
EG-ECM analysis was done in three stages. The first phase was to test the stationarity and degree of integration. Stationarity was an important requirement to start the estimation step of the regression model with time series data. In general, it could be said that the regression equation with non-stationary variables would generate spurious regression. If the data series was not stationary,
the sample average and variance would change with the passage of time (time-varying mean and variance). The second stage was to test the cointegration. Cointegration tests were performed using the residual method based test. In these methods, if the residual was stationary at degree level, it could be concluded that there was a long-term cointegration model. Regression models used in the long-term equation were as follows:
Qs = α + β1LAT + β2PRKD + β3HKD+ β4HKI + β5JKK + β6TI + β7NTR + β8 DUMMY + ε...(1) The third stage, Error Correction Model (ECM) was formed by regressing the equilibrium error which was acquired in the long-term cointegration equation together with other variables used in this research. That equation was known as the short-term equation. Therefore, that equation was stated as follows: ∆ Qs = α + β1∆LAT + β2∆PRKD + β3∆HKD+ β4∆HKI +β5∆JKK + β6∆TI + β7∆NTR + β8∆DUMMY + β9RES (-1)...(2) where Qs was Soybean Availability; LAT was the Total Planted Area; PRKD was Productivity of Soybean; HKD was Domestic Soybean Prices; HKI was Import Soybean Prices; JKK was the Total Consumption of Soybean; TI was a Soybean Import Tariff; NTR was the Rupiah Exchange Rate and DUMMY was Crisis Monetary Variable in Indonesia (1998) where 0 for the period before the crisis (1964-1997) and 1 for the period after the crisis (1998-2013 year); RES (-1) was residual in period t-1; α was the intercept; β1- β8 was the regression coefficient in the short term; and β9 was the regression coefficient Error Correction term (ECT).
RESULT AND DISCUSSION
Data stationarity test (unit root test) was done on each variable used in soybean availability test in Indonesia. After the test, various results were obtained on stationarity test (Table 1). Qs, LAT, PRKD, HKD, HKI, JKK, TI, NTR, and DUMMY were not stationary in level 1 to 10%. Therefore, a stochastic differential process must be done, by decreasing the sets of time-series data with the unit root. The stochastic differential process was going to change the time-series data, from unstationary to stationary, and had the constant mean and variance between periods. After the stochastic differential was done, Qs, LAT, PRKD, HKD, HKI, JKK, TI, NTR, and DUMMY became stationary on first difference 1 to 10%.
variables as desired by economic theory (Table 2). This test was very important if we wanted to develop a dynamic model, especially the model of Error Correction Model (ECM) which included key variables exist cointegration regression related.
After obtaining the long-term equation, a test was needed to be done to determine whether there was a cointegration relation between the variables in the model or not. The test was done by doing data stationary test on the residual equation.
From Table 3, it could be seen that there was a co integration in the model. These results obtained from the residual probability value was less than the alpha level of 10% (prob = 0.000 <0.10) and the value of t-statistic PP was larger than the critical value at the 10% level, so H0 was rejected, which meant that the variables were stationary at equilibrium error. Stationary variables indicated that there was a relationship co integration model. So it could be confirmed that there was a co integration relationship between variable Qs, LAT, PRKD, HKD, IPR, JKK, TI, NTR, and DUMMY. The movement showed that the relationships among the variables could be used to estimate the
long-term equation. In other words, in any short-term period throughout the studied variables tended to adjust to each other in order to achieve long-term balance.
The Formulation of Error Correction Model (ECM)
Insukindro (1999) stated that the ECM could analyse many variables, including short and long-term economic phenomenon and assessed the consistency of empirical model of the econometric theory, and in search of a solution to the problem of time series variables were not stationary and spurious regression. Formation of ECM was done by regressing equilibrium error which was obtained on the long-term cointegration equation, together with other variables used in
Table 1.Unit Root Test Result
Remarks :***significant on α=1%
Variable Phillips-Perron test statistic
Level First Difference
Soybean Availability (Qs) -0.870ns -9,93***
Total Planted Area (LAT) -0.495ns -7,32***
Productivity of Soybean (PRKD) 4.734ns -7,57***
Domestik Soybean Prices (HKD) 3.308ns
-5,85***
Import Soybean Prices (HKI) 0.951ns -7,46***
Total Consumption of Soybean (JKK) 0.847ns -10,04***
Soybean Import Tarrif (TI) -1.545ns -6,76***
Rupiah Exchange Rate (NTR) -1.33ns -8,14***
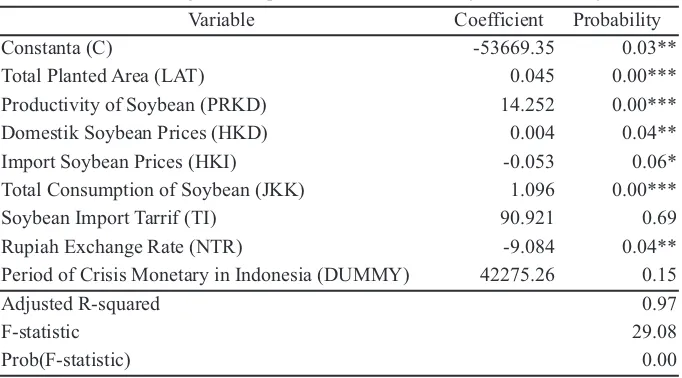
Remarks: *significant on α=10%; **significant on α=5%; ***significant on α=1% Table 2.Result of Long-Term Equation on Indonesia’s Soybean Availbility
Variable Coefficient Probability
Constanta (C) -53669.35 0.03**
Total Planted Area (LAT) 0.045 0.00***
Productivity of Soybean (PRKD) 14.252 0.00***
Domestik Soybean Prices (HKD) 0.004 0.04**
Import Soybean Prices (HKI) -0.053 0.06*
Total Consumption of Soybean (JKK) 1.096 0.00***
Soybean Import Tarrif (TI) 90.921 0.69
Rupiah Exchange Rate (NTR) -9.084 0.04**
Period of Crisis Monetary in Indonesia (DUMMY) 42275.26 0.15
Adjusted R-squared 0.97
F-statistic 29.08
Prob(F-statistic) 0.00
Table 3.Co-integration Test Results
t-Statistic Probability
Value of t-statistic Phillips-Perron -6.19 0.00***
Critical Value 1% level -2.61
5% level -1,94
10% level -1,61
this research. After testing the assumptions of classical form multicollinearity test, heteroscedasticity test, autocorrelation test, and test for normality, it could be concluded that the estimation of the model already is BLUE or best, linear, Unbiased, and estimate. For that model, we could estimate parameters using the Error Correction Model.
The results of the formation of the ECM for the factors affected the soybean availability in Indonesia, either simultaneously or partial, were shown in Table 4.
Wheter the ECM model formed was eligible or not in use could be seen from the coefficient of determination (R2) of ECM model. This value was influenced by the number of independent variables. This meant that the additional independent variable existed, the higher its value would continue to rise. Therefore, it was necessary to make adjustments to eliminate the effects of the addition of variables. Such adjustment was called adjusted coefficient of determination (adj-R2). Based on the output produced in the research, the adj-R2value was 0.97. It could be concluded that the models created quite good. The independent variable and error term together (simultaneously) were able to explain the variation in the dependent variable under this study amounted to 97%, while the rest was explained by other variables which were not included in the model.
Rated speed of adjustment derived from the coefficient of ECT on the model showed close to 1 (one). It stated that the adjusment of the actual value towards a new equilibrium value required adjustment to change very quickly. ECT coefficient value analysis concluded indications of long-term
relationships between variables. This indication meant that any change past the shock of one unit would produce a change in the value of the availability of soybean which was greater than one, and the shock would adjust to the new balance. The magnitude of the error correction of -0.84 indicated that an adjustment to the equilibrium conditions of soybean availability by 1.19 years (1 / 0.84). These results indicated that the long-term equilibrium condition would occur within 1.19 years.
The result model of national soybean availability in 1964-2013 showed that the eight independent variables (total area planted, productivity of soybeans, domestic soybean prices, price of imported soybeans, soybean consumption, soybean import tariffs Indonesia, rupiah exchange rate, and a dummy variable the state of the monetary crisis in Indonesia), five of which (total area planted, productivity of soybeans, domestic soybean prices, price of imported soybeans, soybean consumption amount, and rupiah exchange rate) were found to have a significant influence on the availability of domestic soybeans in the long term. While in the short term, only three independent variables were significantly influenced the availability of soybean in Indonesia, i.e. planted area, number of soybean consumption, and import tariffs.
At the significant level α = 5%, total planted area (LAT) variable was positive and had significant impact on the soybean availability. Total planted area variable had a coefficient of 0,045, which meant that soybean availability could increase by 0.045 tonnes if the total planted area was increased by 1 hectar in the long term. While in the short term, total planted area variable had a coefficient of 0.049, which meant that
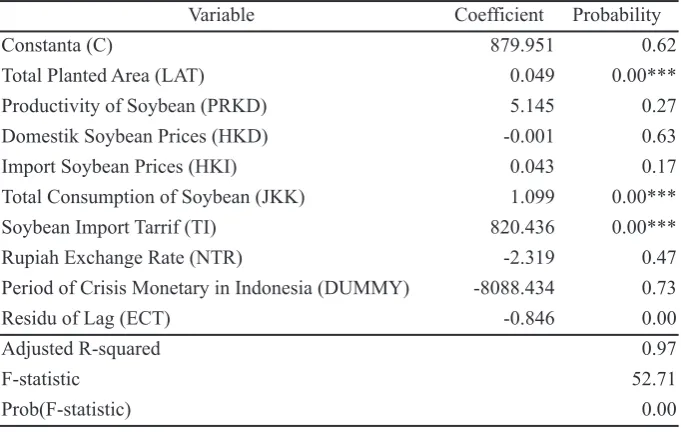
Table 4.Result of ECM Test Results on Indonesia’s Soybean Availability
Variable Coefficient Probability
Constanta (C) 879.951 0.62
Total Planted Area (LAT) 0.049 0.00***
Productivity of Soybean (PRKD) 5.145 0.27
Domestik Soybean Prices (HKD) -0.001 0.63
Import Soybean Prices (HKI) 0.043 0.17
Total Consumption of Soybean (JKK) 1.099 0.00***
Soybean Import Tarrif (TI) 820.436 0.00***
Rupiah Exchange Rate (NTR) -2.319 0.47
Period of Crisis Monetary in Indonesia (DUMMY) -8088.434 0.73
Residu of Lag (ECT) -0.846 0.00
Adjusted R-squared 0.97
F-statistic 52.71
Prob(F-statistic) 0.00
the availability of soybeans would increase by 0.049 tonnes if the total planted area was increased by 1 hectar in the long term. These results suggested that soybean total planted area had a positive and significant impact on soybean availability in Indonesia, both in the long term and the short term. Ramadhani (2014) also stated that the planted area had a positive coefficient and significant influence on the soybean availability. This was because the total planted area would affect directly to the amount of production of a commodity. Wider planted area would cause an increase in the amount of soybean produced.
The long-term productivity variable had a coefficient (PRKD) of 14,252. It showed that the higher the productivity, the higer the availability of soybeans. If productivity rose 1 ton per hectare, the availability of soybeans would increased by 14,252 tonnes. The probability value of the productivity variable was less than alpha level of 10% (prob = 0.000 <0.10), suggesting a positive influence and significant impact in the soybeans availability. Limi (2012) also stated that productivity variable showed a positive coefficient, but not a significant effect. Meanwhile, the short-term effect was not significant because of the value of the variable productivity probability was greater than 10% alpha level.
The long-term domestic soybean price variable (HKD) had a coefficient of 0.004. It showed that rising soybean prices by 1 rupiah would increase the soybean availability by 0.004 tonnes. At the significant level of 5%, domestic soybean prices was statistically significant to the soybean availability. Meanwhile in the short-term, domestic soybean price variable was not significantly affected soybean availability. Ramadhani (2014) also stated that domestic soybean prices had a positive coefficient and a significant effect to the soybean availability.
At the significant level of 10%, soybean import price (HKI) variable was significantly affected the soybean availability in the long-term. This could be proved with the value of the probability of imported soybean price variable which was less than the alpha level of 10% (prob = 0.06 <0.10). Imported soybean price variable had regression coefficient of -0.053, showed that if the price of soybean imports rose by 1 rupiah, it would lower the availability of soybean by 0.053 tonnes. Meanwhile in the short-term, the price of imported soybean was not significantly affected the soybeans availability.
The total soybean consumption (JKK) variable showed a significant positive influence to both the long-term (prob = 0.00 <0.10) and the short term (prob
= 0.00 <0.10). The estimation results indicated that the short-term total soybean consumption variable had a regression coefficient of 1.099, which meant that the soybean availability would increase by 1,099 if total soybean consumption increased by 1 tonnes. This occurred because the total soybean consumption was the total amount of soybean consumption by industry, households, and livestock feed. Thus in the short-term, an increase in the total of soybean consumption would actually encourage soybean availability, both from domestic production and imports. It was not much different from the short-term. Total soybean consumption variable on a long-term showed a regression coefficient of 1.096, which meant that the long-term soybean availability would increase by 1.096 tonnes if the total soybean consumption increased by 1 tonnes. Similarly as stated Ramadhani (2012), the productivity variable showed a positive coefficient, but it did not show any significant effect.
The continuity of soybean import from time to time encouraged the government to issue the policy of import tariffs on soybeans, either 2.5%, 5%, 10%, to 20%. The import tariff was expected to encourage soybean farmers in Indonesia to boost their domestic production. The long-term import tariffs (TI) variable showed a positive effect, but not a significant one to the availability of soybean, so that any change in the tariff did not affect soybean availability in the long term. Meanwhile in the short-term, import tariffs variable showed a positive and significant influence to the soybean availability (prob = 0.00 <0.10) with a regression coefficient of 820.436. If the import tariff increased by 1%, the soybean availability would be increased by 820.436 tonnes.
The rupiah exchange rate on long-term (NTR) showed a negative and significant effect to the soybean availability (prob = 0.04 <0.10) with a regression coefficient of -9.084. If the rupiah exchange rate increased by 1 rupiah against the dollar, the availability of soybean would decrease by 9.084 tonnes. Sembiring (2015) in their study also confirmed that there were significant inverse (negative) relationship between the exchange rate with the soybean availability. Meanwhile in the short-term, rupiah variable showed a negative influence but not significant to soybean availability. Any changes in the exchange rate did not affect soybean availability in the short-term.
However, both showed there were no significant effect to the soybean availability. This showed that the situation before and after monetary crisis in Indonesia (1997-1998) did not give any influence to soybean availability, both short-term and long-term period.
CONCLUSION
Based on the results, the variables provided positive and significant impact on the availability of soyben in short term in Indonesia (1964-2013) were total area planted, total soybean consumption, and soybean import tariff. In the long term, variables provided positive and significant impact on the soybean availability in Indonesia were total planted area, productivity of soybean, the price of domestic soybean, total soybean consumption, and the rupiah exchange rate. Meanwhile, the price of imported soybean gave a negative and significant impact. The existence of a state of crisis (Dummy variables) did not cause a significant effect to the soybean availability in Indonesia.
REFERENCES
Ariani, M. 2003. Penawaran dan Permintaan Komoditas Kacang-Kacangan dan Umbi-Umbian di Indonesia.
Jurnal Socca., 5(1): 48-56.
Gujarati, D. N. and D. C. Porter. 2009. Basic Econometrics.
5th Ed., New York: Mc Graw Hill.
Insukindro. 1992. Pembentukan Model dalam Penelitian Ekonomi. Jurnal Ekonomi dan Bisnis
Indonesia, 7(1): 1-8.
Insukindro. 1999. Pemilihan Model Ekonomi Empirik dengan Pendekatan: Koreksi Kesalahan. Jurnal
Ekonomi dan Bisnis Indonesia, 14(1):
451-471.
Limi, M. A. dan H. Batoa. 2012. Analisis Faktor-faktor Yang Mempengaruhi Ketahanan Pangan Di
Sulawesi Tenggara. [online] Available at :
http://uho.ac.id/karya-ilmiah.php?read=6272 [Accessed at 20 Dec 2015].
MacKinnon, J. G. 1996. Numerical Distribution Functions for Unit Root and CointegrationTests.
Journal of Applied Econometrics, 11:
601-618.
Oktaviani, R. 2010. Impor Kedelai: Dampaknya terhadap Stabiliats Harga dan Permintaan Kedelai
Dalam Negeri. [online] Available at:
h t t p s : / / a g r i m e d i a . m b . i p b . a c . i d / uploads/doc/2010-07-06_rinaO-Impor_ Kedelai.doc/ [Accessed 20 Dec 2015]. Ramadhani, D. Anggi dan R. Sumanjaya. 2014.
Analisis Faktor-Faktor Yang Mempengaruhi Ketersediaan Kedelai Di Indonesia. Jurnal
Ekonomi dan Keuanga,. 2(3): 131-145.
Sembiring, T. Egatama., S. N. Lubis, dan M. Jufri. 2015. Faktor-faktor yang Mempengaruhi Ketersediaan Dan Konsumsi Kedelai Di Sumatera Utara. Journal On Social Economic Of Agriculture
And Agribusiness,4(11): 1-11.
Supadi. 2009. Dampak impor kedelai berkelanjutan terhadap ketahanan pangan. Pusat Analisis Sosial Ekonomi dan Kebijakan Pertanian.