Home Garden Eficiency in Kulon Progo District, Yogyakarta
Ekalia Yusiana*, Slamet Hartono, Irham
Department of Agricultural Socio Economics, Faculty of Agriculture, Universitas Gadjah Mada Jln. Flora no. 1, Bulaksumur, Sleman, Yogyakarta 5528, Indonesia
*Corresponding email: liayusiana@ymail.com
ABSTRACT
This study amis at determining factors that become source of yard farming inefficiency of both KRPL farmers (those who participated in Sustainable Food House Area program) and non KRPL farmers in Kulon Progo. Data Envelopment Analysis (DEA) was used with input and output-oriented assumptions to measure the efficiency score of yard farming observed. This Study showed that the sources of inefficiency in the yard farming were the excessive use of labor, cost and land area. Therefore, it should be adjusted with the number of workers to be reduced by 32%, farming cost by 31%, and the land area by 39%. Meanwhile, the output approach must be adjusted by adding 0.8% output for production and 1.17% for income.
Received: 10
thFebruary 2016 ; Revised: 6
thDecember 2016 ; Accepted: 22
thFebruary 2017
INTRODUCTION
Kulon Progo Regency is one of districts in Yogyakarta Province divided into 12 sub districts, covering 88 villages and 930 hamlets. Land usage in Kulon Progo Regency consists of paddy and non-paddy fields. Paddy field is divided into irrigated and non-irrigated field. Non-paddy field is all the land besides paddy fields such as yards, huma, fields, gardens, plantations, pools, ponds, lakes, swamps, and others. The land usage in Yogyakarta shows that Kulon Progo district is the second largest land area, especially non-paddy field (including yards) of 48,330 ha after Gunungkidul district (140,671 ha). While the narrowest land area is the city of Yogyakarta at 3,179 ha after Bantul district (35,214 ha) and Sleman district (34,859 ha). From these data, it can be concluded that the yard area, especially in Kulon Progo district, is potential but it has not been used optimally and efficiently until now. The use of land in Kulon Progo, including rice field 10,732 ha (18.30%); moor 7,145 ha (12.19%); mixed garden 31,131 ha (53.20%); township area of 3,337 ha (5.69%); 1,025 ha of forest (1.75%); smallholder plantation 486 ha (0.80%); badlands 1,225 ha (2.09%); reservoir 197 ha (0.34%); ponds 50 ha (0.09%); and other land area of 3,315 ha (5.65%).
From these data, it can be seen that the yard area (moor 12.9%) in Kulon Progo district is the second highest percentage after paddy field. Yard area has potential to be used optimally, but it has limited human resources, knowledge and caring environ-ment for yard farming. Therefore, the land use is still limited and not optimal (BPS, 2014).
Sustainable Food House Area (KRPL) is Ministry of Agriculture program in order to optimize the environmentally friendly yards in a region. Home area can be realized in other regions of the territory between RukunTetangga(neighborhoods in certain area), region of RukunWarga(neighborhood in a certain smaller area), and village/hamlet area (National Agency for Agricultural Research and Development, 2012).
Yard farming patterns is generally a mixture plantation (multi-commodity). Farmers plant a wide variety of commodities in the form of annual and seasonal crops. So the commodities can be food crops, horticulture, plantations and even for livestock and fish. Certainly in selecting commodities, farmers are already considering the main purpose of planting that is to simply meet their daily needs food, commercial, conservation, and so forth (Saptana et al., 2012).
The yard is an open field located around the residence. The yard of the house can be utilized Keywords: DEA, Farming Inefficiency, KRPL
Ilmu Pertanian (Agricultural Science)
Vol. 1 No. 3 Decemer, 2016 : 111-114
Available online at http://journal.ugm.ac.id/jip
DOI: doi.org/10.22146/ipas.9202
according to our tastes and desires, for example, by planting productive crops such as ornamental plants, fruits, vegetables, spices and medicines (Kurnianingsih et al., 2013). Farming in the yard if managed intensively in accordance with the potential of the yard, in addition to meet the needs of household consumption, also can provide income contribution for the family. The yard have multipurpose functions. To produce: (1) food materials in addition to the yield of the rice fields and the upland; (2) vegetables and fruits; (3) poultry, small livestock and fish; (4) spices, herbs and perfumes; (5) handicraft materials; (7) cash (Yulida, 2012). Traditional farming contributes to household food security by providing direct access to food that can be harvested, prepared and fed to family members, often on a daily basis. Even very poor, landless or near landless people practise gardening on small patches of homestead land, vacant lots, roadsides or edges of a field, or in containers (Okemwa, 2015).
A wide range of farming issues in yard farming makes it has not been properly utilized. Yard farming was considered as a sideline of the actual farming. It can be seen from the many types of plants that grew in the yard area has less economic value to worthless as weeds and others. Such circumstance indicates that the handling and maintenance of the yard has not been carried out intensively and efficiently. In fact, utilizing the yard area intensively and efficiently can increase family income (Warnita et al., 2008).
Yard area efficiency was important to measure the level of resource usage in a process. The more efficient/less of resources used, then the process was claimed to be more efficient. An efficient process was characterized by improvement process so that it became cheaper and faster. It was intended that the use of resources in their yards can be used for food sufficiency within the household. This study was aimed at determining the factors that become a source of yard farming inefficiency of both KRPL farmers (farmers who participated in Sustainable Food House Area program) and non KRPL farmers in Kulon Progo.
Aldeseit (2013) stated to achieve the objective of the study Data Envelopment Analysis (DEA) was used to analyze data collected from 120 dairy farms by in Jordan. Scale efficiency scores were estimated using constant return to scale and variable return to scale DEA models. The results revealed that the sampled farms were not operating at an optimal size. On average, the scale efficiency estimated at approximately 0.66, indicating scale-inefficiency
under both constant returns to scale and variable returns to scale. This inefficiency indicates that the sampled dairy producers were over using inputs to produce their level of output. To increase scale of operation dairy farmers in Jordan should increase the overall degree of technical efficiency. Extension services can assist in identifying the best management practices on how to improve farms technical efficiency. Kuo et al. (2014) stated in their research that data envelopment analysis (DEA), which can evaluate the decision-making unit with multiple inputs and multiple outputs, was applied to assess economic and environmental factors in this research.
MATERIALS AND METHODS
This study used descriptive method. This basic method was aimed at identifying facts or characteristics of a particular population or field factually and accurately (Rakhmat, 2005). This research was conducted in Kulonprogo. The research location was selected intentionally (purposive), which is in Girimulyo, Nanggulan, and Wates District. Sample determination was conducted by using simple random sampling of farmers who are at the site that was selected based on the specifications of farmers conducting yard farming. The selected villages were the Bendungan Village, Wates District (20 samples), Pendowo Rejo Village, Girimulyo District (20 samples), and Girimulyo Village, Nanggulan District (20 samples) because the village is a village that is used to run the program KRPL. The total sample were 60 farmers. From 20 samples of each village, they were divided into two kinds of sample, 10 samples were farmers who followed KRPL and 10 samples of farmers who did not.
In analyzing the data, this research used DEA (Data Envelopment Analysis) oriented input (CCR-I) and Output oriented (CCR-O) model. DEA approach was first developed theoretically by Cooper et al. (1978). Efficient farmers means they can use a combination of input and output efficiently to achieve specified output level that will form the efficient frontier. The inputs in this analysis were the number of workers (HKO), farming cost (IDR) and the land area (m2). While the outputs used were
production (kg) and income (IDR) (Table 1). To indentify factors that resulting yard farming inefficient of both KRPL and non-KPRL Farmer in Kulon Progo district, Data Envelopment Analysis (DEA) model that uses CCR (Charnes, Cooper, and Rhodes) were used to solve the problem of Fractional Programming (FPO) basically to get the value of the
ISSN 0126-4214 (print) ISSN 2527-7162 (online)
113 Ilmu Pertanian (Agricultural Science) Vol. 1 No. 3, December 2016
weighing input (vi, i = 1, ... m) and the value of the weighing output (ur. r = 1, …, s) as follows (Cooper et al., 2006). weighing output to kerth.
Input-output approach formula: max θ =
Production assumption limits CRS defines the total technical efficiency in the form of the same proportion increase in the output as the achievement of an organization that was taking a number of inputs with the same quantity. Meanwhile, VRS assumption on production limit measured technical efficiency purely due to the increase in output that can be achieved by an organization when using variable inputs. The comparison between the efficiency models value of CRS and VRS produced Efficiency Scale (SE), with the formula:
Efficiency Scale (SE) =
If Efficiency Scale = 1 (100%), the farming was operated under the assumption of CRS, whereas otherwise, the company was characterized by the
assumption of VRS. By comparing the assumption of CRS an VRS, if the size of the operations of a work unit was reduced or enlarged, the efficiency may still be down. Work unit which was in Efficient Scale was a unit that operates at the optimum return to scale. This Efficiency Scale determined whether the work unit was on the economies of scale or the other way around. Therefore, it was able to describe the optimum ability of work unit in empowering resources in generating output.
RESULT AND DISCUSSION
The analysis results were calculated by using two approaches, input and output approaches by using DEA software to determine the source of inefficiency of yard farming in Kulonprogo. Based on the calculations by the DEA method, it can be identified the source of each farmer’s inefficiency, so that the question on how to make efficient farming can also be identified. The way to do so was adjust the actual value and the target value. Here is the analysis result of the average DMU (Variable input and output) for the entire sample of both KRPL farmers and non-farmers KRPL in Table 2.
The use of input was excessive over the target. It can be seen as the workers variable target as much as 32%. To reach the intended target and meet efficiency farming, each input must be adjusted. The amount of labor used to be reduced by 32%, farming cost by 31%, and the land area by 39%. This was conducted because the input adjustment in this analysis was calculated only by using the input approach so that farming can be optimized and more efficient.
In addition to the input approach, output approach was also calculated by using DEA analysis. Output approach to this analysis was intended to determine the source of inefficiency of the farmers, so that it can be identified which farmers (DMU) are not efficient. If the source of inefficiency can be identified,
ISSN 0126-4214 (print) ISSN 2527-7162 (online)
u y u y u y
Workers v Cost v Land Ar
1 2 Table 1.Variables used in the analysis of Farm Yard
Remarks: Primary Data Analysis 2015
Variable Kinds of Variabel Satuan
Number of workers Input HKO
Farming Costs Input IDR
Land area Input M2
Production Output Kg
Income Output IDR
Variable Actual Adjustment Target Percentage (%)
Workers (HKO) 9.07 -6.11 2.96 32
Cost 615,262.24 -423,938.24 191,324.00 31
Land Area 326.58 -174.99 151.88 39
Table 2.Actual Adjustment Value with Value Target on DEA Analysis
Remarks: Primary Data Analysis 2015
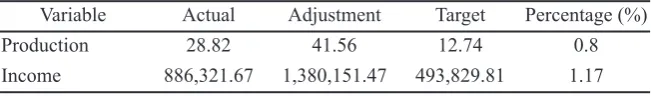
Table 3.Actual Adjustment Value with Value Target on DEA Analysis
Remarks: DEA Analisis 2015
Variable Actual Adjustment Target Percentage (%)
Production 28.82 41.56 12.74 0.8
then the adjustment can be more efficient by adjusting the input and maximize the output produced. The amount of adjustment for each DMU was different, so that it is important to identify which DMU that was not efficient.
In the output approach, it can also be identified the sources of output inefficiency. Once the output generated was not optimal, it was necessary to increase the output in accordance with the actual value and the target generated. If the target was hard to achieve, additional output should be added in a certain percentage. This can be seen in Table 3.
Based on calculations by using DEA method in Table 4, it can be identified the source of each farmer’s inefficiency. It can also showed how to make efficient farming. The way to do so was by adjusting the actual value with the target value. Each output should be adjusted to reach farming efficiency. The number of total production must be increased by 0.8%, and incomes by 1.17%. The adjustment was not necessary for input to output approach since this analysis was only conducted for output level management (CCR-Output approach).
CONCLUSION
Based on the analysis and discussion, it can be concluded that there was of excessive use of input in workers variable, cost, and land area that should be adjusted. Those variables should be reduced by 32% for workers, by 31% for farming cost, by 39% for land area. Therefore, the source of inefficiency of yard farming of was the inputs used.The output produced should be adjusted by adding an output of 0.8% for production and 1.17% for yard farming income.
ACKNOWLEDGEMENT
To all lecturers and administrative staffs, of the Department of Social Economics of Agriculture who had helped in the completion of writing this journal. To both parents and the entire extended family for the support and motivation as well as prayer so the writers was able to complete this paper and all friends in agricultural economics graduate class of 2013 which had helped and provided motivation for finishing this article.
REFERENCES
Aldeseit, B. 2013. Measurement of Scale Efficiency in Dairy Farms: Data Envelopment analysis (DEA) Approach. Journal of Agricultural Science, 5(9): 37-43.
BPS. 2014. Penggunaan Luas Lahan di Daerah Istimewa
Yogyakarta Tahun 2014. [online] Available at: http://www.bps.go.id/ [Accessed 11 February 2015].
Cooper, W. W., A. Charnes, and E. Rhodes. 1978. Measuring The Efficiency of Decision Making Units. European Journal of Operational Research, 2(6): 429-444.
Cooper, W. W., M. L. Seiford; and K. Tone. 2006. Introduction to Data Envelopment Analysis and Its Uses. [ebook] USA: Springer Science Business Media. Avaliable at: http://www.springer.com/us/book/978038728 5801/ [Accessed 11 February 2015].
Kurnianingsih, A., Nusyirwan, E. D. Setyati, dan Y. Syawal. 2013. Optimalisasi Lahan Pekarangan dengan Budidaya Tanaman Lidah Buaya yang Berkhasiat Obat di Desa Purna Jaya Kecamatan Indralaya Utara Kabupaten Ogan Ilir. Jurnal Pengabdian Sriwijaya, [online], p. 21-24. Available at: http://ejournal. unsri.ac.id/index.php/jpsriwijaya/article/down load/1545/604/ [Accessed 11 February 2015]. Kuo, H. F., H. L. Chen and K. W. Tsou. 2014. Analysis of Farming Environmental Efficiency Using a DEA Model with Undesirable Outputs. APCBEE Procedia, 10: 154-158.
National Agency for Agricultural Research and Development. 2012. Pengembangan Kawasan Rumah Pangan Lestari (KRPL). Jakarta: Badan Penelitian dan Pengembangan Pertanian, pp. 1-26.
Okemwa, E. 2015. Effectiveness of Aquaponic and Hydroponic Gardening to Traditional Gardening. International Journal of Scientific Research and Innovative Technology, 2(12): 21-52. Rakhmat, J. 2005. Metode Penelitian Komunikasi.
Bandung: PT Remaja Rosdakarya.
Saptana, A. dan Purwantini, T. B. 2012. Potensi dan Prospek Pemanfaatan Lahan Pekarangan untuk Mendukung Ketahanan Pangan (Potential Use of Backyard Land For Food Security). Forum Penelitian Agro Ekonomi, 30 (1): 13-30.
Warnita, I. Chaniago, N. Kristina, dan A. Kusumawati. 2008. Penyuluhan Dan Pemanfaatan Lahan Pekarangan Sempit Dengan Teknologi Hidroponik dalam Rangka Meningkatkan Kesejahteraan Keluarga. Warta Pengabdian Andalas,14 (21): 110-118 Yulida, R. 2012. Kontribusi Usahatani Lahan
Pekarangan terhadap Ekonomi Rumah Tangga Petani di Kecamatan Kerinci Kabupaten Pelalawan. Indonesian Journal of Agricultural Economics (IJAE), 3 (2): 136-154.
ISSN 0126-4214 (print) ISSN 2527-7162 (online)