Competitiveness of Tea Exports in Asean: A Constant Market Share Analysis
Nadia Oktaviana*, Masyhuri, Slamet Hartono
Department of Agricultural Socio Economics, Faculty of Agriculture, Universitas Gadjah Mada Jln. Flora no. 1, Bulaksumur, Sleman, Yogyakarta 5528, Indonesia
*Corresponding email: [email protected]
ABSTRACT
This study was aimed to find out the competitiveness of tea exports in ASEAN during 2011-2014. Competitiveness indicates a country ability to compete with other countries in international trade activities. Constant Market Share (CMS) employed to understand the weaknesses and strengths of a country viewed from the effect of exports growth. CMS results showed that the major weakness of tea exports in Malaysia, Singapore, Thailand, and Vietnam is the effect of market distribution. Market distribution effect indicated that their exports to countries with a high demand for tea in the world. On the other hand, the strengths of tea exports in Malaysia, Singapore, Thailand, and Vietnam are the effect of world exports growth, commodity composition effect, and the competitiveness effect. Conversely, the major weakness of tea exports in Indonesia is competitiveness effect, while the strengths are the effect of world exports growth and the effect of market distribution.
Received: 22
thAprih 2016 ; Revised: 9
thJune 2016 ; Accepted: 10
thAugust 2017
INTRODUCTION
Tea is one of the most popular and lowest cost beverages in the world and consumed by a large number of people. Owing to its increasing demand, tea is considered to be one of the major components of world beverage market. The global market for hot beverages (coffee and tea) is forecasted to reach US$69.77 billion in value and 10.57 million tons in volume terms by the year 2015(GIA cit. Basu et al., 2010).
Tea is consumed by a wide range of age groups in all levels of society. More than three billion cups of tea are consumed daily worldwide. Tea is considered to be a part of the huge beverage market, not to be seen in isolation just as a ‘commodity’. Tea active ingredients are of interest to functional foods markets (Hicks, 2009).
According to Chang (2015), world tea production (black, green, and instant) increased significantly by 6 percent to 5.07 million tons in 2013. Black tea output increased by 5.4 percent in response to continued firm prices while green tea output increased by 5.1 percent. China remained to be the largest tea producing country with an output of 1.9 million tons, accounting for more than 38 percent of the world total, while
production in India, the second largest producer, also increased up to 1.2 million tons in 2013. Output also increased in the two largest exporting countries where production reached 436,300 tons in Kenya and 343,100 tons in Sri Lanka.
World tea consumption continued to increase in 2013. Total tea consumption increased by nearly 5 percent in 2013 to 4.84 million tons, which was underpinned by the rapid growth in per capita income levels, particularly in China, India, and other emerging economies. Growth in demand was particularly marked in China. After a spectacular rise in consumption in recent years exceeding 8 percent annually, total consumption increased by 9 percent in 2013, on a year to year basis, to reach 1.61 million tons, the largest in the world. In India, consumption expanded by 2.4 percent in 2009 and 6.6 percent in 2013 to reach 1 million tons (Chang, 2015).
High consumption of tea, besides increasing impact on world tea production, also gave an impact on the trading activities of tea in international market. Tea became one of the industrial products which have the potential to be developed. Many country explore and change to not only the tea powder tea packaging but also instant and ready to drink. Some large commercial Keywords: ASEAN, Competitiveness, Constant Market Share, Export of Tea
Ilmu Pertanian (Agricultural Science)
Vol. 1 No.2 August, 2016 : 088-093
traders of black tea globally are Unilever-Lipton PG Tips (Multinational), Associated British Foods-Twinings (United Kingdom), Tata Tea - Tetley (India), and Teekanne Group (Germany) (Hicks, 2009).
Industries of tea are increasing in demand in the international beverage market and led to increased exports or imports. UNCOMTRADE (2015) captured that there are approximately 150 countries in the world that involved in tea export and import activities. ASEAN countries that have high contribution to the total production of tea of the world are Vietnam and Indonesia. In 2013, Vietnam was ranked fifth as the largest producing countries in the world with 6.80% of the total volume of world tea exports. Indonesian tea export volume has a lower value of Vietnam which is 3.41% and was ranked seventh in the world. Hicks (2009) stated that tea is considered as having a share of the global beverage market, a highly competitive field. A wide range of tea products continue to be developed, through product and process development for added-value, as market shares become more sophisticated and competitive. The tea industry must rise to these challenges, facing the future with confidence. Competition and customer orientation have increased and agribusinesses have an obligation to engage in such environment. New challenges to agribusiness firms around the word have been presented by globalization of economies. Agribusinesses not only have to compete on domestic markets, but also on global markets (Esterhuizen cit. Dlamini et al., 2014). For the firms to survive in the uneven economic environment, it is fundamental that they are competitive. Therefore, identifying the factors that influence competitiveness becomes imperative in order, to appreciate the position the firm is in, in relation to the factors identified and also propose appropriate measures and strategies for increasing competitiveness of the agribusiness firms (Dlamini et al., 2014).
Free trade agreement, followed by ASEAN, can indirectly affect international trade activities of tea in ASEAN. ASEAN market has a lure for many other countries to conduct trade cooperation. Starting in 2010, ASEAN began to implement free trade with tea exporting countries that have a high value in the world, which are India (ASEAN-India Free Trade Agreement) and China (ASEAN-China Free Trade Agreement). Cooperation among ASEAN and its partner countries will also continue with cooperation among ASEAN trading partners. Such cooperation is RCEP (Regional Comprehensive Economic Partnership), which initiated in 2011 and attended by 10 countries in ASEAN, China, Japan, Korea,
India, Australia, and New Zealand. The objective of this study is to find out the competitiveness of tea exports in ASEAN.
MATERIALS AND METHODS
Methodology
Data that was used in this study is pooled from UNCOMTRADE (http: //comtrade.un .org /data/.) during 2011 to 2014. ASEAN countries that were selected as object of this study are Indonesia, Malaysia, Thailand, Singapore, and Vietnam.
This study uses the CMS by Leamer and Stern (1970) to examine the export growth and competitiveness of tea in ASEAN, attributable to: (a) world trade, (b) commodity composition, (c) market distribution, and (d) competitiveness effects. As this CMS version is quite commonly used by researchers, comparison with the results of other studies is optimized (Siswadi et al., 2015).
The CMS is formulated as follows:
...(1) Where:
Note that i = World exports growth effect, ii = Commodity composition effect, iii = Market distribution effect, iv = Competitiveness effect, r = Standard Growth (all commodity), ri= Standard Growth (tea commodity), rij= Standard Growth of export tea to export destinations, Viwo= Value of exports tea in the
world in 2011 (US$), Viwt= Value of exports tea in
the world in 2014 (US$), Vjwo= Value of exports
from the world to export destinations in 2011 (US$), Vjwt= Value of exports from the world to export
destinations in 2014 (US$),Vijwo= Value of exports
of tea from the world to export destinations in 2011 (US$),Vijwt= Value of exports of tea from the world
to export destinations in 2014 (US$), Vwo= Value of
world exports in 2011 (US$), Vwt= Value of world
exports in 2014 (US$), ViAo= Value of exports tea in
country A in 2011 (US $), ViAt= Value of exports tea
in country A in 2014 (US $), VjAo= Value of exports
in the country A to export destinations in 2011 (US$), VjAt= Value of exports in the country A to
export destinations in 2014 (US$), VijAo= Value of
tea exports from country A to export destination in 2011(US$), VijAt= Value of tea exports from country
According to Ichihasi and Rudi (2012), there are four expressions of identity decompose the actual change in a country’s exports into four following effects: 1. World exports growth effect, which relates any change in country A’s actual exports to general rise is the world exports. Positive sign of this effect implies that A has maintained its exports share in foreign market vis-à-visthe world and vice versa. 2. Commodity composition effect, which measures the extent to which A’s export differential is due to specializing in specific commodity, where demand for exports is growing more rapidly than world average. Positive sign of this effect indicates that A‟s exports are concentrated in favorable commodities, whose demands are growing fast and vice versa. 3. Market distribution effect, which measures whether concentration on market destination of country A’s exports are growing relatively faster than world average. Positive sign of this effect indicates that A’s exports are concentrated in favorable markets, whose demands are growing fast and vice versa. 4. Competitiveness effect, an unexplained residual, reflects the difference between actual and hypothetical export increase if country A had maintained its share with regard to each commodity group.
RESULT AND DISCUSSION
Decomposition of Tea Export Growth in ASEAN
The ASEAN region is an important contributor to global tea production and trade, with its warm climate, arable conditions, and growing consumer base. Leclaire (2015) mentioned that, in recent years, development of the middle class and transition to an industrial based economy have both reshaped and revamped several ASEAN nations’ tea sectors, most notably in Thailand, Vietnam, Singapore, Indonesia, and Malaysia. Despite their geographical closeness,
the economic climates of these five tea industries face entirely different circumstances, and foreign investors hoping to enter the ASEAN tea industry should be cautious to recognize the advantages and obstacles of each region.
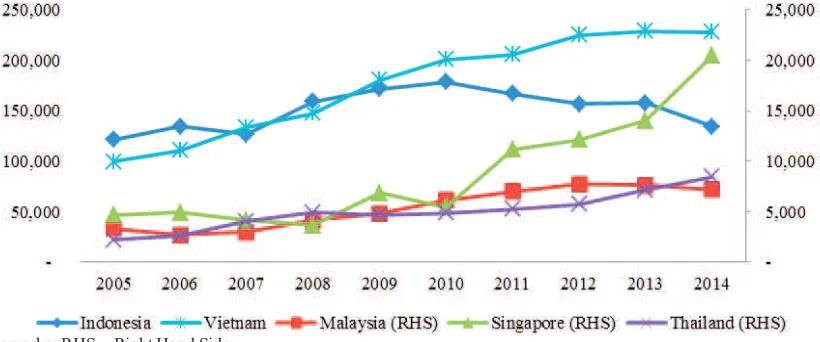
Vietnam is a country that has highest export value in ASEAN. Based on Figure 1, it can be seen that export value in Vietnam is increasing during the last 10 years. The second country to have a high export value in ASEAN is Indonesia. Indonesia has fluctuating export value each year but is still ranked second largest in ASEAN and in the top 10 countries in the world's largest tea exporter. While Malaysia, Singapore, and Thailand have exports value much lower from Indonesia and Vietnam but they have relatively positive growth.
The Strengths, Weaknesses and Competitiveness of Tea Export in ASEAN
Tea exports in ASEAN can maintain or increase its competitiveness by recognizing the strengths and weaknesses of each country. Table 1 showed the results of CMS analysis for ASEAN tea export in 2011-2014. The main weakness affecting fluctuations in the export of five countries exporting tea in ASEAN is due to market distribution effects. The negative value of the market distribution effect reflects the fact that the five countries exported to regional markets have lower growth rates than the other countries in the world.
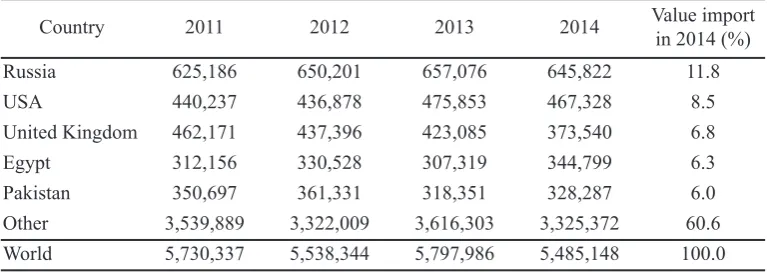
In 2014, Russia, USA, United Kingdom, Egypt, and Pakistan are the five largest export destination in the world (See Table 2). Imports amounted to 39.4% in the world market is dominated by the five countries. It can be interpreted that the five countries are have high demand, as well as growth of import of tea.
In ASEAN countries, the five countries are not
Remarks: RHS = Right Hand Side
the major export destination countries. Indonesia and Vietnam are already exporting to several destinations that have a high demand for tea imports such as Russia Federation, Pakistan, and USA, but with the amount of export growth that still lower than other countries in the world. Meanwhile, in Malaysia, Singapore, and Thailand's largest tea exporting only to ASEAN. Therefore, the suggestion for those countries is enhance the promotion to countries that have high import demand and learn more about the criteria and the taste characteristic of tea products that they prefer.
The world exports growth and commodity composition effect become the strengths for tea exports in ASEAN. Increase in exports during this period was due to a rise in demand for world exports. The increase in tea exports during this period was a result of export increases in commodities with growth rates higher than the world average and increases in tea commodity to regional markets with growth rates higher than the world average.
However, this capability should be maintained or enhanced continuously. According to Hicks (2009), tea can be considered as having a share of the soft drink/beverages market, as well as having functional food potential. A wide range of tea products will continue to be developed through product and process development for added-value as the market shares become more sophisticated and competitive. The industry must rise to these challenges and face the future with confidence.
Commodity composition effect, measured the extent of export differential is due to specializing in
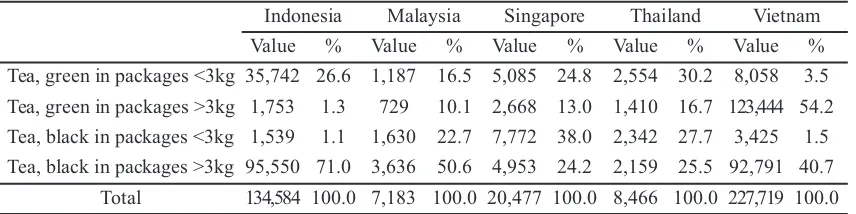
specific commodity, where demand for exports is growing more rapid than world average. Positive sign of this effect indicates that ASEAN tea exports are concentrated in favorable markets, which demands are growing fast. Black tea is a commodity that has the highest demand in the world. Based on Table 4, tea exporting countries in ASEAN are also more export black tea compared to other types so that it can be interpreted that the country has been able to follow market desire.
According to data from UNCOMTRADE (2015), black tea dominates the world tea trade, amounted approximately to 70%. The projections indicated that supply and demand of black tea would be in equilibrium in 2021 at US$ 2.75 per kg. However, if there were an overwhelming supply response to current high prices, as demonstrated in the simulations presented to The Intergovernmental Group (IGG) on Tea, then projections would be significantly different. Therefore, IGG on Tea suggested that caution needed to be exercised and greater effort needed to be directed at expanding demand, particularly in producing countries where consumption per capita was low compared to traditional import markets. The IGG on Tea encouraged diversification into other market segments and to use information on the health benefits of tea consumption more extensively in promoting consumption in both producing and importing countries (FAO, 2012).
The residual effect which affected the fluctuation of exports in ASEAN countries is the competitiveness effect. Malaysia, Singapore, Thailand, and Vietnam have the effect of positive competitiveness, which Table 1.Result of constant market share ASEAN tea export.
A result of Indonesia Malaysia Singapore Thailand Vietnam Increase of export -32,133 167 9,330 3,232 22,180 World exports growth effect 2,338 98 156 73 2,883 Commodity composition effect 9,643 406 645 303 11,888 Market distribution effect -19,114 -812 -1,278 -600 -23,565 Competitiveness effect -24,999 475 9,807 3,456 30,974
Table 2.Export destination in 2011-2014 (000 US$).
Country 2011 2012 2013 2014 Value import in 2014 (%)
means that the countries’ competitiveness in the international trade. Only Indonesia has the effect of negative competitiveness which means Indonesia has weak competitiveness in the international trade. From Figure 1, it can be seen that the value of exports in Indonesia began to decline from 2010.
Declining in Indonesian tea agroindustry is caused by the inability to cope with the problems faced, such as low productivity of crops due to the dominance of the plants that are not yet using superior seed, limited capability of technology products processing, and yet inability of farmers to follow recommended technology as recommended (Good agriculture Practice/GAP; Good Manufacture Process/GMP) as well as product quality standards as required by ISO. Efforts to increase the role of tea, either domestically or on the international market, requires to solve the problems mentioned above. In addition, no less important is providing a conducive business climate so that businesses nationwide tea (such as smallholder, country estates and private estates) may conduct technological innovation and product diversification. Thus, the national tea businesses will be able to produce tea in quantity and quality to the market needs, both domestic and international markets (Sudjarmoko, 2014).
Therefore, the important thing should be focused on is that caution for greater efforts in expanding the demand. For instance, there is scope for increasing per capita consumption in producing countries as they are low compared to traditional import markets.
The IGG on Tea has also encouraged diversification into other segments of the market, such as organic tea, and the health benefits of tea consumption should be used more extensively in promoting consumption in both producing and importing countries. However, in targeting potential growth markets, recognition and compliance of food safety and quality standards is essential. Regarding to the scientific consideration that could possibly affect tea production in the long run, while the IGG’s analysis of possible implications of climate change can only be considered initial at this stage and several follow-up studies would be essential to fully understand the likely impacts, several policy recommendations can be made. These include: the need for developing agricultural and socio-economic adaptation strategies; tea producing areas would have to be evaluated against climate projections; comparative studies of agro-climatic conditions, tea crop varieties and their requirements must be carried out; breeding of tea hybrids that cope better with climate change should be considered; and that the focus on tea production be in marine climate zones.
Finally, major shifts in demand have occurred in recent years, as some tea blending and packaging activities were moved to producing countries in a strategic shift by several large packers in consuming countries. For the higher cost producers the cost/price squeeze has had a negative impact on production. Supply chain costs have also increased with the rise in processing and distribution costs, mainly due to Remarks: A : Pakistan, US : USA, GE : Germany, SG : Singapore, TH : Thailand, BR : Brunei Darussalam, ID : Indonesia,
CH : China, UA : UAE, VN : Vietnam, CA : Cambodia, LA : Lao PDR, W : World Table 3.Top 5 export destinations at ASEAN in 2014 (000 US $).$).
Indonesia Malaysia Singapore Thailand Vietnam
ED VE % ED VE % ED VE % ED VE % ED VE %
MY 18,600 13.8 SG 2,205 32.2 TH 3,362 16.4 VN 2,255 26.6 PA 81,229 35.7 RU 16,952 12.6 TH 1,639 23.9 MY 3,124 15.3 US 1,331 15.7 RU 18,726 8.2
PA 15,251 11.3 BR 863 12.6 UA 1,462 7.1 CA 746 8.8 CH 17,169 7.5 US 7,815 5.8 ID 221 3.2 ID 845 4.1 CH 401 4.7 US 11,499 5.0 GE 6,721 5.0 CH 102 1.5 BR 574 2.8 LA 302 3.6 ID 5,906 2.6 W 134,584 100.0 W 6,858 100.0 W 20,477 100.0 W 8,466 100.0 W 227,719 100.0
Table 4.Variety of tea exports in ASEAN 2014 (000 US$).
Indonesia Malaysia Singapore Thailand Vietnam Value % Value % Value % Value % Value % Tea, green in packages <3kg 35,742 26.6 1,187 16.5 5,085 24.8 2,554 30.2 8,058 3.5 Tea, green in packages >3kg 1,753 1.3 729 10.1 2,668 13.0 1,410 16.7 123,444 54.2 Tea, black in packages <3kg 1,539 1.1 1,630 22.7 7,772 38.0 2,342 27.7 3,425 1.5 Tea, black in packages >3kg 95,550 71.0 3,636 50.6 4,953 24.2 2,159 25.5 92,791 40.7
rising fuel costs. In its efforts to improve longer-term structural conditions in the world tea market, the FAO IGG on Tea has been instrumental in the development of action-orientation programs. In determining the persistent problems of oversupply in the world tea market and the consequent downward pressure on world prices, the Group agreed that the response must involve an expansion in demand and a reduction in supply to achieve market balance. Given the already high consumption levels in traditional tea markets, demand for tea in producing countries should be looked at more closely. In particular, in producing countries with relatively low per capita tea consumption and relatively strong economic growth. This initiative will be supported by internationally co-ordinated actions aimed at promoting and expanding the demand for tea (Chang, 2015).
CONCLUSION
CMS showed the different results for both of the weakness and strength of the factor that affected the fluctuations of value export of tea in ASEAN. The major weaknesses of tea exports in Malaysia, Singapore, Thailand, and Vietnam were the effect of market distribution and the strengths of tea exports are the effect of world exports growth, commodity composition effect, and the competitiveness effect. Conversely, the major weakness of tea exports in Indonesia was the competitiveness effect and the strengths of tea export are the effect of world exports growth, commodity composition effect, and the effect of market distribution.
REFERENCES
Basu, M. A., B. Bera and A. Rajan. 2010. Tea Sta-tistics: Global Scenario. Journal of Tea Sci-ence Research. 8(1): 121-124.
Chang, K. 2015. World Tea Production and Trade Current and Future Development. Rome: Food and Agriculture Organization Of The United Nations.
Dlamini, B. P., F. Johann, Kirsten and B.M. Micah.
2014. Factors Affecting the Competitiveness of the Agribusiness Sector in Swaziland. Jour-nal of Agricultural Studies, 2(1): 61-72 Food Agriculture Organization. 2012.Rome: Report
of The Twentieth Session of The Intergovern-mental Group On Tea (Colombo, Sri Lanka, 30 January - 1 February 2012).
Hicks, 2009.Current Status and Future Development of Global Tea Production and Tea Products. Thailand: Assumption University Journal of Technology. 12(4): 251-264.
Ichihashi, M.and R. Rahmaddi. 2012. How do Ex-port Structure and Competitiveness Evolve Since Trade Liberalization? An Overview and Assessment of Indonesian Manufacturing Ex-port Performance.International Journal of Trade, Economics and Finance. 3(4):272-280. Leamer, E.E. and R.M. Stern. 1970. Quantitative In-ternational Economics. Chicago: Aldine
Pub-lishing Co. Retrieved from:
h t t p : / / w w w . a n d e r s o n . u c l a . e d u / faculty_pages/edward.leamer/books/QIE/08 %20–%20Chapter%207.pdf.[Accessed 12 January 2016].
Leclaire, E. 2015.Investments in ASEAN’s Tea
In-dustry – Cup Half Full.ASEAN
Briefing.http://www.aseanbriefing.com/news/ 2015/12/22/ investmentsaseansteaindus-trycuphalffull.html.[Accessed 20 December 2015].
Siswadi., J. O.and K. Jihee. 2015. The Competitive-ness of Indonesian Wood-Based Products. Re-view of Urban and Regional Development Studies. 27(1): 40-67.
Sudjarmoko, Bedy. 2014. Perkembangan Pasar Teh Indonesia Di Pasar Domestik Dan Pasar Inter-nasional.http://balittri.litbang.pertanian.go.id/i ndex.php/berita/info-teknologi/207-perkem- bangan-pasar-teh-indonesia-di-pasar-do-mestik-dan-pasar-internasional. Accessed 20 March 2016