Estimation of Congestion Cost of Private Passenger Car Users in
Malioboro, Yogyakarta
Sugiyanto, G.1), Malkhamah, S.2), Munawar, A.2), Sutomo, H.3)
Abstract: Congestion is the condition when the hourly traffic demand exceeds the maximum sustainable hourly throughout of the link. The aim of this research is to estimate the congestion cost of private passenger car users in central business district along the corridor of Malioboro, Yogyakarta, Indonesia. The amount of the congestion cost is the difference between perceived and actual generalized cost in traffic jam condition. In this paper, only the congestion costs of private passenger car users are estimated, as they are expected to shift to buses. The generalized costs from origin zone i to destination zone j consist of vehicle operating cost, travel time cost, and pollution cost. This study shows that while the perceived generalized cost for private cars at Central Business District (CBD) Malioboro is IDR 3101.00 per trip, the actual generalized cost in traffic jam condition is IDR 5802.00 per trip, giving the estimation of congestion cost in CBD Malioboro for private passenger car users as IDR 2701.00 per trip.
Keywords: CBD Malioboro, congestion cost, generalized cost, vehicle operating cost.
Introduction
The costs incurred by the society as the result and effect of transportation includes congestion cost, pollution cost, traffic accident cost, and fuel and energy wasted. The increase of total vehicle operating in the roads increases the cost that must be borne by the society and country. The depletion of oil reserves and the soaring price of fuel, increase transportation cost. Such costs, especially for passengers, can be reduced by using public transportation, but, in contrast, in Indonesia the use of public transport decreases and the use of private cars are quickly growing. This condition causes the cost that must be borne by passengers even greater, especially at urban areas. Transportation Demand Management (TDM), application of pricing policy in charging zone, road pricing, and traffic restraint are the alternatives to reduce transportation cost. One of the methods of TDM is Advanced Traffic Control Systems (ATCS). ATCS has been recognized as one of the most direct methods for relieving urban traffic congestion.
1 Civil Engineering Department, Jenderal Soedirman University,
Purwokerto, Central Java Email: gito_98@yahoo.com
2 Civil Engineering Department, Gadjah Mada University,
Yogyakarta, Indonesia
3 Civil Engineering Department, Researcher and Director of Center
for Transportation and Logistics Gadjah Mada University, Yogyakarta, Indonesia
Note: Discussion is expected before November, 1st 2010, and will be
published in the “Civil Engineering Dimension” volume 13, number 1, March 2011.
Received 29 October 2009; revised 9 Maret 2010; accepted 4 April 2010.
However, the applications of the systems in large cities in developing countries are unique because road networks in these cities face more severe transportations problems than those in developed countries [1].
Congestion is one of the significant transportation problems in urban area, especially in Central Business District (CBD) during peak hour. This situation happens because of the imbalance between the number of vehicles and the capacity of the road. The congestion becomes worse with the increasing activities in the roadside and bad behavior in driving. Congestions will generate many problems due to inefficiency. With congested roads, vehicle speed will be simultaneously up and down, and the average speed will be lower and hence the cost will increase. Therefore, road users will suffer from increasing vehicle operating cost and loosing more time. In other words, transportation costs will increase due to congestions.
Yogyakarta is one of the transportation development regions in Indonesia with specific characteristic. The transportation characteristic in Yogyakarta is mixed traffic and overloaded on some road links. In CBD Malioboro, 82.15% of the total traffic volume consist of motorcycle [2,3].
m
ij m
ij m ij m ij
m ij
m ij m
ij
27.22% in the year 2003 and 2004 respectively [5]. This fact reflected that the service quality was still low. The lack of accessibility for public transport from origin zone to destination zone caused the attractiveness of public transport decreased.
Santos [6] quoted The European Commission report that the congestion costs in Western industrialized countries are two percent of the Gross Domestic Product (GDP). Quinet [7] cites some numbers reported by Bouladon [8] that the congestion costs in France, United Kingdom, United States, and Japan are respectively 2.1%, 3.2%, 1.3% and 2.0% of the respective Gross National Product (GNP) of the countries.
Santos [6] quoted Traffic Master which calculates the congestion costs in England for three months in 1996 as £ 2.1 billion, including wasted time, extra fuel, missed deliveries and higher maintenance costs. While Dodgson and Lane, in [6], estimated congestion costs for England as £ 6.9 billion for 1996. They defined congestion costs as the difference between the level of costs in actual speeds and the level of costs in free flow speeds.
Newbery [9] used a different approach to estimate congestion cost. He gave estimates of marginal congestion costs for different types of roads in England, the last update being around 45 pence per passenger car unit (pcu)-km for urban roads at peak time. Harford [10] showed that the congestion cost for 85 cities in the United States of America was US$ 63.3 billion in 2002, for value of time US$ 13.45/hour.
This paper aims to evaluate the generalized cost in perceived cost condition and the generalized cost in actual cost condition and to estimate the amount of congestion cost for private passenger car users in CBD Malioboro, Yogyakarta.
Methodology
Analysis Approach
Ortuzar and Willumsen [11] have shown that generalized cost of travel is obtained by combining all main attributes related to the disutility of a journey. Generalized cost is typically a linear function of the attributes of the journey weighted by coefficients to represent their relative importance as perceived by the traveler. Hence, generalized cost can be calculated based on combination of cost paid by user, travel time cost, vehicle operating cost, and environmental cost. Equation 1 shows the generalized cost by mode m from i to j.
Cmij= VOT (TTmij) + TCmij+ CPmij (1)
In which C is the total travel cost, and VOT the value of time for the total travel time, TT . TC the total vehicle operating cost and CP the total environmental cost, while i is origin zone and j destination zone.
Congestion cost emerges from the speed-flow relationships for a link and the interactions between speed and travel cost. If the existing limit of traffic flow is overloaded, the average travel speed will descend, whereas the vehicle operating costs and the travel time will increase (Everall, 1968 in [12]).
The amount of the congestion cost represents the difference of marginal social cost (MSC) to marginal private cost (MPC) (Figure 1). Congestion cost is caused by vehicle addition in the same road while the equilibrium is reached at points F with the traffic flow as much as Q2 and cost is P2. The vehicle
addition after the optimal traffic flow Q2 must take
travel cost as much as Q2Q1HF but only enjoy the
benefit Q2Q1EF. There is welfare gain as much as
FEH. Therefore, the congestion cost is counted based on the difference between marginal social cost and marginal private cost.
The amount of congestion cost estimation of mode m from zone i to zone j can be formulated:
CCmij = CijmMSC - Cmij MPC (1)
in which CC is the congestion cost, C MSC the marginal social cost, and C MPC the marginal private cost.
Marginal Private Cost
P3
P0
Cost
P1
P2
P4
Q2 Flow
Demand
Marginal Social Cost
0 Q0 Q1
E H
F
G I D
Figure 1. Congestion Cost Estimation [12]
be realized if congestion pricing as much as F-G or P2-P3 was applied.
Pricing is a method of resources allocation. There is no right price, but rather an optimal price strategy that permits specific goals to be obtained. Major problem in pricing policies in practice, is to decide what the objective is. In general, the specific goal is to set the efficient price. Profit maximization is the traditional motivation of the private enterprise undertakings. The actual price level depends upon the degree of competition in the market. Competition is considerable when no single supplier has any control over price, with limited intervention by the government as regulator.
Data Collection
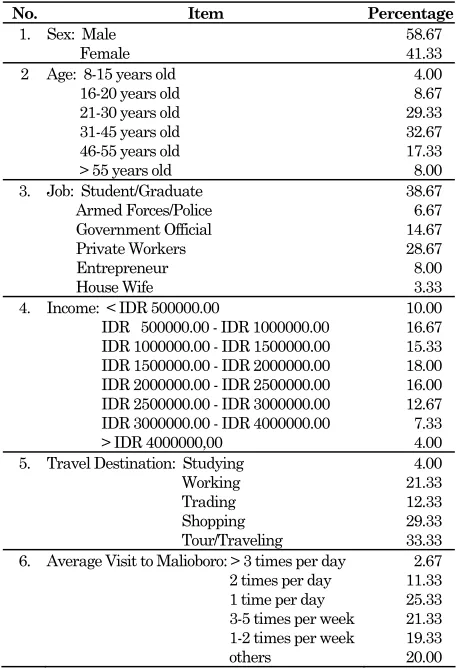
The travel time in perceived cost condition of private passenger cars is obtained from questionnaires distributed to respondents that pass through in CBD Malioboro, Yogyakarta. The characteristics of respondents include: sex, age, job, income, travel destination, the average visit to Malioboro, and estimation of travel speed in traffic jam condition. The characteristics of respondents can be seen in Table 1.
Table 1. Characteristics of Respondent
No. Item Percentage
1. Sex: Male Female
58.67 41.33 2 Age: 8-15 years old
16-20 years old 21-30 years old 31-45 years old 46-55 years old > 55 years old
4.00 8.67 29.33 32.67 17.33 8.00 3. Job: Student/Graduate
Armed Forces/Police Government Official Private Workers Entrepreneur House Wife
38.67 6.67 14.67 28.67 8.00 3.33 4. Income: < IDR 500000.00
IDR 500000.00 - IDR 1000000.00 IDR 1000000.00 - IDR 1500000.00 IDR 1500000.00 - IDR 2000000.00 IDR 2000000.00 - IDR 2500000.00 IDR 2500000.00 - IDR 3000000.00 IDR 3000000.00 - IDR 4000000.00 > IDR 4000000,00
10.00 16.67 15.33 18.00 16.00 12.67 7.33 4.00 5. Travel Destination: Studying
Working Trading Shopping Tour/Traveling
4.00 21.33 12.33 29.33 33.33 6. Average Visit to Malioboro: > 3 times per day
2 times per day 1 time per day 3-5 times per week 1-2 times per week others
2.67 11.33 25.33 21.33 19.33 20.00
The travel time in actual cost condition is obtained from Moving Car Observer (MCO) survey in CBD Malioboro, Yogyakarta. CBD Malioboro consist of two lane one-way direction undivided road (2/1 UD) 1.4 kilometers long from Malioboro Street to Ahmad Yani Street (Figure 2). The type of private passenger car used in this study to calculate the vehicle operating cost and the consumption of fuel is private car group I as defined in Reference [13]. The collection of data in the study area CBD Malioboro, Yogyakarta, as can be seen in Figure 2.
CBD Malioboro
Figure 2. Study area in CBD Malioboro, Yogyakarta
Result and Discussion
The generalized cost consists of three components of cost: (a) vehicle operating cost, (b) cost of pollution in each vehicle, (c) travel time cost.
Vehicle Operating Cost (VOC)
In this paper, vehicle operating cost (VOC) of private passenger car is counted in two conditions, based on travel cost in perceived condition and travel cost in actual condition which potentially cause traffic jam by using method given in Reference [13]. There are seven components of vehicle operating costs: (a) consumption of fuel, (b) lubricating oil consumption, (c) tire consumption, (d) maintenance cost (spare part and repair), (e) the cost of depreciation, (f) capital interest, and (g) the cost of insurance. The basic consumption of fuel based on LAPI ITB method [13] is formulated as:
y =0.0284V2-3.0644V+141.68 (2)
in which V is speed of vehicle (km per hour) and y is basic consumption of fuel (litre per 1000 kilometer).
Vehicle Operating Cost and Speed Relationship
vehicle operating cost, showing the relationship between vehicle operating cost and speed for CBD Malioboro, Yogyakarta using LAPI ITB method as presented in Reference [14].
y = 0,4226x2 - 55,077x + 2904
Figure 3. Relationship between Speed and Vehicle Operating Cost [14]
From Figure 3, it can be seen that there is an optimum speed with the minimum vehicle operating cost. The optimum speed for private passenger cars in CBD Malioboro, Yogyakarta along the 1.4 km is 65km/hour with operating cost of IDR 1109.48 per kilometer. The vehicle operating cost model for private passenger cars as presented in Reference [14] is formulated as:
y =0.4226V2-55.077V + 2904 (4)
in which V is speed of vehicle (km per hour) and y is vehicle operating cost (IDR per kilometer).
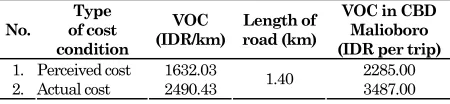
Based on the analysis of questionnaires from 150 respondents, the average speed of private passenger cars in perceived cost condition is 30.00 km/hour so the vehicle operating cost is IDR 1632.03/km (Eq. 4). Based on Moving Car Observer (MCO) survey, the speed of private passenger cars in actual cost condition which potentially cause traffic jam is 8.0 km/hour so the vehicle operating cost is IDR 2490.43/km. The vehicle operating cost of private passenger cars at CBD Malioboro based on LAPI ITB method [13] in perceived cost and actual cost condition can be seen in Table 2.
Table 2. VOC in Actual Cost and Perceived Cost condition in CBD Malioboro, Yogyakarta
No.
The cost of pollution was calculated based on Marginal Health Cost (MHC),reported by the World
Bank (1993) in Indonesia available in Reference [15] in USD cent per liter. This cost is converted to IDR using the rate of exchange on 21st October 2009
which is IDR 9975.00 per one USD. The fuel consumption of private passenger cars were counted based on fuel consumption model of LAPI ITB in Sugiyanto [14]. This model does not distinguish between passenger vehicles using gasoline and diesel fuel, in this paper it is assumed that the fuel consumption is equal. Gasoline and diesel prices on 21st October 2009 are IDR 4500.00 per liter. The
analysis result of MHC of private passenger car can be seen in Table 3.
Table 3. Marginal Health Cost (MHC) of Private Passenger Cars
MHC/Vehicle Fuel Consumption
(litre per km)
Assuming that 75 percent of private passenger cars in CBD Malioboro, Yogyakarta used gasoline and 25 percent diesel fuel, the marginal health cost can be calculated in actual condition as IDR 385.65 per km and perceived cost condition as IDR 244.09 per km as shown in Table 2. Multiplying with 1.4 km, the length of CBD Malioboro, the pollution cost of private passenger cars at CBD Malioboro, Yogyakarta are shown in Table 4.
Table 4. Pollution Cost of Private Passenger Cars in CBD Malioboro, Yogyakarta
No. Type of cost condition
Pollution Cost (IDR per km)
Pollution cost in CBD Malioboro (IDR per trip)
1. Perceived cost 244.09 342.00
2. Actual cost 385.65 540.00
Travel Time Cost (TTC)
Table 5. Travel Time Cost (TTC) in Actual Cost and Perceived Cost condition in CBD Malioboro, Yogyakarta
No. Type
Generalized cost consists of vehicle operating cost, travel time cost and pollution cost. The generalized cost to private cars in actual cost condition and perceived cost condition are presented in Table 6.
Table 6. Generalized Cost in Actual Cost and Perceived Cost Condition for Private Passenger Cars in CBD Malioboro, Yogyakarta
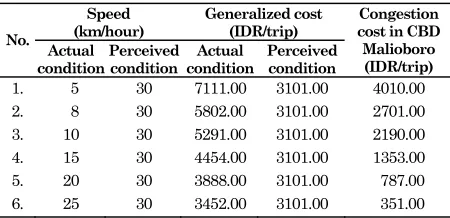
The amount of congestion cost of private passenger cars is the difference between generalized cost in actual condition (speed 8 km/hour) and perceived condition (speed 30 km/hour). It is shown in Table 6, that the generalized cost of private passenger car in actual condition is IDR 5802.00 per trip, and in perceived condition IDR 3101.00 per trip, thus the congestion cost of private passenger cars in CBD Malioboro, Yogyakarta is IDR 2701.00 per trip. The generalized cost of private passenger cars is simulated with actual condition with speed of 5, 10, 15, 20, and 25 km/hour, the congestion cost is presented in Table 7 and Figure 4.
Table 7. Relationship between Speed, Generalized Cost, and Congestion Cost of Private Passenger Cars in CBD Malioboro, Yogyakarta.
Speed (km/hour)
Generalized cost (IDR/trip)
Based on Figure 4, congestion cost model for private passenger cars is formulated as:
y =49853 X-1.4263 (5)
in which X is speed of vehicle (km/hour) and y is congestion cost (IDR per trip). The R-squared value of the model was 0.9266, indicating an excellent correlation.
y = 49853x-1,4263
R2 = 0,9266
Figure 4. Relationship between Speed and Congestion Cost.
Sugiyanto, et al [17] have shown that 24% of respondent who used the private passenger car in CBD Malioboro, Yogyakarta choose the limit of congestion cost as IDR 5000,00 per trip.
If congestion cost is to be applied in CBD Malioboro, Yogyakarta, every private passenger cars that pass through CBD Malioboro, Yogyakarta have to pay the congestion cost as IDR 5000.00 per trip. So they are expected to shift to buses and the traffic jam in peak hour time will be decreased.
Blythe [18] and TfL [19] explained the boundary of charging zone marked by toll gate that separates with the other road networks. Implementation of congestion costs in Malioboro needs two toll gates which could be placed on the left and right side of the entrance of CBD Malioboro, at the intersection of Malioboro street with Pasar Kembang street.
Traffic congestion is a problem common to virtually all urban areas in developing countries with car as a widespread mode of transport. Congestion is not a uniform phenomenon and therefore, any policy, e.g. road pricing, congestion cost, should ideally take into account the area and time in question. Introducing a charge nation-wide would not make sense, but introducing charge in central areas like CBD of towns during peaks hours seems not only sensible but also almost mandatory if gains in efficiency are to be made.
Although it might be difficult to implement very precise charge for each area at each time, this paper shows that computing external cost like congestion cost, pollution cost to guide the levels of charges is relatively simple. It is clear that such charges should only be applied in the most congested area, rather than in the whole town.
Conclusions
and the amount of congestion cost in variation of speed. From the analysis and results, it can be concluded as follows:
1. The generalized cost at CBD Malioboro for private cars in perceived cost condition IDR 3101.00 per trip and in actual cost condition is IDR 5802.00 per trip.
2. Congestion cost in CBD Malioboro for private cars is IDR 2701.00 per trip.
3. Congestion cost of private passenger cars increases with decreasing of vehicle speed in actual condition.
References
1. Sutandi, C.A., Performance Evaluation of Advanced Traffic Control Systems at Signalised Intersections far from Adjacent Intersections,
Civil Engineering Dimension, Vol. 9 No. 2,
September 2007, pp. 77-84.
2. Sugiyanto, G., Study on Application of Congestion Charging to Increase The Use of Public Transportation (Case Study in The Malioboro
Corridor, Yogyakarta City), Thesis, Master
Program Civil Engineering, Bandung Institute of Technology, Bandung, 2007. (unpublished).
3. Sugiyanto, G., Sjafruddin, A., and Siswosoebrotho, B.I., Mode Choice Model between Private Cars and City Bus as a Result of Congestion Charging Scheme (Case Study in Malioboro, Yogyakarta City), Proceeding Civil Engineering 2007, Maranatha Christian University, Bandung, 2007, pp. 266-279.
4. Center for Transportation and Logistics Studies of Gadjah Mada University, Final Report, Studi Pola Jaringan Transportasi Jalan Kota
Yogyakarta, Yogyakarta, 2003.
5. Communication Affairs, Data Armada Angkutan Umum Provinsi Daerah Istimewa Yogyakarta
Tahun 2006, Bidang Angkutan Dinas
Perhubungan Provinsi Daerah Istimewa
Yogyakarta, Yogyakarta, 2006.
6. Santos, G., Road Pricing on The Basis of Congestion Costs: Consistent Results from Two
Historic UK Towns, Department of Applied
Economics, Cambridge, Inggris, 1999, pp.1-16.
7. Quinet, E., The Social Costs of Transport: Evaluation and Links with Internalisation Policies, In Internalising the Social Costs of Transport, OECD-European Conference of
Ministers of Transport (ECMT), Paris, 1994, pp.
31-75.
8. Bouladon, G., La Mobilite en Zone Urbaine: Apprendre I’Economie de Transport, Document Diffusion Restreinte, Direction de I’Environnement, OECD-European Conference
of Ministers of Transport (ECMT), Paris, 1991,
cited in (7).
9. Newbery, D. M., Fair Payment from Road-Users: A Review of the Evidence on Social and
Environment Costs, Report published by the
Automobile Association, Basingstoke, 1998.
10. Harford, J.D., Congestion, Pollution and Benefit to Cost Ratios of US Public Transit System,
Transportation Research, Part D: Environment,
11 (1), 2006, pp. 45-58.
11. Ortuzar, J.D. and Willumsen, L.G., Modelling
Transport, John Wiley and Sons Ltd., England,
2001.
12. Stubs, P.C., Tyson W.J., and Dalvi, M.Q.,
Transport Economics, George Allen and Unwin
(Publisher) Ltd., London, 1980.
13. Lembaga Afiliasi Penelitian dan Industri (LAPI) ITB, Laporan Akhir Studi Perhitungan Biaya
Operasi Kendaraan PT. Jasa Marga, Bandung
Institute of Technology, Bandung, 1996.
14. Sugiyanto, G., Study on Congestion Pricing for Private Cars in Central Business District (CBD)
Case Study in Malioboro, Yogyakarta, Laporan
Akhir Hibah Publikasi Internasional Batch-1, Universitas Jenderal Soedirman, Purwokerto, 2009.
15. La One, Perhitungan Pajak Kendaraan Bermotor Berdasarkan Biaya Penyelenggaraan
Transportasi (Studi Kasus di Kota Yogyakarta),
Thesis, Master Program in Transport and Engineering, Gadjah Mada University, Yogyakarta, 2002. (unpublished).
16. Malkhamah, S., Munawar, A., Sutomo, H., Sugiyanto, G., Pengembangan Model Biaya Kemacetan dan Biaya Kecelakaan untuk Meningkatkan Efisiensi Transportasi di Daerah
Perkotaan, Laporan Akhir Penelitian Hibah
Guru Besar (HGB) Fakultas Teknik, Universitas Gadjah Mada, Yogyakarta, 2008. (unpublished).
17. Sugiyanto, G., Mulyono, B., and Santi, M.Y., Kajian Pemodelan Biaya Transportasi, Biaya Kemacetan (Congestion Pricing) dan Biaya Polusi untuk Mengurangi Kemacetan Lalu Lintas dan Pencemaran Udara di Daerah Pusat
Kegiatan (Central Business District), Laporan
Akhir Penelitian Program Insentif Riset Dasar Kementerian Negara Riset dan Teknologi (KNRT), Lembaga Penelitian, Universitas Jenderal Soedirman, Purwokerto, 2009. (unpublished).
18. Blythe, T., Congestion Charging: Challenges to Meet the UK Policy Objectives”, Review of
Network Economics, 3 (4), 2004, pp. 356-370.
![Figure 1. Congestion Cost Estimation [12]](https://thumb-ap.123doks.com/thumbv2/123dok/3672712.1469771/2.595.315.536.515.680/figure-congestion-cost-estimation.webp)