Co-registration of Multi-temporal DEM Based on SIFT Algorithm for
Change Detection of
Glaciers
Huang Yuezhi, Hu Qingwu
School of Remote Sensing and Information Engineering, Wuhan University, Wuhan 430079, China- [email protected], [email protected]
Commission III, WG III/6
ABSTRACT:
To detect the change of geographic objects by using multi-temporal DEM, the data must be co-registered firstly. In this paper, the Scale-Invariant Feature Transform (SIFT) algorithm is used to co-register multi-temporal DEM data and glacier change detection. Firstly, the DEM is converted into image space and extracts feature information, calculate multiple sets of match point coordinates, and achieve swift and accurate DEM data co-registration using SIFT algorithm. Secondly, the difference between co-registered DEM datasets are analysed. Total area change and average rate of change are calculated. Finally, the change of multi-temporal DEM data of glaciers in Langkazi County, Tibet from 2004 to 2014 is detected using the method proposed in this paper. The results indicate that the proposed method is able to detect change of the glaciers and the overall accuracy is higher than 85%.
KEY WORDS:
DEM; SIFT; image co-registration; change detection1. INTRODUCTION
A digital elevation model (DEM) is a digital model or 3D representation of a terrain's surface created from terrain elevation data [1]. Since the DEM change detection and analysis can provide data support in surface monitoring, disaster analysis, climate analysis, etc., many scholars at home and abroad have studied and discussed this issue. New aerial images and old DEM data can provide data for an automated terrain change detection and data update algorithm [2] (Li Deren, 2006). A technical framework of 3D change detection based on existing DEM, Digital Ortho image (DOM), Digital Line Graph (DLG) and new stereo imagery is presented by Xia Song in 2007[3]. A cluster analysis approach based on the density is used to analyse the candidate change points and detect DEM change [4] (Feng Tiantian, 2008). An object-oriented change detection method is used to detect DEM change in the debris flow area in Zhouqu [5] (Cao Jianjun, 2011). A method to combine multi-source DEM data and multi temporal remote sensing data to estimate glacier volume change is proposed by Wang Yiting in 2012[6]. A methodology for glacier elevation reconstruction from Digital Elevation Model (DEM) time series (tDEM) is described for modeling the evolution of glacier elevation and estimating related volume change[7] (Di Wang,Andreas Kääb, 2015 ).
To ensure accuracy of the DEM change detection, data from different time and sensors should be co-registered into the same
coordinate system. Since DEM data co-registration method should be swift and accurate, Scale-invariant Feature Transform (SIFT) matching algorithm is used in this paper. SIFT is an algorithm in computer vision to detect and describe local features in images. The algorithm was published in 1999[8] and improved in 2004[9] by David Lowe. The algorithm transforms an image into a large collection of feature vectors, each of which is invariant to image translation, scaling, and rotation, partially invariant to illumination changes and robust to local geometric distortion. The evaluations carried out suggests strongly that SIFT-based descriptors, which are region-based, are the most robust and distinctive, and are therefore best suited for feature matching[10](Mikolajczyk, 2005).
2. RESEARCH AREA AND DATA
2.1 Research area
The research area is located in 28.5°~29.2°N, 90.0°~90.7°E, near Langkazi County, Tibet, China. The area is about 3600 km². The main mountains in this area are Mount Ningjingangsang and Mount Kaluxiong with a great number of glaciers. Since the glaciers in this area have typical characteristic of middle and low latitude mountainous glacier, the change detection is meaningful to the research of local climate change, production and living of residents and water balance. The location of research area is shown in figure 1.
Figure 1. The location of research area
2.2 Research data
In this paper, Advanced Spaceborne Thermal Emission and Reflection Radiometer (ASTER) dataset is used as research data. Four multi-temporal ASTER datasets from the same area, which were photographed in 2004, 2007, 2011 and 2014, are chosen for research. Since the temporal distribution of the dataset is even and the change of glacier area is manifest, the ASTER dataset is able to meet the change detection demand.
3. RESEARCH METHOD
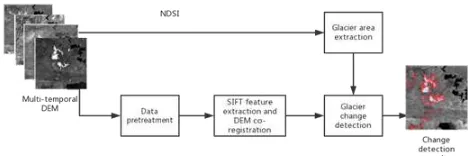
The glacier change detection research method calculates multiple sets of match point coordinates, and achieves swift and
accurate DEM data co-registration using SIFT algorithm. Then the change between multi-temporal DEM data with same coordinate system can be detected and analyse. The overall process of research method is shown in Figure 2.
Figure 2. The process of research method
3.1 Data pre-treatment
Firstly, a mapping relation between DEM data and grey scale should be established in order to get images available for SIFT algorithm. The DEM data containing elevation information should be rendered into a grey scale image.
3.2 DEM co-registration using SIFT algorithm
Firstly, SIFT algorithm performs feature detection in scale space and calculate the place and scale of extrema. Then stable key points are selected, and local image features which are irrelevant to scale and directions are applied to point match calculation [11].
In this paper, we use SIFT key points detecting and matching functions from Open Source Computer Vision (OpenCV) library of programming functions to extract and match key points from DEM images. By performing match calculation three times between four DEM datasets, three groups of matching point coordinate values are generated. After operating geographic co-registration three times, four DEM datasets can be unified to the same coordinate system.
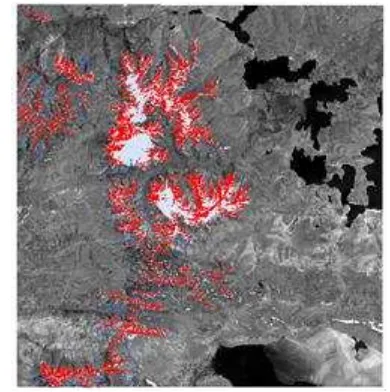
3.3 Glacier boundary extraction
The DEM data photographed earliest (in the year 2004) is used as the benchmark of glacier change detection to extract glacier boundary. The normalized difference snow index (NDSI) of the ASTER images is calculated to improve the extraction algorithm efficiency. By setting rational threshold of NDSI, glacier boundary data can be obtained.
The calculation of NDSI is shown in equation 1:
After obtaining glacier boundary polygon data, a buffer area with a distance of 1500m can be created. The surface elevation change within the buffer area can be classified as glacier change. The glacier change detection is performed inside the buffer area.
3.4 Glacier change detection
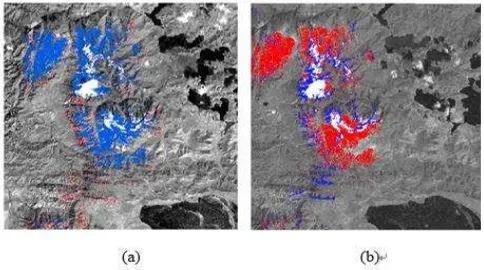
Three differential images are obtained from four DEM datasetschronologically, which are shown in figure 3.
Figure 3. The differential image series
Figure (a) is the differential image between DEM data from 2004 and 2007. Figure (b) is the differential image between DEM data from 2007 and 2011. Figure (c) is the differential image between DEM data from 2011 and 2014.
In order to eliminate systemic error caused by intensity of illumination, performance of sensors or climate conditions, mathematic relation between average and standard deviation of
differential images’ grey value should be established to calculate threshold [12]. The calculating method of threshold is shown in equation (2).
(2) In equation (2),
stands for the average grey value of differential images, and stands for the standard deviation of grey value. N stands for an index which can be adjusted according to the distribution of grey scale histogram of images. T1 and T2 stands for the threshold.The differential images can be classified after the threshold is calculated. The classification method is shown in equation (3).
2
For instance, the histogram of the first set differential image is generated firstly (Figure 4.). The grey scale average of this image is 34, and the standard deviation is 86.
Figure 4. The histogram of difference image In order to enhance the sensitivity of change detection, the
value of index N is set to 0.9, and therefore the threshold T1
=121, T2=-33. The differential image is classified according to
the threshold and the glacier change detection result image is obtained (Figure 5). The red area in this image is glacier decreased area, while the blue area is glacier increased area.
Figure 5. The glacier change detection result from 2004-2007
The change detection result shows that glacier decreased area within the research area is 215.83km² from 2004 to 2007, while glacier increased area is 28.04 km². The total glacier change area is 187.79 km², and the annual average change speed is 62.60 km²· a-1, which indicates a severe glacier decrease situation.
Figure 6. The glacier change detection result
4. RESEARCH RESULT AND ANALYSIS
4.1 Glacier area change statistics
Glacier area change statistics result is shown in Table 1.
Table 1 Glacier area change within research area from 2004-2014
It is concluded from Table 1 that glacier within research area has changed significantly from 2004 to 2014. From 2004 to 2007, the glacier area decreased by 52.23%, and the annual average change rate is 17.41%. From 2007 to 2011, the glacier area increased by 148.49%, and the annual average change rate is 37.12%. From 2007 to 2011, the glacier area decreased by 32.42%, and the annual average change rate is 10.81%.
Figure 7 is generated combining glacier area and annual average temperature from 2004 to 2014.
Figure 7. Glacier area and annual average temperature from 2004-2014
It is concluded from Figure 10 that glacier area change is closely associated with temperature change [13]. According to the line chart, the average temperature represented rising tendency from 2004 to 2007, and glacier area decreased significantly. Average temperature represented decreasing tendency from 2007 to 2011, especially in 2011, which has the lowest average temperature in the past 10 years. Therefore the glacier area in 2011 increased greatly compared with 2007. From 2011 to 2014, average temperature rose again, and the glacier area showed decreasing tendency once more.
4.2 Glacier change type statistics
There are two types of glacier change: increase and decrease. The percentage of glacier area change type from 2004-2014 is analyzed in Table 2, which can verify with data in Table 1. The main glacier area change type is decrease from 2004 to 2007 and from 2007 to 2011, while increase change type had an advantage from 2007 to 2011.
Year
2004-2007
2007-2011
2011-2014 Area changed(km²) 243.87 348.29 355.54 Decrease area(km²) 215.83 43.97 246.92 Decrease percentage 88.50% 12.82% 69.45% Increase area km² 28.04 298.92 108.62
Increase percentage 11.50% 87.18% 30.55% Table 2 Percentage of glacier area change type from 2004-2014
The total glacier change rate is 81.29km²•a-1 from 2004 to
2007, 87.07km²•a-1from 2007 to 2011, and 118.51 km²•a-1 from 2011 to 2014. The change rate increases constantly over time, which indicates that frequent occurrence of extreme climate is having a great impact on the topography in recent years [14].
4.3 Change detection accuracy
The change detection accuracy statistic is based on a sampling survey. 50 random points are generated within glacier buffer area after each change detection. The correctness of change detection is analyzed with visual interpretation method. The accuracy of change detection is shown in Table 3. The overall change detection accuracy is 85.33%.
Year Change area(km²) Area change rate
2004-2007 -187.79 -52.23%
2007-2011 254.95 148.49%
Correct
Table 3 Accuracy of change detection
5. CONCLUSIONS
The main research results of this paper included the following three aspects:
(1) A large amount of key points and match points are extracted from multi-temporal DEM datasets using SIFT algorithm. Co-registration is operated according to matching points coordinates. After performing geometric transformation and grey scale resampling, the DEM datasets can be unified to the same coordinate system. (2) Glacier change detection area is extracted by calculating
NDSI of benchmark DEM dataset and creating a buffer area. Difference between DEM datasets is calculated and several groups of differential images are produced. By establishing mathematic relation between average and standard deviation of differential images’ grey value, change threshold is calculated and glacier change detection result is obtained.
(3) According to glacier change detection result, different types of thematic figures and tables are generated. The causes of glacier change is analyzed combined with local climate condition. The change detection accuracy confirms that research method in this paper is able to limit change detect errors in an acceptable range.
There are still some problems to solve and improve in this paper. Since the pixel-based change detection method tends to be influenced by imaging conditions and co-registration accuracy, it is difficult to completely eliminate systematic errors. If clustering computation is applied to the DEM datasets as a pre-processing method, the change detection accuracy can be improved. The mathematical relationship between DEM data and climate data can be established if data with a higher precision is used for precise quantitative analysis.
REFERENCES
[1] Liu Jinzhong, Ma Hui. Research and Realization of DEM Arithmetic Based on Contour Line[J]. Modern Surveying and Mapping, 2004, 27(3):34-35.
[2] Li Deren, Xia Song, Jiang Wanshou. Approach for Terrain Change Detection and Updating Based on Orthoimage Matching[J]. Geography and Geo-Information Science, 2006, 22(6):9-11.
[3] Xia Song, Li Deren, Wu Zhaocong. On 3D change detection with multi- source spatial data[J]. Science of Surveying and Mapping, 2007, 32(1):49-50.
[4] Feng Tiantian, Wang Mi. Cluster Analysis Approach for DEM Change Detection Based on Aerial Images[J]. Journal of Geomatics, 2008,33(1):35-36.
[5] Cao Jianjun, Luo Ying, Li Deren, et al. Analysis on the Change Detection of DEM with Multi-source Spatial Data[J]. Mine Surveying, 2011(5):17-20.
[6] Wang Yiting, Chen Xiuwan, Bo Yanchen, et al. Monitoring Glacier Volume Change Based on Multi-Source DEM and Multi-Temporal Remote Sensing Images——— a Case
Study in the Mount Naimon’nyi Region on the Tibetan
Plateau[J]. Journal of Glaciology and Geocryology, 2010, 32(1):126-132.
[7] Di Wang, Andreas Kääb. Modeling Glacier Elevation Change from DEM Time Series [J]. Remote Sens. 2015, 7, 10117-10142.
[8] David G. Lowe. Object recognition from local scale-invariant features [J]. International Conference on Computer Vision, Corfu, Greece, 1999(9):1150-1157. [9] David G. Lowe. Distinctive Image Features from
Scale-Invariant Keypoints [J]. International Journal of Computer Vision, 2004, 60(2):91-110.
[10] K Mikolajczyk, T Tuytelaars, C Schmid, et al. A Comparison of Affine Region Detectors [J]. International Journal of Computer Vision, 2005, 65(1-2):43-72. [11] Li TieJun, Chen Zhe, Wang Renxiang. Application of Scale
Invariant Feature Transform to Image Matching[J]. Journal of Projectiles, Rockets, Missiles and Guidance, 2008, 28(2):183-185.
[12] Yang Xi, Liu Guoxiang, Qin Jun, et al. Change Detection of Urban Surface Based on Image Subtracting Operation between Multi-temporal Images[J]. Surveying and Mapping of Sichuan, 2008, 31(3):99-103.
Analysis of Tibet Karuola Glacier Change from 1972 to 2010[J]. Remote Sensing Technology and Application, 2015, 30(4):784-792.