Denissa Femi Primula, 2016
THE EFFECTIVENESS OF COLLABORATIVE STRATEGIC READING (CSR) IN IMPROVING
STUDENTS’ READING COMPREHENSION IN NARRATIVE TEXT
Universitas Pendidikan Indonesia| repository.upi.edu | perpustakaan.upi.edu
CHAPTER III
RESEARCH METHODOLOGY
This chapter provides a discussion on the methodological aspects of the
research covering statements of problems, research design, hypothesis, data
collection, procedures of study, and data analysis.
3.1 Statement of Problems
As it is stated in previous chapter, the problems to be examined in the study
are formulated as follows.
1. Is Collaborative Strategic Reading effective in improving students’ reading comprehension?
2. What are students’ perceptions toward the use of Collaborative Strategic Reading?
3.2 Research design
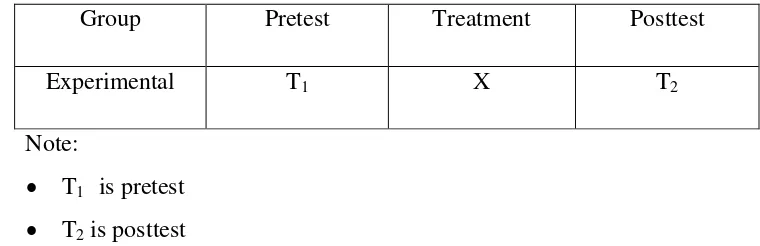
The research employed quasi-experimental with one group pretest-posttest
design. This design allows the researcher to take only one group without the
existence of control group. Moreover, this design is measured by using pretest
which is done before the treatment and posttest which is done after the treatment.
There was one class involved in this study. This group received CSR as a
treatment. The one group pretest-posttest design of the research is described in the
following table.
Table 3.1 One Group Pretest-Posttest Design
Group Pretest Treatment Posttest
Experimental T1 X T2
Note:
Denissa Femi Primula, 2016
THE EFFECTIVENESS OF COLLABORATIVE STRATEGIC READING (CSR) IN IMPROVING
STUDENTS’ READING COMPREHENSION IN NARRATIVE TEXT
Universitas Pendidikan Indonesia| repository.upi.edu | perpustakaan.upi.edu
X indicates a treatment by using Collaborative Strategic Reading (CSR)
Nunan (1992: 25) stated that in experimental study, there are two variables:
independent variable and dependent variable. Independent variable is the label that is given to the variable that the experimenter expects to influence the other. In addition, Wiersma & Jurs (2009: 34) define independent variable as the variable
that the researcher is trying to determine whether there is a cause-and-effect
relationship to the dependent variable. Dependent variable is the outcome variable
to be calculated statistically. The values of this variable in some way depend on
independent variable. In this case, the independent variable of this study was the Collaborative Strategic Reading (CSR), while the dependent variable was the
students’ score in reading comprehension.
3.3 Research Hypothesis
To provide specificity and direction, hypotheses were developed. A
hypothesis is a guess at the solution to a problem (Wiersma & Jurs, 2009: 37).
McMillan & Schumacher (1989: 349) defines hypothesis as a research prediction
that is tested. There are two types of hypothesis, namely null hypothesis and
alternative hypothesis. Null hypothesis (H0) is an error probability in terms of
sampling and measurement which state that there is no difference between the
population means of the group. The researcher employed descriptive statistic to
determine the probability that the null hypothesis is untrue. The descriptive
statistic used is one sample t-test. On the other hand, alternative hypothesis (Ha) is
a difference between experimental treatments that the researcher expects to
emerge (Borg & Gall, 1983: 89). Hence, the hypotheses of the study are as follow:
H0: There is no significant difference in mean of pretest and posttest
Ha: There is significant difference in mean of pretest and posttest
3.4Data Collection
Denissa Femi Primula, 2016
THE EFFECTIVENESS OF COLLABORATIVE STRATEGIC READING (CSR) IN IMPROVING
STUDENTS’ READING COMPREHENSION IN NARRATIVE TEXT
Universitas Pendidikan Indonesia| repository.upi.edu | perpustakaan.upi.edu
Population, according to McMillan & Schumacher (1989: 161), is the
sample consists of individuals selected from a larger group of person, while
sample is selected from the larger group to provide subject. The population
involved in this study was eighth grade students from SMPN 15 Bandung. In this
study, the sampling technique used was purposive sampling where one class was
chosen as an experimental group based on some consideration such as the students
were active in the class and they was better than the other classes. The class taken
was 8 A consist of 35 students. Two students did not follow the whole activities,
thus, only 33 students was taken as participants in this study.
3.4.2 Research instruments
The data needed to be collected is the score of the students before and after
the CSR is implemented. Those data will be analyzed to find out the effectiveness
of the treatment. There are three research instruments used to collect the data,
namely pretest, posttest, and questionnaire.
To measure students’ reading comprehension, reading comprehension test was conducted by using multiple choice. In collecting the data, firstly, the writer
administered pilot test in higher class to examine the validity, reliability, and
difficulty of the items of test that would be administered in the group.
The pretest was conducted to the group before giving the treatment in order
to measure the preliminary ability of the students. On the other hand, posttest was
employed in the last meeting after giving CSR treatment. It was used to find out
whether or not there is significant improvement in reading comprehension.
To collect students’ response toward the implementation of CSR in the classroom, questionnaire was given after the treatment. The questionnaire
contained some closed question related to students’ opinion toward the strategy
used in teaching and learning process.
3.5 Procedures of study
In collecting the data, some procedures were employed in this study which
Denissa Femi Primula, 2016
THE EFFECTIVENESS OF COLLABORATIVE STRATEGIC READING (CSR) IN IMPROVING
STUDENTS’ READING COMPREHENSION IN NARRATIVE TEXT
Universitas Pendidikan Indonesia| repository.upi.edu | perpustakaan.upi.edu
material, administering pilot test, administering pretest, applying the CSR to the
experimental group, administering posttest, and administering questionnaires.
3.5.1 Organizing the Teaching Procedure
There were two steps in teaching procedures. Firstly, researcher was
preparing the lesson plan and appropriate materials. In the preparing the lesson
plan, the researcher focused on reading skill. The lesson plan was designed for
four meeting out of six meeting. The first meeting was used for pretest. The last
meetings were used for posttest. The rest meetings were allocated for teaching
reading. The text for teaching material was taken from textbooks and internet that
appropriate with the syllabus. Secondly, the researcher was organizing teaching
procedure that was Collaborative Strategic Reading.
3.5.2 Administering Pilot Test
The pilot test is to examine the validity and reliability of the test that will be
given in pretest and posttest. It was administered before the pretest to the higher
class from the samples, since the higher class had learnt narrative text. The pilot
test was administered in the same school where the research was done. The test
consists of 50 items of narrative text. All of the questions are multiple choices.
After computing the result score using AnatesV4, the writer made an
analysis to find out the validity, reliability, level of difficulty, and discrimination
index of the test item. The valid and reliable item used in designing instrument for
pretest and posttest.
3.5.3 Pretest
After analyzing the data of pilot test, the researcher employed pretest to
measure students’ reading comprehension ability by using multiple choices. The
test is administered during school hours.
Denissa Femi Primula, 2016
THE EFFECTIVENESS OF COLLABORATIVE STRATEGIC READING (CSR) IN IMPROVING
STUDENTS’ READING COMPREHENSION IN NARRATIVE TEXT
Universitas Pendidikan Indonesia| repository.upi.edu | perpustakaan.upi.edu
The treatment used in this study was Collaborative Strategic Reading to enhance students’ reading comprehension. The group received the reading treatment for four days where the students take the main role in the learning
process, and the teacher role is as a prompter. In the last meeting, students were
given posttest to measure their reading comprehension after teaching and learning
process.
3.5.5 Posttest
The posttest was given to find out the students’ reading comprehension after
received treatment. At the end of the meeting, the group was given questionnaire to find out students’ response toward the implementation of CSR in teaching and learning process.
3.5.6 Administering questionnaire
The questionnaire was administered after the experimental group finished
the posttest. It was aimed to find out students’ opinion toward the implementation
of the treatment. The writer used closed questionnaire consists of 10 items which
give students chance to write down their reason. There were 7 items to find out students’ experience in using CSR as their reading strategy. The rest of the items were developed to find out their motivation when CSR was implemented.
3.6 Data Analysis
After collecting the data, the next step was analyzing the data. The following steps are how the data are analyzed.
3.6.1 Scoring
There are two types of formula in the process of scoring the multiple choice test. The formulas are formula with punishment and formula with no punishment. The writer uses formula with no punishment in order to avoid negative score. The formula is proposed as follows:
Denissa Femi Primula, 2016
THE EFFECTIVENESS OF COLLABORATIVE STRATEGIC READING (CSR) IN IMPROVING
STUDENTS’ READING COMPREHENSION IN NARRATIVE TEXT
Universitas Pendidikan Indonesia| repository.upi.edu | perpustakaan.upi.edu S = Obtain score
R = Right Answer
3.6.2 Pilot Test Analysis
3.6.2.1Validity
Validity refers to the interpretation and the generalizability of results (Wiersama & Jurs, 2009: 296). The purpose of conducting validity test is to find out whether or not the test is valid to be used in pretest and posttest. The instrument of test or evaluation tools is valid if it evaluates things that must be evaluated. There are two kinds of validity namely content validity and construct
validity. The test has content validity “if the content of the text constitutes a representative sample of the language skills, structure, etc.” (Hughes, 2003). It
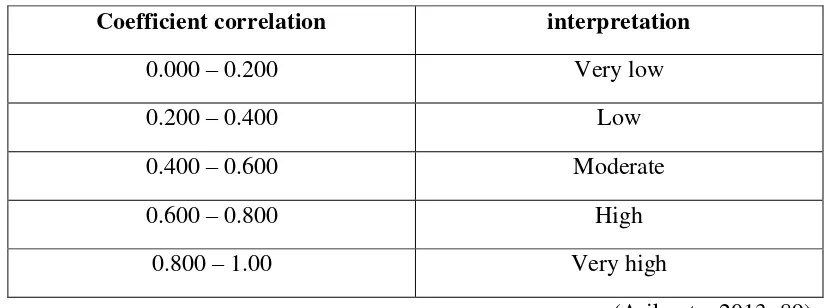
means the test includes material that has been taught to the students. Miller (1984) believe that the test needs construct validity which involves the judgement of validity of measure on the basis of interrelated experimental findings in order to be valid. To find out the validity of the test, Pearson’s Product-Moment (r) formula was applied. To help the process of calculation, the data calculated using AnatesV4 program. The data obtained is interpreted based on the category below.
Table 3.2 Category of Coefficient Correlation of Validity
Coefficient correlation interpretation
0.000 – 0.200 Very low
0.200 – 0.400 Low
0.400 – 0.600 Moderate
0.600 – 0.800 High
0.800 – 1.00 Very high
(Arikunto, 2013: 89)
Denissa Femi Primula, 2016
THE EFFECTIVENESS OF COLLABORATIVE STRATEGIC READING (CSR) IN IMPROVING
STUDENTS’ READING COMPREHENSION IN NARRATIVE TEXT
Universitas Pendidikan Indonesia| repository.upi.edu | perpustakaan.upi.edu
∑ ∑ ∑
√ ∑ ∑ ] ∑ ∑ ]
r = correlation coefficient
X = item score Y = total score N = number of subject
(Kranzler, 1999)
3.6.2.2Level of Difficulty Test
Index difficulty shows how easy or difficult the item is. This test was done
to measure the relevancy of the items to the participant’s ability, whether the test
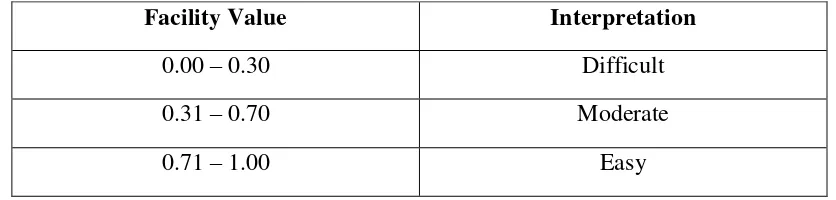
items were too easy or too difficult. The formula below is the formula of difficulty index:
� �
P = index of difficulty
B = the number of students who answer the item correctly JS = the number of students
(Arikunto, 2012: 223)
The score of index difficulty obtained after the calculation is interpreted based on the criteria below.
Table 3.3 Level of difficulty index
Facility Value Interpretation
0.00 – 0.30 Difficult
0.31 – 0.70 Moderate
0.71 – 1.00 Easy
(Arikunto, 2012: 225)
Denissa Femi Primula, 2016
THE EFFECTIVENESS OF COLLABORATIVE STRATEGIC READING (CSR) IN IMPROVING
STUDENTS’ READING COMPREHENSION IN NARRATIVE TEXT
Universitas Pendidikan Indonesia| repository.upi.edu | perpustakaan.upi.edu
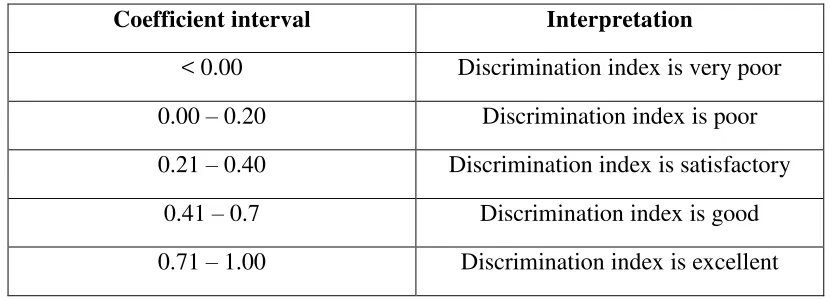
Discrimination index is an ability of test item to differentiate the upper group from the lower group in answering a single item of the test (Arikunto, 2012: 226). The higher discrimination index value is the higher discrimination between upper group and lower group. In this research which multiple choices was used as a test instrument, the formula of discrimination index is:
D = The discrimination index
BA = Number of upper group who answered the item correctly BB = Number of lower group who answered
JA = Number of upper group JB = Number of lower group
PA = Proportion of upper group who answered the item correctly ��
PB = Proportion of lower group who answered the item correctly ��
(Arikunto, 2012: 228-231)
After the discrimination index is obtained from, then it is interpreted based on the following categorization:
Table 3.4 The criteria of discrimination index
Coefficient interval Interpretation
< 0.00 Discrimination index is very poor 0.00 – 0.20 Discrimination index is poor 0.21 – 0.40 Discrimination index is satisfactory
0.41 – 0.7 Discrimination index is good 0.71 – 1.00 Discrimination index is excellent
(Arikunto, 2013: 232)
Denissa Femi Primula, 2016
THE EFFECTIVENESS OF COLLABORATIVE STRATEGIC READING (CSR) IN IMPROVING
STUDENTS’ READING COMPREHENSION IN NARRATIVE TEXT
Universitas Pendidikan Indonesia| repository.upi.edu | perpustakaan.upi.edu
3.6.2.4Reliability
Based on Punch (2009: 244), reliability refers to consistency. Consistency is divided into consistency overtime and internal consistency. He further described that consistency over time means stability of measurement over time, while internal consistency refers to whether or not the items are consistent with each other or all working in the same direction. The values of reliability coefficients can take on values of 0 to 0.99 which described below.
The table below displays the result of reliability in reading items:
Table 3.5 The reliability test of the reading comprehension
Coefficient of reliability Interpretation
0.0 – 0.7 Lowly reliable
0.7 – 0.9 Highly reliable
(McMillan & Schumacher, 1989)
Spearman-Brown formula is used to find the reliability of the test. The formula is stated as follows.
⁄ ⁄ ⁄ ⁄
r11 = instrument reliability
⁄ ⁄ = rXY which mentioned as correlation index between two instrument (Arikunto, 2010: 223)
Based on the calculation by using AnatestV4, the result of reliability of test items was 0.9. It means that it was categorized as highly reliable.
3.6.3 Pretest Data analysis
3.6.3.1Testing the Normal Distribution
Denissa Femi Primula, 2016
THE EFFECTIVENESS OF COLLABORATIVE STRATEGIC READING (CSR) IN IMPROVING
STUDENTS’ READING COMPREHENSION IN NARRATIVE TEXT
Universitas Pendidikan Indonesia| repository.upi.edu | perpustakaan.upi.edu 1. Stating the hypothesis
H0 : the distribution score of experimental group in pretest is normally distributed
Ha : the distribution score of experimental group in pretest is not normally distributed
2.Analyzing the normality distribution of test using the Kolmogorov-Smirnov formula in SPSS 20.0 for windows.
3. Comparing Dobt (absolute value of Kolmogorov Smirnov) with Dtab of
Dtab is the critical value of Kolmogorov-Smirnov N is the number of sample
(Santoso, 2015, p. 86) Dtab=
√ = 0.24
If the absolute value of Kolmogorov Smirnov more than Dtab (Dobt > 0.24), the null hypotheses (H0) is rejected. Meanwhile, if the result less than the Dtab (Dobt < 0.24), the null hypotheses (H0) is accepted and the alternative hypotheses is rejected.
4. If the pretest data is normally distributed, the computation is continued by using one sample t-test.
3.6.4 Posttest Data Analysis
3.6.4.1Testing the Normal Distribution
Denissa Femi Primula, 2016
THE EFFECTIVENESS OF COLLABORATIVE STRATEGIC READING (CSR) IN IMPROVING
STUDENTS’ READING COMPREHENSION IN NARRATIVE TEXT
Universitas Pendidikan Indonesia| repository.upi.edu | perpustakaan.upi.edu 1. Stating the hypothesis
H0 : the distribution score of experimental group in pretest is normally distributed
Ha : the distribution score of experimental group in pretest is not normally distributed
2. Analyzing the normality distribution of test using the Kolmogorov-Smirnov formula in SPSS 20.0 for windows.
3. Comparing Dobt (absolute value of Kolmogorov Smirnov) with Dtab of
Dtab is the critical value of Kolmogorov-Smirnov N is the number of sample
(Santoso, 2015, p.86) Dtab= √ = 0.24
If the absolute value of Kolmogorov Smirnov more than Dtab (Dobt > 0.24), the null hypotheses (H0) is rejected. Meanwhile, if the result less than the Dtab (Dobt < 0.24), the null hypotheses (H0) is accepted and the alternative hypotheses is rejected.
4. If the posttest data is normally distributed, the computation is continued by using paired sample t-test or dependent t-test.
3.6.5 Testing Paired Sample T-Test
Paired sample t-test is employed to compare the pretest and posttest score. Pretest data was students score before the treatment was implemented, while posttest data was students score after the treatment was implemented. There are some steps in conducting paired sample t-test: (1) stating the hypotheses and
select significance level (α); (2) computing tobt obtained from analyzing the
Denissa Femi Primula, 2016
THE EFFECTIVENESS OF COLLABORATIVE STRATEGIC READING (CSR) IN IMPROVING
STUDENTS’ READING COMPREHENSION IN NARRATIVE TEXT
Universitas Pendidikan Indonesia| repository.upi.edu | perpustakaan.upi.edu
comparing tobt with the level of significance for testing hypothesis. The first step is setting the level significance at 0.05 and the hypotheses are stated as follows: H0: there is no significance difference in mean of pretest and posttest score of experimental group
Ha: there is significance difference in mean of pretest and posttest score of experimental group
After calculating paired sample t-test, the result of tobt is compared to the significance level. If tobt is more than significance level (tobt > 0.05), the null hypothesis (H0) is accepted which means there is no significance difference in mean of pretest and posttest score of experimental group. In contrast, if tobt is less than 0.05 (tobt < 0.05), the null hypothesis (H0) is rejected which means that there is significant difference in mean of pretest and posttest score of experimental group.
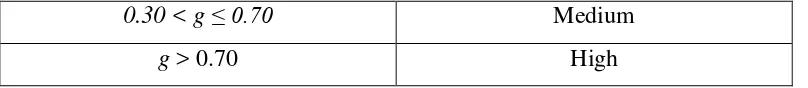
3.6.6 Students’ Classification of Gain Score in Experimental Group
After finding the pretest and posttest score, it is important to find the gain score of each student in experimental group. Gain index will be used if the mean
score of pretest are different to posttest. This is also to determine students’
achievement of cognitive quality improvement. Therefore, it examines whether or not they had improvement in their reading score. The improvement was calculated by the following formula (Hake, 1999):
Gain Score: Posttest score – Pretest score
<g>=
The quality of students’ reading comprehension in experimental group will
be interpreted from the following gain index:
Table 3.6 Interpretation of Gain Index
Gain Interpretation
Denissa Femi Primula, 2016
THE EFFECTIVENESS OF COLLABORATIVE STRATEGIC READING (CSR) IN IMPROVING
STUDENTS’ READING COMPREHENSION IN NARRATIVE TEXT
Universitas Pendidikan Indonesia| repository.upi.edu | perpustakaan.upi.edu
0.30 < g ≤ 0.70 Medium
g > 0.70 High
(Hake, 1999)
3.6.7 Data Analysis of Questionnaires
The writer uses questionnaire in order to collect the data to find out
students’ responses toward the use of CSR in reading. There were 10 items in the
questionnaire which was developed based on previous similar study. Seven items out of 10 items were made to explore students’ experience while reading using CSR. The rest of items were made to find out their motivation toward CSR. The questionnaire items can be seen on Appendix B. The questionnaire is assessed by using likert scale. In likert scale, the statement includes a value or positive or negative direction and the subject indicates agreement or disagreement (McMillan, 2012:157). The data from questionnaire is computed by the following formula:
P = percentage of samples’ answer
F0 = frequency of samples’ answer
n = number of samples
The interpretation of the result can be seen in the following tables.
Table 3.7 Interpretation of Questionnaire Percentage
Percentage Interpretation
0% None
0 % < p ≤ 25 % Small number / few
25 % < p < 50 % Almost half
p = 50 % Half / some
Denissa Femi Primula, 2016
THE EFFECTIVENESS OF COLLABORATIVE STRATEGIC READING (CSR) IN IMPROVING
STUDENTS’ READING COMPREHENSION IN NARRATIVE TEXT
Universitas Pendidikan Indonesia| repository.upi.edu | perpustakaan.upi.edu 75% < p < 100 % Commonly / mostly
p = 100 % All of them / the whole