Kamelia Paska Rusmana, 2015
RECIPROCAL TEACHING STRATEGY AND STUDENTS’ READING COMPREHENSION
Universitas Pendidikan Indonesia | repository.upi.edu | perpustakaan.upi.edu CHAPTER III
RESEARCH METHODOLOGY
This chapter presents the methodology in conducting the research. This
chapter provides four main parts of the investigation. It includes research design,
data collection techniques, research procedures, and data analysis technique.
3.1. Research Design
A quantitative method in the form of quasi experimental design was
employed in this study. There were two groups which were involved. The first
group was the experimental group (EG) and the second one was the control group
(CG). According to Fraenkel & Wallen (2009), an experiment regularly involves
two groups which can be determined as experimental group, control group or a
comparison group. In this study, the experimental group and the control group
received a different treatment in the classroom. Since the study was supposed to find the effectiveness of using reciprocal teaching strategy in improving students’ reading comprehension, the new method was applied in the experimental group
while the control group was given Question-Answer Relationship (QAR). The
new method was called by reciprocal teaching strategy. It was used as a treatment
for experimental group.
This research applied pre-test and post-test. A pre-test was administered
before the implementation of reciprocal teaching strategy as the treatment.
Pre-test was administered to measure the initial ability of the sample of the subject.
Later on, the post test was given to both groups. The purpose of the post test was
to find out whether the use of reciprocal teaching strategy was effective or not.
Kamelia Paska Rusmana, 2015
RECIPROCAL TEACHING STRATEGY AND STUDENTS’ READING COMPREHENSION
Universitas Pendidikan Indonesia | repository.upi.edu | perpustakaan.upi.edu Table 3.1
Sample Pre-test Treatment Post-test
EG O1 X O2
CG O1 - O2
EG refers to Experimental Group
CG refers to Control group
O refers to observation/measurement
X refers to exposure of group to an experimental variable
3.1.1. Variable
There were two variables in this study. According to Fraenkel & Wallen
(2009), variables can be classified as dependent and independent variable.
Variable in this study is defined as an attribute or characteristic of a person or of
an object which varies from person to person. Further, Kidder (as cited in
Sugiyono (2010) described that variable is a quality which the researcher studies
and makes conclusion.
According to Hatch & Farhady (1982), variable is classified into two
types. They are independent and dependent variables. The independent variable is
the variable which is selected, manipulated and measured by the researcher.
Meanwhile, the dependent variable is the variable which the effect of independent
variable is determined by a researcher. It can be concluded that the independent is
Kamelia Paska Rusmana, 2015
RECIPROCAL TEACHING STRATEGY AND STUDENTS’ READING COMPREHENSION
Universitas Pendidikan Indonesia | repository.upi.edu | perpustakaan.upi.edu
whereas, the dependent variable is an outcome which in this study refers to students’ reading score.
3.1.2. Hypothesis
According to Sugiyono (2010, p.96), hypothesis can be defined as
theoretical answer towards the statement of problems in the study which does not
rely on empirical data. Fraenkel & Wallen (2009, p.45) further stated that
hypothesis is a prediction of the possible result of a study.
In this study, there are two types of hypotheses; they are null hypothesis
and alternative hypothesis. The null hypothesis is accepted when there is no
significant difference between the score of students in the experimental and
control groups. Meanwhile, the alternative hypothesis is accepted when there is a
significant different from both groups. Therefore, According to Coolidge (2000)
and Kranzler & Moursund (1999), the null hypothesis and the alternative
hypothesis for this study are as follow:
H0 = there is no significant difference between the students’ post-test
scores of the experimental group and the students’ post-test scores of the control group.
HA = there is significant difference between the students’ post-test scores
of the experimental group and the students’ post test scores of the control group.
3.2. Data Collection
3.2.1. Population and Sample
According to Fraenkel, Wallen & Hyun (2012) that population is defined as a
Kamelia Paska Rusmana, 2015
RECIPROCAL TEACHING STRATEGY AND STUDENTS’ READING COMPREHENSION
Universitas Pendidikan Indonesia | repository.upi.edu | perpustakaan.upi.edu
other individuals. Meanwhile, sample is defined as the smaller group of
population. Since quasi experimental does not contain random selection of
subjects, the sample of the study was chosen purposively, based on the English teacher’s consideration, both classes have the ability which is relatively equal.
The population of this study was eighth grade students from one of junior
high schools in Cimahi, whereas, the samples were two classes, namely 8.15 as
the experimental group and 8.17 as the control group.
3.2.2. Research Instruments
In this study, the researcher used two kinds of instruments. They were test
and questionnaire. Those instruments were used to collect the data. It is supported
by Arikunto (2010, p.36) who stated that the instrument is all media which used
by the researcher to collect the data. The test for this study was divided into three
parts; pilot test, pre-test and post-test. The pilot test was utilized in order to
examine the validity, reliability and the difficulty of items that would be
administered in experimental and control groups. It was conducted in the class
which was not selected for both groups.
The pre-test and post-test were employed to generate the scores that were
analyzed to find out whether reciprocal teaching strategy is effective to improve students’ reading comprehension in reading narrative texts. The pre-test was conducted to both groups, experimental and control group before the treatments. It
was intended to know the initial ability of students’ reading skill in reading narrative texts. On the contrary, the post-test was employed for both experimental
and control groups at the end of the treatments. It was utilized in order to see
Kamelia Paska Rusmana, 2015
RECIPROCAL TEACHING STRATEGY AND STUDENTS’ READING COMPREHENSION
Universitas Pendidikan Indonesia | repository.upi.edu | perpustakaan.upi.edu
After the post-test, the questionnaire was administered to the experimental
group only. It aimed to know the students’ responses toward the use of reciprocal teaching strategy in the classroom. This questionnaire was constructed in checklist
type based on Guttman scale.
3.3. Research Procedure
3.3.1. Organizing Teaching Procedure
In this study, the researcher served as the teacher for both experimental
and control groups. As the preparation of learning process, the researcher
organized teaching procedure in three steps. The first step was preparing the
appropriate materials and media for teaching and learning process during the
treatment. The second step was preparing the lesson plan for both experimental
and control group.
3.3.2. Organizing Research Instrument
The researcher created the test items for both pre-test and post-test and
also constructed statements for questionnaire.
3.3.3. Testing the Validity and Reliability of the Pre-test and Post-test
through the Pilot test
The pre-test and post-test were tested to know whether or not the items
had possessed the validity and reliability. In addition, it was also intended to know
the difficulty index of items.
In this case, the pilot-test items were tested to the class which did not
obtain the pre-test and post-test. It was other class whom the students had received
Kamelia Paska Rusmana, 2015
RECIPROCAL TEACHING STRATEGY AND STUDENTS’ READING COMPREHENSION
Universitas Pendidikan Indonesia | repository.upi.edu | perpustakaan.upi.edu 3.3.4. Administering Pre-test
The pre-test was conducted for both experimental and control groups. It
was aimed to know the initial ability of the students especially in their reading
comprehension skills of narrative texts. Moreover, it was conducted to determine
both groups, experimental and control groups, have equal average score from the
result. It was administered to students in class 8.15 as experimental group and
8.17 as control group on Tuesday, 23rd of September 2014.
3.3.5. Conducting the Treatment
The Reciprocal Teaching Strategy was conducted in the experimental
Kamelia Paska Rusmana, 2015
RECIPROCAL TEACHING STRATEGY AND STUDENTS’ READING COMPREHENSION
Universitas Pendidikan Indonesia | repository.upi.edu | perpustakaan.upi.edu
Kamelia Paska Rusmana, 2015
RECIPROCAL TEACHING STRATEGY AND STUDENTS’ READING COMPREHENSION
Universitas Pendidikan Indonesia | repository.upi.edu | perpustakaan.upi.edu Text: The Ugly Duckling
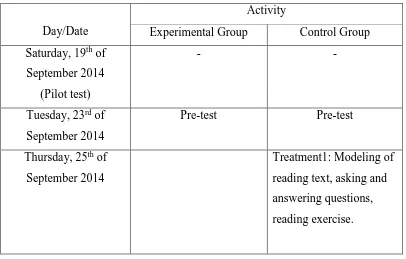
From the table above, Reciprocal Teaching Strategy treatment was given
to the experimental group and Question Answer Relationship (QAR) was given to
the control group. Both groups were received those treatments after conducting
the pre-test. Time allocation of each meeting for both groups was two hours. The
treatments were conducted in four meetings for both groups which are interpreted
as follows:
Experimental group
Before conducting the first treatment, at the very first time, the teacher
introduced the method of reciprocal teaching strategy to the students. The teacher
explained each strategy includes predicting, questioning, clarifying and
summarizing. The teacher showed some key points of this method which can be
Kamelia Paska Rusmana, 2015
RECIPROCAL TEACHING STRATEGY AND STUDENTS’ READING COMPREHENSION
Universitas Pendidikan Indonesia | repository.upi.edu | perpustakaan.upi.edu
(see appendix A). After that, the teacher prepared to model the four strategies one
at a time. The first section is predicting. The teacher showed the title of example
text and modeled how she observed and read the title. This stage is useful to gain reader’s prior knowledge. Then, the teacher made her prediction and listed it in the board. Later, the teacher showed the first paragraph of the text to the students
and modeled silent reading. It was intended to know the introduction of the text
itself. The second section is questioning. As they together read the first paragraph,
the teacher wrote down her prediction the next paragraph. In this part, the teacher
struggled to show the students how to generate the questions. The third section is
clarifying. The teacher guided the students how to notice on unfamiliar words or
confusing sentences in the text which needed to be clarified. Then she wrote the
unfamiliar words in the board and looked up on the dictionary. At the last stage,
after finishing reading the first paragraph, the teacher continued to show them
how to write and retell of what have read into short summary. After it finished, as
the follow up, the teacher invited some representative of students to review the
four stages to make sure that the all students understood to apply it when reading
text.
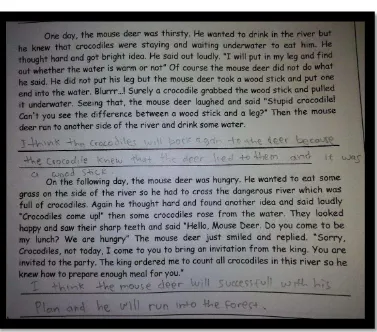
Treatment 1: A mouse deer and crocodile
After the teacher modeled the four strategies, to make in dept
understanding, the teacher divided the four strategies into four meetings, in which
each meeting utilized one strategy of reciprocal teaching method as the focus of
the learning. In the first treatment, the teacher modeled the predicting strategy to
the students. After that, the teacher grouped the students into 4-5 members. Each
group was given the section of texts which would discuss with their friends. In the
group, the students practiced to predict the text by observing the title first and
wrote down their prediction into the paper. In here, the teacher interacted (chit
chat) with the students, by asking what their prediction. Then they started silent
reading for the first paragraph. After finishing the first paragraph, they predicted
Kamelia Paska Rusmana, 2015
RECIPROCAL TEACHING STRATEGY AND STUDENTS’ READING COMPREHENSION
Universitas Pendidikan Indonesia | repository.upi.edu | perpustakaan.upi.edu
monitor themselves how correct their prediction about the text. This activity is
helpful since it could activate students’ brain and stimulated their knowledge. (Palinscar&Brown, 1984). This activity was continued until all the sections of the
finished to be discussed. Even though, focus of this meeting was all about
predicting, the teacher still trigger the students, if they had something from the
text which had to be clarified. So it helped them to be familiar with clarifying
strategy. An example of student’s prediction is presented in the following figure:
Kamelia Paska Rusmana, 2015
RECIPROCAL TEACHING STRATEGY AND STUDENTS’ READING COMPREHENSION
Universitas Pendidikan Indonesia | repository.upi.edu | perpustakaan.upi.edu
Treatment 2: Goldilocks and the three bears
In the second treatment, the focus of learning was clarifying and
questioning. First of all, the teacher still asked the students to work with their
group which had been organized in the previous meeting. The teacher
provided the second text to the students and asked them to repeat what had
been done in the previous meeting. In here the student had familiar how to
predict. The teacher continued to model the strategy of clarifying and
questioning. The students were asked to list some vocabularies or unfamiliar
words and then they discussed together with their friends to clarify one by
one. It is helpful since it could motivate the students to re-read the text and shared what they understood and what they didn’t. So when the text was clear they continue to read again. The teacher also asked the student to make
questions of what happened in the previous paragraph or for the following
paragraph. It was helpful to make students learned to identify important
information and ideas. (Doolitle et al,. 2006) After they finished the text, as
follow up, the teacher asked the representative of each group to share what
the important information that they could get from text, this activity was
Kamelia Paska Rusmana, 2015
RECIPROCAL TEACHING STRATEGY AND STUDENTS’ READING COMPREHENSION
Universitas Pendidikan Indonesia | repository.upi.edu | perpustakaan.upi.edu
Figure. 3.2. An Example of Student’s Clarifying and Questioning of Narrative text.
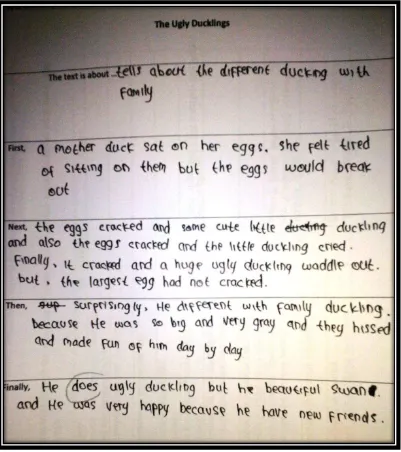
Treatment 3: The Ugly Duckling
As the third treatment, the teacher recalled the three strategies which are
predicting, clarifying and questioning in the beginning of the lesson as
brainstorming. The teacher provided another narrative text to be discussed. In
here, the teacher used summarizing strategy as the focus of the learning. The
teacher guided the students to read the text again by using predicting,
questioning and clarifying as what they had been learned in the previous
meeting. After they finished their reading, the teacher asked the students to
sum up what they had been read. First of all the teacher guided the students to
list some important points from another text, and then, the teacher showed
how to make summary from it by making mini draft from each section of
text. Summarizing strategy was helpful as their tool to self-review. Palinscar
Kamelia Paska Rusmana, 2015
RECIPROCAL TEACHING STRATEGY AND STUDENTS’ READING COMPREHENSION
Universitas Pendidikan Indonesia | repository.upi.edu | perpustakaan.upi.edu
Figure 3.3. An Example of Student’s Summary of Narrative text.
Kamelia Paska Rusmana, 2015
RECIPROCAL TEACHING STRATEGY AND STUDENTS’ READING COMPREHENSION
Universitas Pendidikan Indonesia | repository.upi.edu | perpustakaan.upi.edu
As the last treatment, the teacher recalled the four strategies in a different
way. The teacher presented four characters which owned the functions from
the four strategies. They are predictor, questioner, clarifier and summarizer.
In here, the students were asked to read another narrative story which each
member of the group acted the four characters. This activity would motivate
the students to be more active to engage in the discussion and helped them to
understand the text easier with fun activity. In the discussion, each member
had their job, student as predictor would help other students to predict about
the text. Student as questioner would help other students to make or generate
questions from the text. Student as clarifier would help to clarify unfamiliar
words which were in the text. And the last, summarizer helped their friends to
sum up the text/story. Finally, as the follow up, the teacher led big discussion
and asked the students about the text and asked what they had been
understood so far or their difficulties related to the four strategies.
Control Group
Control group used Question Answer Relationship (QAR) as the
treatments. The treatments were given to the students in the four meeting. In each
meeting, the teacher utilized the stages of QAR strategy to be implemented in the
classroom. The stage of QAR itself was focused on question-answer reading text
and exercises. Differ from the experimental group which gave different focus of
the learning in each meeting, control group did not. The control group utilized the
same treatments for the four meeting. So in here, only one example of the
implementation of this method in the first meeting which will be explained as
follows:
Treatment1: A Mouse Deer and Crocodile
In the first meeting, the teacher provided the students with one of narrative
Kamelia Paska Rusmana, 2015
RECIPROCAL TEACHING STRATEGY AND STUDENTS’ READING COMPREHENSION
Universitas Pendidikan Indonesia | repository.upi.edu | perpustakaan.upi.edu
the students had a clear view of the text. First of all, the teacher asked the students
to pay attention then the teacher read aloud the text in front of the students. After
that, the teacher invited some of students to read aloud the text in front of the
class. Related to the QAR strategy, after some representative students finished
read aloud the text, the teacher explained to the students about what the focus of
the lesson. In here, the teacher explained that to understand the whole text, the
students had to be able to answer the questions from the text. The teacher
explained that there were four types of questions that they would encounter when
they read the text. The four questions were examined based on QAR strategy,
those are: Right-there questions, Think and Search Questions, Author and You,
and On My Own. Before conducting reading exercise, the teacher modeled one
text by using QAR strategy. In here the teacher showed how the students could
find information to answer the questions. An example of the question can be seen
on the following figure:
3.4. An Example of the QAR Level of Questions from Narrative text: A Mouse
Deer and Crocodile.
Kamelia Paska Rusmana, 2015
RECIPROCAL TEACHING STRATEGY AND STUDENTS’ READING COMPREHENSION
Universitas Pendidikan Indonesia | repository.upi.edu | perpustakaan.upi.edu
After the treatments were applied in the classroom, the post-test was
administered to both experimental and control groups. It was aimed to investigate
the effectiveness of Reciprocal Teaching Strategy in improving students’ reading comprehension. Moreover, it was purposed to compare the post-test result of the
experimental and control groups.
3.3.7. Conducting Questionnaire
In the final step, the questionnaire was conducted in the experimental
group only. It was constructed based on Guttman scale. It was aimed to find out
the students’ responses toward the use of Reciprocal Teaching Strategy in the classroom. The questionnaire was related to the strengths and weaknesses of the
method. It was administered to Experimental group, 8.15, on Tuesday, October
14th, 2014.
3.4 Data Analysis
3.4.1. Scoring Technique
Since the researcher developed pre-test and post-test in the form of 40
numbers multiple choices, the test scores were determined by the correct numbers
answered which are divided by 0.4. Therefore, the maximum score that can be
obtained by the students is 100.
3.4.2. The Validity Test of Pilot-test
According to Sugiyono (2010, p. 173) stated that “Valid means the instrument can be used to measure what is should be measured”. Since this study used multiple choices as test, the content of the test should be valid. This study
employed content validity for validity testing. Thus, the Pearson Product Moment
Correlation Coefficient was used to find the validity. According to Kranzler &
Kamelia Paska Rusmana, 2015
RECIPROCAL TEACHING STRATEGY AND STUDENTS’ READING COMPREHENSION
Universitas Pendidikan Indonesia | repository.upi.edu | perpustakaan.upi.edu
r = �∑ − ∑ ∑
√{�∑ �−(∑ �)} {�∑ � –(∑ �)}
r = Pearson Product-Moment Correlation Coefficient
X = test item score (correct = 1. Wrong = 0)
Y = respondent’s score
N = respondent
The data were calculated by using Anates V4. After correlation coefficient
(r) value was calculated, the obtained value was gained, and then it was compared
to rcritical. If robtained ≥ rcritical, it means that the test is valid, while if the robtained ≤
rcritical, it means that the item is not valid.
3.4.3. The Reliability Test of Pilot-test
According to Hatch & Farhady (1982, p.244), reliability was utilized in
order to find the consistency of the result in a test when it is administered under
similar conditions. The reliability of the test was analyzed by using ANATES V4
and the Cronbach’s alpha in SPSS 20 for Windows. After that, the result was interpreted according to the following criteria:
Table 3.3
The Criteria of Reliability
0.00-0.20 Almost None
0.21-0.40 Low
0.41-0.60 Moderate
0.61-0.80 High
Kamelia Paska Rusmana, 2015
RECIPROCAL TEACHING STRATEGY AND STUDENTS’ READING COMPREHENSION
Universitas Pendidikan Indonesia | repository.upi.edu | perpustakaan.upi.edu
If the value of Cronbach’s Alpha of the test reaches the range 0.41 to 1.00, the test is considered to be reliable to be used. In the contrary, if the value is less
than 0.40, the test is considered inappropriate to be used in the study.
3.4.4. The Difficulty Index
The difficulty index is defined as the assumption in which the items of the
test should in the middle level, which means not too easy or too difficult. This
study used AnatesV4 to process the test. It was purposed to measure the degree of
difficulty of the test items. The formula is presented as follows:
P = �
��
P refers to difficulty index
B refers to number students who answered correctly
JS refers to number of students
3.4.5. Data Analysis on the Pre-test and the Post-test Scores
3.4.5.1. The Normal Distribution Test
In order to investigate the normal distribution of the set of data, the
Shapiro-Wilk test was employed. According to Razali (2011, p.25), the test was
used for the sample or subject which less than 50. Therefore, this test is
appropriate to be used since the sample of this research took two classes of eighth
grade students which each of the class has 26 students. The test was employed by
Kamelia Paska Rusmana, 2015
RECIPROCAL TEACHING STRATEGY AND STUDENTS’ READING COMPREHENSION
Universitas Pendidikan Indonesia | repository.upi.edu | perpustakaan.upi.edu
There were several steps in using Shapiro-Wilk test. The first step was
stating the hypothesis and setting the alpha level. The second was analyzing the groups’ scores by using Shapiro-wilk through SPSS 20 for windows. The last but not least was interpreting the output data.
In the first step, 0.05 (two-tailed) is set as the alpha level. Thus,
hypotheses are as follow:
H0 = the score of the experimental and control groups are normally
distributed.
HA = the score of the experimental and the control groups are not normally
distributed.
Finally, the data were analyzed by using Shapiro-Wilk through SPSS 20
for windows. The output data were interpreted by these ways: if the result is
non-significant (p < 0.05) which means the distribution of the sample is non-significantly
different from normal distribution (probably normal) and the null hypothesis is
rejected. In the contrary, if the result is significant (p > 0.05) then the distribution
is approaching the normal distribution and the null hypothesis is accepted.
3.4.5.2 Homogeneity of Variance Test
In analyzing the homogeneity of variance test, this study used the Levene’s test through SPSS 20 for windows. According to Field (2009, p.150), the variances in the groups are equal which means that the difference between
variances are zero.
There are several steps which should be followed in the Levene’s test. First, stating the hypothesis and setting the alpha level. The hypotheses are
classified into two types, null hypothesis and alternative hypothesis. The null
Kamelia Paska Rusmana, 2015
RECIPROCAL TEACHING STRATEGY AND STUDENTS’ READING COMPREHENSION
Universitas Pendidikan Indonesia | repository.upi.edu | perpustakaan.upi.edu
are homogenous, whereas, the alternative hypothesis (HA) is when the variances
of both groups are not homogenous. The next step is setting alpha level at 0.05 (∝
= 0.05 .
Further the data were analyzed through SPSS 20 for windows. After that,
the output data were interpreted by these ways: if the Levene’s test (F) is greater than alpha level (F > 0.05), it is determined as non significant, and then, the null hypothesis is accepted; if the Levene’s test (F) is less than alpha level (F < 0.05), it is determined as significant and the null hypothesis is rejected.
3.4.5.3. Independent T-test
The independent t-test is utilized in order to analyze a relevant relationship
between independent variable (treatment) and dependent variable (reading score)
that is measured on experimental and control groups. According to Coolidge
(2000, p.141), the focus of the test is determining whether or not there is
significant difference between the experimental and control groups’ means on the dependent variable.
In conducting the independent t-test, the hypothesis should be stated at
first. The hypotheses can be presented as follows:
H0 = there is no significant difference between both groups, experimental and
control.
HA = there is significant difference between both groups, experimental and
control.
After that, the alpha level is set at 0.05 (two-tailed test).
The second part is analyzing the groups’ scores by using independent test formula in the SPSS 20 for windows which the results in the t value or t obtained.
Kamelia Paska Rusmana, 2015
RECIPROCAL TEACHING STRATEGY AND STUDENTS’ READING COMPREHENSION
Universitas Pendidikan Indonesia | repository.upi.edu | perpustakaan.upi.edu
the hypothesis. The result or t obtained can be interpreted by these ways: if the result
> 0.05, the null hypothesis is rejected which means there is significant difference
of mean between experimental and control groups. In contrary, if the result <
0.05, the null hypothesis is accepted which means there is no significant
difference of mean between experimental and control groups.
3.4.5.4. Dependent T-test
In this case, the dependent t-test is purposed to compare the scores of the
experimental group on pre-test and post-test. The test focuses on determining
whether or not there is a significant difference between the pre-test and post-test
scores before and after the treatment. In conducting this test, the alpha level was
set first at (p = 0.05). And after that, the null hypothesis (H0) was stated which
there is no significant difference between the pre-test and post-test after the
treatment given. It means that there is no improvement. Next, the data obtained
were calculated by using the dependent t-test through SPSS 20 for windows. The
last was comparing the t obtained with the level of significance for testing the
hypothesis t critical. If the t obtained ≥ t critical, the null hypothesis is rejected, and if t obtained < t critical, the null hypothesis is accepted.
3.4.5.5 The Calculation of Effect Size
According to Coolidge (2000, p.151), the effect size is employed to find
out how far independent variable affects the dependent variable. In sort, the effect
size reflects how well the treatment works in this study. The effect size of
independent t-test was calculated by correlation coefficient with the formula can
Kamelia Paska Rusmana, 2015
RECIPROCAL TEACHING STRATEGY AND STUDENTS’ READING COMPREHENSION
Universitas Pendidikan Indonesia | repository.upi.edu | perpustakaan.upi.edu
r =
√
�2�2+ ��
r = effect size
t = the independent t-test value
df = degree of freedom (N1+N2-2)
After calculating the effect size, its value compared and analyzed by using the table’s scale. The correlation coefficient of effect size is always positive and range from 0 to 1.00. The scale can be figured as follows:
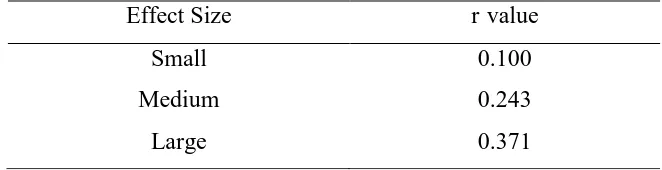
Table 3.4
The Scale of Effect Size
Effect Size r value
Small 0.100
Medium 0.243
Large 0.371
3.4.6. Data Analysis of the Questionnaire
The questionnaire was constructed by using Guttman scale. According to
Sugiyono (2010, p. 139), Guttman scale is used to obtain the explicit answer
towards the problems which were questioned by the researcher. The questionnaire
Kamelia Paska Rusmana, 2015
RECIPROCAL TEACHING STRATEGY AND STUDENTS’ READING COMPREHENSION
Universitas Pendidikan Indonesia | repository.upi.edu | perpustakaan.upi.edu
In order to analyze the questionnaire data, this study used the percentile formula. Then, the data were interpreted based on the frequency of students’ answer. According to Hatch & Farhady (1982, p.46), the formula can be presented
as follows:
P = 100 X �
�
P = Percentile
F = Frequency of students’ answer
N = Respondent
Kamelia Paska Rusmana, 2015
RECIPROCAL TEACHING STRATEGY AND STUDENTS’ READING COMPREHENSION