Yulita Estin Prihandini, 2014
STUDENTS’ PERCEPTION ON READING STRATEGIES FOR IMPROVING READING COMPREHENSION
Universitas Pendidikan Indonesia | repository.upi.edu | perpustakaan.upi.edu
CHAPTER III
RESEARCH METODOLOGY
This chapter provides the research methodology in order to answer the research question as follows.
1. What isstudents’ perception on reading strategies for improving reading comprehension?
This chapter includes research design, site and participant, data collection methods, and data analysis of the research.
3.1Research Design
The qualitative and quantitative approaches are employed in this study. The purpose of qualitative approach is to understand, describe and explain beliefs, behaviors and meaning in context-specific settings (Wu and Volker, 2009).Alwasilah (2008: 92) claims several characteristics of a qualitative research: (1) the focus of the research is ‘quality’, (2) the aim is description, findings and understanding, (3) the settings are natural, (5) the sample is small and purposive, and (6) the data collections consist of researcher as the main instrument, interviews and observations. The interviews wereconducted to find information about students’perception on reading strategies to collect the information in the survey.Data collected from interview were analyzed by using descriptive qualitative analysis method. Descriptive described the findings found in research, interpretation explained the meaning of finding, and theory combined the findings and meaning.
Yulita Estin Prihandini, 2014
STUDENTS’ PERCEPTION ON READING STRATEGIES FOR IMPROVING READING COMPREHENSION
Universitas Pendidikan Indonesia | repository.upi.edu | perpustakaan.upi.edu
3.2 Sites and Respondents
This research was conducted in one of the junior high schools in Bandung (SMP N 15 Bandung). The subject of the research was class 9th(9C) in the school. In conducting the research, the respondents were chosen by using simple random technique of sampling. It means all of students have an equal probability to be chosen as a sample. As Gay’s recommendation (cited in Nurmaya, 2003) that for correlation study the minimum sample is 30 subjects, while the present research took 32 students as sample of respondents. In this study, researcher decided to do the research in the site with reasons that the respondent is well behave and the site is easily accessible for researcher to do the research.
3.3Data Collection methods
Data Collection is an important aspect of any type of research study. Survey or questionnaire, interview, observation and document analysis are several methods that can be employed to collect data (Alwasilah, 2002). There are several techniques to collect the data such as observation methods, document review in gaining the information. There are several steps:
1. Data of reading strategies obtained from questionnaire
2. Data of reading achievement obtained from reading comprehension test 3. The result of interview
3.3.1 Questionnaire
Yulita Estin Prihandini, 2014
STUDENTS’ PERCEPTION ON READING STRATEGIES FOR IMPROVING READING COMPREHENSION
Universitas Pendidikan Indonesia | repository.upi.edu | perpustakaan.upi.edu
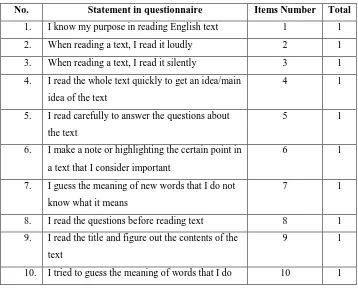
combine with theories of reading strategies from Brown (2001) (cited in Aeny 2009). The classifications of questionnaire items were using reading technique (items 2, 3, 4, 5), arranging and planning learning (item 1), creating structure for input and output (item 6), guessing intelligently (items 7, 14), receiving and ending messages (item 8), analyzing and reasoning (items 9, 11) creating mental linkages (item 10), empathizing with others (item 12). The scoring was adopted from SILL, where respondent will get score based on the statement they choose, one point means that the respondents never use that kind of reading strategy, two points means that they rarely use the strategy, three points means that they apply strategy occasionally, four points means that they use the strategy frequently, and five points means that respondent always use the strategies. The form of questionnaire consisted of fifteen positive statements with the frameworks as follows.
Table 3.1 The Aspects of Questionnaire
No. Statement in questionnaire Items Number Total
1. I know my purpose in reading English text 1 1
5. I read carefully to answer the questions about
the text
5 1
6. I make a note or highlighting the certain point in
a text that I consider important
Yulita Estin Prihandini, 2014
STUDENTS’ PERCEPTION ON READING STRATEGIES FOR IMPROVING READING COMPREHENSION
Universitas Pendidikan Indonesia | repository.upi.edu | perpustakaan.upi.edu
not know based on the meaning of the entire
text
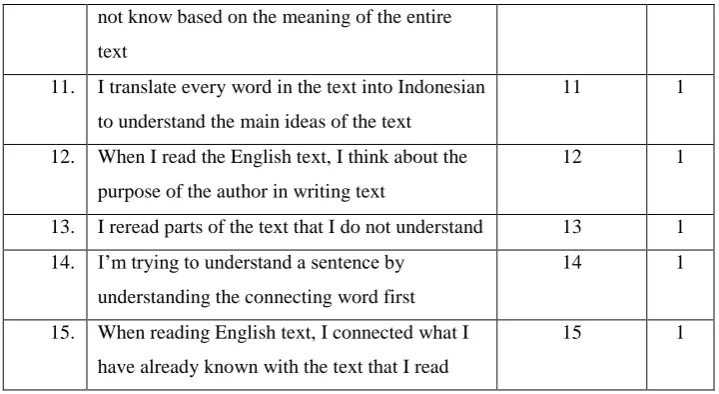
11. I translate every word in the text into Indonesian
to understand the main ideas of the text
11 1
12. When I read the English text, I think about the
purpose of the author in writing text
12 1
13. I reread parts of the text that I do not understand 13 1
14. I’m trying to understand a sentence by
understanding the connecting word first
14 1
15. When reading English text, I connected what I
have already known with the text that I read
15 1
Last, the questionnaire calculated and classified based on Oxford Classification (cited in Aeny 2009). She classified the category into:
Table 3.2 The Criteria of Frequency Level of Reading Strategies
Criteria Frequency Score
Very high Always or almost
always
4.50-5.00
High Usually 3.50-4.49
Medium Sometimes 2.50-3.49
Low Rarely 1.50-2.49
Very low Never or almost never 1.00-1.49
3.3.2 Interview
Yulita Estin Prihandini, 2014
STUDENTS’ PERCEPTION ON READING STRATEGIES FOR IMPROVING READING COMPREHENSION
Universitas Pendidikan Indonesia | repository.upi.edu | perpustakaan.upi.edu
3.3.3 Reading Test
The reading test was conducted to measure students’ reading comprehension. The test was conducted at once. The time allocated for respondent to finish the test was 90 minutes. The test was in form of multiple choices consist of twenty numbers test which developed based on standard of competence for third grade junior school. The test was taken from (BSE) English in focus book for the evaluation. During the test students were asked to find specific information from the passage.
In this way, the scores were processed to the scale of 0 to 100. In addition, the processed scores would be used sequentially from the highest to the lowest. Harris (1969: 134) suggests that the measurement of students’ achievements can be interpreted by using some criteria.
Table 3.3 The Measurement of Students’ Achievement
Criteria of Mastery Grade Grade
91-100 Excellent validity and reliability must be tested. The validity was used to measure whether the reading test represent certain things to be measured as stated by Anderson et al (cited inAeny, 2009) ‘a test is valid if it measures what it purpose to measure while, reliability was used to measure the level of consistency of the test as Anderson et al (cited in Aeny, 2009) restate the reliable measure is one that provides consistent and stable indication of the characteristic being investigated.
Yulita Estin Prihandini, 2014
STUDENTS’ PERCEPTION ON READING STRATEGIES FOR IMPROVING READING COMPREHENSION
Universitas Pendidikan Indonesia | repository.upi.edu | perpustakaan.upi.edu
item in determine respondents reading skill. It also can be able to determine the ability of high achiever and low achiever students.
The formula of difficulty index:
P = difficulty index
B = total number of the right answer T = number of sample
(Arikunto, 2008; 208)
The range of difficulty index
- 0. 00 P 0. 30……….Difficult - 0. 30 P 0. 70……….Moderate - 0.70 P 1. 00………..Easy
The formula of discriminating power index
D = discriminating power index
Ju = number of respondent in upper group
Jl = number of respondent in lower group
Bu = number of respondent in upper group answering right
Bl = number of respondent in lower group answering right
Pu = number of respondent in upper group answering wrong
Pl = number of respondent in lower group answering wrong Classification of discriminating power index
- D = 0.00 – 0. 20 – poor
Yulita Estin Prihandini, 2014
STUDENTS’ PERCEPTION ON READING STRATEGIES FOR IMPROVING READING COMPREHENSION
Universitas Pendidikan Indonesia | repository.upi.edu | perpustakaan.upi.edu
a. Testing Validity
To calculate the validity of reading test, each item of the test was analyzed and calculated by using Pearson Product Moment Correlation Formula:
(Arikunto, 2008 cited in Aeny, 2009)
X = score item for each number
Table 3.4 The Criteria of Validity Correlation Coefficient Validity Criteria
(Arikunto, 2008 cited in Aeny, 2009)
b. Testing Reliability
The reliability of the reading test was analyzed by using Split-half Method. The obtained data were separated equally become two parts based on the item number of the test. After that, the obtained data calculated by using Pearson Product Moment Correlation. After the formula gained, Spearman-Brown formula then used to gain the data.
where
(Arikunto, 2008 cited in Aeny, 2009)
r11 = coefficient reliability
Yulita Estin Prihandini, 2014
STUDENTS’ PERCEPTION ON READING STRATEGIES FOR IMPROVING READING COMPREHENSION
Universitas Pendidikan Indonesia | repository.upi.edu | perpustakaan.upi.edu
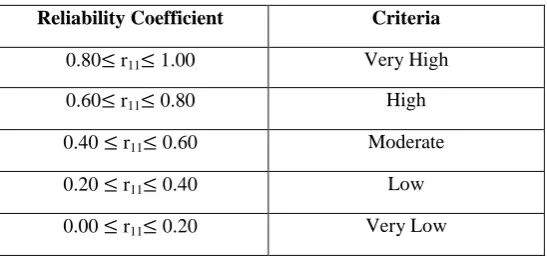
Table 3.5 The Reliability Level Based on the Alpha Value
Reliability Coefficient Criteria
0.80 r11 1.00 Very High
0.60 r11 0.80 High
0.40 r11 0.60 Moderate
0.20 r11 0.40 Low
0.00 r11 0.20 Very Low
(Arikunto, 2008 cited in Aeny, 2009)
3.4Data Analysis
In this study, the data were gained through interview, survey questionnaire and with the aim of getting the fullest evaluation from students’ perception on reading strategies. The evaluation of the datawas carried out in accordance with the following steps:
1) Survey questionnaire: was used to collect data that relates to the students’perception on reading strategies for improving reading comprehension.
2) Interview: The steps to analyze the interview data were recording students’ statements on reading strategies then describing the recording. The next step categorizing the data based on some aspects. Data collected from interview were analyzed by using descriptive qualitative analysis method.
3) Reading test: the reading comprehension test was used to measure students’ reading comprehension
There are many different ways to analyze the qualitative data. After having the data from the video recordings, interviews and questionnaires, the researcher analyzed the data employing the following steps adopted from Dornyei (2008.)
3.4.1 Questionnaires
Yulita Estin Prihandini, 2014
STUDENTS’ PERCEPTION ON READING STRATEGIES FOR IMPROVING READING COMPREHENSION
Universitas Pendidikan Indonesia | repository.upi.edu | perpustakaan.upi.edu
Table 3.6 Likert Scale Score
Always Often Sometimes Seldom Never
Score 5 4 3 2 1
(Adopted from Sugiyono, 2008: 135 cited on Hardiani : 2011)
The average scores of each strategy and the overall average were calculated in finding what types of strategies mostly used by students. The highest average scores on each strategy showed which groups of strategy the students mostly used in reading, while the overall average showed how often the students used strategies for reading.
To find the average value or mean the formula used:
X =
(Adopted from Sugiyono, 2008: 135 cited on Hardiani : 2011)
X = Average ∑x = total Score
N = Number of Subjects
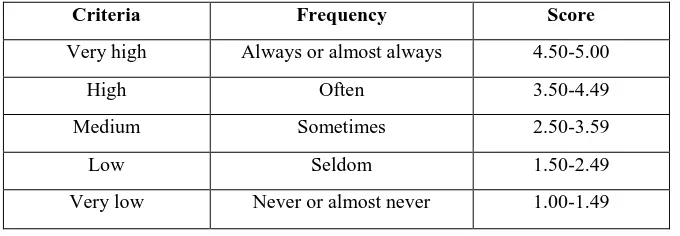
Furthermore, the responses were classified based on the criteria for evaluating the frequency of strategy use formulated by Oxford as follow.
Table 3.7 The Criteria of the Frequency Level of Reading Strategies
Criteria Frequency Score
Very high Always or almost always 4.50-5.00
High Often 3.50-4.49
Medium Sometimes 2.50-3.59
Low Seldom 1.50-2.49
Very low Never or almost never 1.00-1.49
Yulita Estin Prihandini, 2014
STUDENTS’ PERCEPTION ON READING STRATEGIES FOR IMPROVING READING COMPREHENSION
Universitas Pendidikan Indonesia | repository.upi.edu | perpustakaan.upi.edu
The reading comprehension test was used to measure students’ reading comprehension. To obtain the score of the test, this study employed a simple formula.
CA = Number of correct answers N = Number of the total items
In this research, normality test was carried out by Kolmogorov-Smirnov (cited on Hardiani, 2011) formula using SPSS. The decision of normality in this research comes upon the level of significance at 0.05. Therefore, since the distribution of students reading comprehension score greater than 0.05, it can be said that the data was normally distributed. If the data normally distributed, it means that the sample represents the while population. On the contrary, if it is not normally distributed, it only works at the sample.
The normal distribution score hypothesis for reading strategies and reading comprehension are as follows:
Ho: the reading strategies score and reading comprehension score are normally
distributed.
Ha: the reading strategies score and reading comprehension score are not normally
distributed.
3.4.3 Analyzing Correlation between Students Reading Strategies and Their Reading Comprehension
After the data of students’ reading strategies and reading comprehension test were gained, the data were analyzed by using Pearson Moment Correlation Formula. The data were analyzed by using Pearson Moment Correlation Formula through computerization which known as SPSS.
The Pearson Moment Product Correlation Formula
Yulita Estin Prihandini, 2014
STUDENTS’ PERCEPTION ON READING STRATEGIES FOR IMPROVING READING COMPREHENSION
Universitas Pendidikan Indonesia | repository.upi.edu | perpustakaan.upi.edu
∑ x = the totaling of x ∑ y = the totaling of y
∑ xy = the totaling of x times y
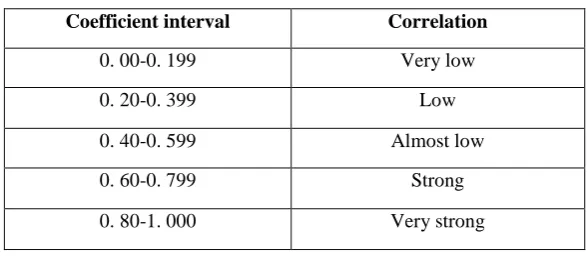
After the correlation coefficient gained through analyzing Pearson Product Moment Correlation, the previous finding interpreted based on Sugiyono’scorrelationreference (cited in Aeny, 2011). For correlation, the null hypothesis is that r = 0 -- that there is no relationship between the variables. The hypotheses concern whether or not there exists a non-zero correlation in the population.
If the absolute value of the obtained r is less than the r- critical, then retain the null hypothesis and conclude that there is no linear relationship between the two variables, in the population represented by the sample.
If the absolute value of the obtained r is greater than the r-critical, then reject the null hypothesis and conclude that there is a linear relationship between the variables in the population represented in the sample.
Table 3.8 Sugiyono’s Correlation Reference
Coefficient interval Correlation
0. 00-0. 199 Very low
0. 20-0. 399 Low
0. 40-0. 599 Almost low
0. 60-0. 799 Strong
0. 80-1. 000 Very strong
Yulita Estin Prihandini, 2014
STUDENTS’ PERCEPTION ON READING STRATEGIES FOR IMPROVING READING COMPREHENSION
Universitas Pendidikan Indonesia | repository.upi.edu | perpustakaan.upi.edu
The interviewers were asked to explain their perception towards reading, their reading comprehension, and their difficulties in reading, and their reading strategies. The steps to analyze the interview data were recording students’ statements on reading strategies then describing the recording. The next step categorizing the data based on some aspects. Data collected from interview were analyzed by using descriptive qualitative analysis method. Descriptive describes the findings found in research, interpretation explains the meaning of finding, and theory will combine the findings and meaning. The next step categorizing the data based on some aspects. The aspects were students’ interest towards reading, the most favorite reading text, motivation to read, aims and advantages of reading, students’ comprehension on the text, students’ effort in understanding the text, the characteristic of difficult text, the existing reading strategies which students had already known, motivation to use reading strategies, and the applied reading strategies.
3.4.5 Transcribing the data
Qualitative research data is generally converted into textual form, producing hundreds of pages of transcripts. The recording gained from the observation and interview will transcribe to know the data thoroughly about students’ perception on reading strategies.
3.4.6 Pre-coding and Coding
After transcribing all the data, the researcher read through all the texts to get the same general sense of the data, reflected on them, and noted down some thoughts. This is called pre-coding. The process of coding is highlighting the texts and giving it label, so the researcher could easily identify, retrieve and group data.
3.4.7 Growing ideas
To develop the main theme of the study, researcher tried to grow ideas by preparing memos, interview profile, and data display. From this, the researcher was helped in meeting the research questions with the answers, discovered the phenomena of the techniques in presenting reading comprehension.
3.4.8 Interpreting the data and drawing conclusion
Yulita Estin Prihandini, 2014
STUDENTS’ PERCEPTION ON READING STRATEGIES FOR IMPROVING READING COMPREHENSION
Universitas Pendidikan Indonesia | repository.upi.edu | perpustakaan.upi.edu