CHAPTER III
RESEARCH METHODOLOGY
This chapter elaborates more in-depth details about the procedures applied
in conducting study which have been briefly elaborated in Chapter I. The
procedures include formulation of problem, research design, hypothesis,
participant, data collection, and data analysis.
3.1Formulation of Problem
It is necessary to formulate the problem before the research is designed.
This formulation of problem is based on the research question to ensure that the
research is designed to find the answer of the question. Because the method of this
study is correlational, only one research question is formulated. Thus, it needs to
be noted that this study attempted to figure out the answers to the question “Is there any relationship between the readability levels of texts used as teaching
materials and vocational high school students’ reading comprehension ability?” Additionally, it is important to note that this question includes the
investigation of whether the relationship is significant statistically and practically
if it turns out that there is a relationship between those variables.
3.2 Research Design
The research design of the present study is based on positivism paradigm
with quantitative approach. The method used is correlational as the present study
only investigates the relationship between the readability levels of text materials
with the students’ reading comprehension ability in non-causative way. This is in line with the definition of correlational research, which is a study that involves
exists between two or more quantifiable variables (Gay, 1982, p. 430) as cited in
Sukardi (2008, p. 166)
To maintain the feasibility of the research, the present study will take
approximately a month to gather data from the samples. This range of time
includes development of materials for the instruments, the instrument tryout, the
test administration, and the measurement of readability. Depending on the
school’s policy, the instrument will be formulated based on either the text materials from the textbook used in the school or other resources outside the
textbook. The readability of those texts will be analyzed and categorized based on
their respective level. After that, the data collection can be conducted by
employing the instrument to the samples.
As the scores result from the test are not in form of ranked data, statistical
calculation using Pearson’s Product Moment formula will be used to analyze the
data resulted from the test given to all of the samples. It needs to be noted that
Pearson’s Product Moment formula should only be used if the data obtained are
normally distributed. Other correlation measures may be used if the data are
skewed. Further details about this will be presented later in data collection and
data analysis.
3.3 Hypothesis
Prior to collecting the data needed for this study, it is important to make a
prediction about the relationship between the variables involved in the topic of the
study. In this case, the readability levels of text materials will be the X variable,
while the students’ reading comprehension scores will be the Y variable. It is
expected that the instrument employed to gather the data are standardized,
meaning that it is reliable and able to measure what it is supposed to measure the
relationship between both variables.
In this study, a hypothesis has been formulated in the null form. The null
hypothesis is that the readability level of texts used as teaching materials is not
Thus, in contrast, the alternate hypothesis is that the readability level of texts used
as teaching materials is related to vocational high school students’ reading
comprehension ability. A hypothesis testing will be administered by the use of
statistics to determine if the probability that the hypothesis is true (Weisstein,
2012).
There are several steps in hypothesis testing. First, a relevant statistical test
must be determined to assess the truth of the null hypothesis. Second, the p-value
is calculated. Assuming that the null hypothesis was true, the probability that a
statistical test at least as significant as the one observed would be obtained is
explained by the p-value. After the p-value is obtained, it is compared to an
acceptable significance alpha value. If p-value is lower than alpha value, then the
observed effect is statistically significant, the alternative hypothesis is valid, while
the null hypothesis is ruled out.
3.3 Participant
3.3.1 Population
Population is a whole subject of the research (Arikunto, 2003). As the title
of the present study suggested, the participants of this study are vocational high
school students. The present study took place in a vocational high school in
Bandung. The population of this study is the students who major in Office
Administration. There are four classes with about 120 students in total.
3.3.2 Sample
The number of students needed to be the sample is at least 30 students.
Generally, 30 samples are considered minimal in correlational studies. It is
supported by Gay et al. (2006) who assert that to establish a relationship, there
should be at least 30 participants in a correlational study. Moreover, Waters
(2014) suggests that 30 or more participants are important to increase the validity
of the study.
The samples were drawn by means of purposive sampling. A class of 35
materials from the textbook. As a matter of consideration, due to the fact that
some vocational high school has adapted the 2013 Curriculum to the first and
second grader in which the time allocation for English subject is very limited, the
sample was drawn from only one second grade class. One of the other classes was
used to conduct a pilot test.
3.4 Data Collection
As correlational studies commonly need several scores to be analyzed, one
or more valid and reliable instrument is needed. The instrument validity will
ensure that the instrument measures what it is supposed to measure, while
reliability will prove whether the instrument is reliable or not to be used as
measurement in collecting the data (Arikunto, 2003). Therefore, an instrument
trial or instrument tryout was conducted before the instrument is used to collect
the data for the present study.
There were two kinds of instrument which were used in the present study.
The first was a reading comprehension test. A class which reputed to have
averagely similar English proficiency and grade level with the samples was given
a pilot reading comprehension test. This pilot test served as an instrument tryout
to ensure reliability and validity of the test.
The second instrument was a readability formula. The formula was used to
analyze the readability of text materials the teacher implemented in the teaching
and learning process. As stated in Chapter I, the readability formula which will be
used is Coh-Metrix. This formula was chosen as a matter consideration since it
has been tested to be suitable to measure texts in EFL contexts (Crossley et al.,
2011).
3.4.9 Test Administration and Readability Analysis
The materials which were used to formulate the test were taken from three
texts on a textbook. This textbook was used simultaneously with other supporting
and ten true-and-false questions. It was formulated by mixing the types of
question that ask for main idea, specific information, synonym of word and
implicit message. Additionally, the questions were aimed to assess micro skills
adapted from Brown (2001) with no involvement of testing the students’ knowledge about generic structures of the text.
After the test was formulated, a pilot test was administered. Several
revisions on the test items were made prior to administering the test to the actual
sample. The number of students who participated as sample was 30 students out
of 35. The remaining five students were not present in the class at that time. Those
who took the test were given 30 minutes to finish it.
As for the readability analysis, both of the texts were analyzed using
Coh-Metrix. The texts were in form of argumentative text and speech with an average
range of words of 300 to 500.
3.4.5 Validity Test
As explained before, a reading comprehension test was used as a mean of
measurement to collect the data from the students. This test was in a form of
achievement test, and was intended to obtain students’ reading comprehension scores from three different texts. Likewise, the validity and reliability of this test
were evaluated in order to create a standardized test. After the instrument tryout,
to evaluate both validity and reliability of the test, the software Anates and SPSS
were used. The score obtained by the test was then be classified into groups and
be analyzed.
In Anates and SPSS, validity was measured by processing the data
obtained from the pilot test through the use of Pearson Product Moment formula.
(NCS Pearson, 2014)
r = Pearson correlation coefficient
x = Values in first set of data
y = Values in second set of data
n = Total number of participants
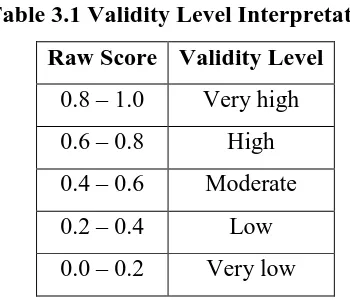
A test item is considered to be valid if the robt is higher than rcrit. On the
contrary, a test item is considered to be invalid if the robt is lower than rcrit. After
the result of the calculation has been obtained, the following table was used as a
reference.
Table 3.1 Validity Level Interpretation
Raw Score Validity Level
0.8 – 1.0 Very high 0.6 – 0.8 High 0.4 – 0.6 Moderate 0.2 – 0.4 Low 0.0 – 0.2 Very low
(Arikunto, 2003)
3.4.6 Reliability Test
Reliability is the degree to which a measurement technique can be
depended upon to secure consistent results upon repeated administration.
(Professional Testing Inc., 2006) It has to do with the consistency, or
reproducibility, or a test taker's performance on the test. Simply put, if a test with
high reliability is administered to a test taker on two occasions, it would be very
likely to reach the same conclusions about the test taker's performance both times.
To measure the reliability of the reading comprehension test employed in
this study, a split half method was used. Split half method only requires a set of
questions, this method will show how much error in a test score is due to poor test
construction (Arikunto, 2003). In case of this study, it was split based on the text
respectively. After that, as the contents of the instrument are dichotomous items,
the following Kuder-Richardson 20 (KR-20) formula was considered the best
accepted statistic to calculate the reliability coefficient.
(Arikunto, 2003)
Where,
pi = the proportion of correct responses to test item i
qi = the proportion of incorrect responses to test item i (so that pi + qi = 1)
Then, the following formula was used to calculate the variance for the
denominator.
Where,
n = the total sample size.
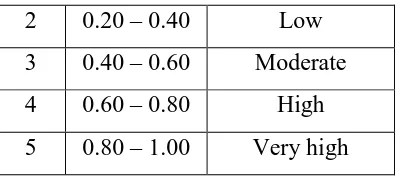
Finally, the score obtained by applying all of the formula above was
consulted to the following table.
Table 3.2 Reliability Level Classification
No. Coefficient Reliability level
2 0.20 – 0.40 Low 3 0.40 – 0.60 Moderate 4 0.60 – 0.80 High 5 0.80 – 1.00 Very high
(Sugiyono, 2003)
3.4.7 Difficulty Index
To find the difficulty level of the reading comprehension test, difficulty
index is calculated. This index, according to Arikunto (2003), illustrates the value
of difficulty for each test item. Averagely, it is recommended that the level of
difficulty for a four-option multiple choice test should be between 60% and 80%.
The following formula was to calculate the difficulty index of the test.
Difficulty Index (p) = C/T
(Wilson, 2005)
p = difficulty Index
C = the number of test takers who answer item X correctly
T = the number of total test takers who answer item X
The result of the calculation was then consulted to the table below.
Table 3.3 Difficulty Index
No. Index Degree
1 0.00 – 0.30 Difficult 2 0.31 – 0.70 Moderate 3 0.71 – 1.00 Easy
(Wilson, 2005)
To measure students’ overall ability, the significance of test items was
calculated based on discriminatory power. The result of the calculation using the
formula below was in a form of interpretation which was then considered in
classifying the test takers.
(Wilson, 2005)
Where
D = discriminatory power
N = the number of unrelated strains tested
S = the number of different types
xj = the number of strains belonging to the jth type, assuming that strains will be
classified into mutually exclusive categories.
The result was then consulted to the following table.
Table 3.4 Discriminatory Power
Discriminatory Power Classification
< 0.01 Intolerable, must be left out
0.00 – 0.20 Poor, but still tolerable
0.21 – 0.40 Moderate
0.41 – 0.70 Good
0.71 – 1.00 Excellent
(Arikunto, 2003)
3.5 Data Analysis
After the data were collected, they were classified, and analyzed on the
The descriptive statistics which include measure of central tendency and spread
were applied to show the mean, median, mode, range, variance and standard
deviation of the obtained data. This was done to summarize the group of data
using a combination of tabulated description, graphical description and statistical
commentary in the next chapter.
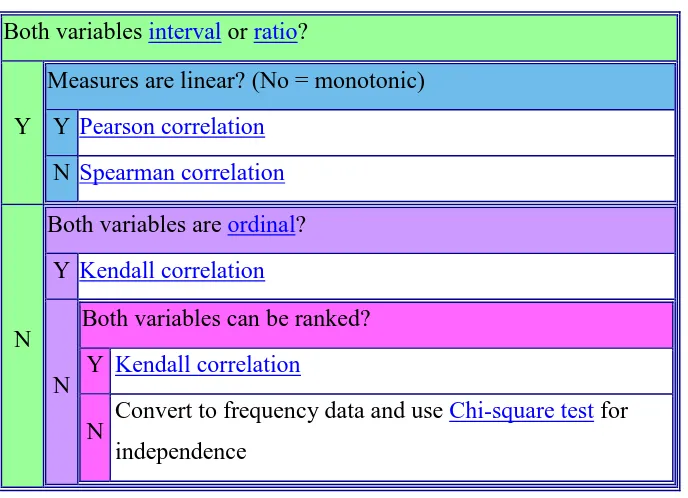
To find out the answer to the research question, the correlation coefficient
between both variables was calculated by using Pearson Product Moment formula.
The result was referred to a table of statistical significance at the minimum level
of 0.5. The use of Pearson Product Moment formula was taken into account based
on the table below.
Table 3.5 Guide to Correlational Test
Both variables interval or ratio?
Y
Measures are linear? (No = monotonic)
Y Pearson correlation
N Spearman correlation
N
Both variables are ordinal?
Y Kendall correlation
N
Both variables can be ranked?
Y Kendall correlation
N Convert to frequency data and use Chi-square test for independence
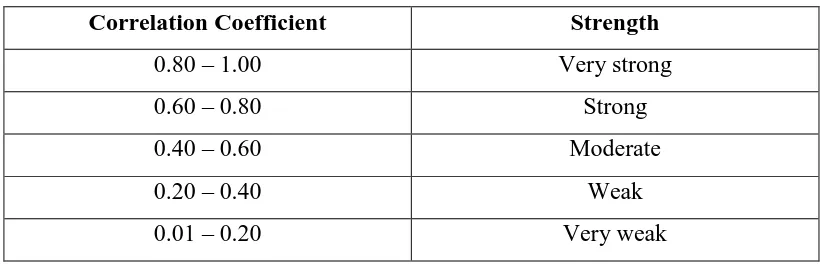
The following are Pearson Product Moment formula and a table to reveal
(NCS Pearson, 2014)
r = Pearson correlation coefficient
x = Values in first variable
y = Values in second variable
n = Total number of participants
Table 3.6 Correlation Coefficient Strength
Correlation Coefficient Strength
0.80 – 1.00 Very strong
0.60 – 0.80 Strong
0.40 – 0.60 Moderate
0.20 – 0.40 Weak
0.01 – 0.20 Very weak
Next, to determine the most appropriate correlation measure, the data were
analyzed if they are normally distributed. This was done because Pearson’s
correlation assumes that both of the sets of values being looked at come from
distributions that are roughly in normal shape (Kranzler & Moursund, 1999).
Further, a coefficient of determination was computed to investigate the
degree of the contribution of the readability level of text materials towards
students’ reading comprehension ability. This coefficient determines how is the degree of the first variable to explain the second variable (Collidge, 2000).
The value of correlation coefficient (rxy) which has been obtained was used
to find the coefficient of determination. The computation uses the following
formula.
(Collidge, 2000)
Finally, after the data obtained by using the instruments were analyzed, the
findings were identified and discussed. They will be presented in the next chapter
along with the result of validity and reliability test, and the answers to the research
question and hypotheses.
3.6 Clarification of Terms
Prior to conducting the study, several main terms need to be clarified to
avoid misunderstandings. They are as follows.
Readability : An extent in which a text can be read and understood. This
term refers to all the factors that affect success in reading
and understanding a text. These include the complexity of
words and sentences in relation to the reading ability of
the reader; the interest and motivation of the reader; and
the legibility of the print (Johnson, 2014).
Text : Text may be defined as a stretch of language that is
semantically and pragmatically coherent in its real-world
context. On the other hand text may be defined as 'any
unchangeable sequence of sentences which has a strong
cohesion and the unchangeable character of which is
related to a value system of some sort (Pavel, 1980; Carter
& McCarthy, 2006).
Reading Ability : The skill or activity of getting information from texts,
reading ability will be arguably developed best in
association with writing, listening, and speaking as
integrated and interactive approach in language teaching
emphasize the interrelationship of skills. (Brown, 2001)
Comprehension : The process of acquiring or developing the meaning of
paragraphs, texts, and other longer materials (Otto &
Chester, 1976).
EFL : Abbreviation for English as a Foreign Language. This is a
second language which is not widely used in the learners’
immediate social context, but rather one which might be
used for other particular purposes like future travel,
cross-cultural communication situations, or as a curricular