Trinne Anggita Ayu Putri, 2014
THE USE OF MIND MAPPING IN IMPROVING STUDENTS’ READING COMPREHENSION ABILITY (A Quasi-Experimental Research at One Vocational High School in Bandung)
Universitas Pendidikan Indonesia | repository.upi.edu | perpustakaan.upi.edu
CHAPTER III
METHODOLOGY
This chapter elaborates the procedures of the study to answer questions
stated in previous chapter. Some big points that cover in this chapter are research
method, hypothesis, sample, data collection, research procedure, and data
analysis.
3.1 Research Method
3.1.1 Research design
The purpose of this study is to find out whether mind mapping technique
improves students‟ scores in reading comprehension effectively and to find out
the students‟ responses toward the use of mind mapping in reading comprehension.
The research method in this study is quantitative method with quasi
experimental design. According to Hatch and Farhady (1982) “quasi experimental
design is used as one of the best research approaches in the research since it aims
practically to compare true experimentation and the nature of human language
behaviour which we wish to investigate” (p. 24).
There are two groups taken as the investigated groups in this study which
classify as different groups. There are control group which receive no treatment
and experimental group which receive mind mapping technique as a treatment
during learning process. The data in experimental group is collectted by giving the
students pre-test through reading test and than the resercher give the students
treatment by applying mind mapping technique in teaching process. After that, the
students have to do the posttest through reading test, too. While in control group,
the posttest is given without any treatment in teaching process. This can be seen in
Trinne Anggita Ayu Putri, 2014
THE USE OF MIND MAPPING IN IMPROVING STUDENTS’ READING COMPREHENSION ABILITY (A Quasi-Experimental Research at One Vocational High School in Bandung)
Universitas Pendidikan Indonesia | repository.upi.edu | perpustakaan.upi.edu
EG T1 X T2
CG T1 - T2
Description:
EG : Experimental Group
CG : Control Group
T1 : Pre test T2 : Post test
X : The treatments (five times)
(Adopted from Hatch and Farhady, 1982)
In order to discover the students‟ responses to the use of Mind Mapping in
improving their reading comprehension ability, the implementation of the action
is also followed by conducting questionnaire for those students in the
experimental group.
3.1.2 Variable
According to Hatch and Farhady (1982, p. 12) state that variable can be
defined as “an attribute of a person or of an object which „varies‟ from person to person or from object to object.” The variables used are classified into dependent
and independent variables:
1. The independent variable is mind mapping technique because this is the
prominent method which is investigated thus it is selected, manipulated, and
measured by the researcher (Hatch and Farhady, 1982, p. 15)
2. The dependent variable is students‟ reading score that is observed and measured
to determine the effect of the independent variable (Hatch and Farhady, 1982, p.
Trinne Anggita Ayu Putri, 2014
THE USE OF MIND MAPPING IN IMPROVING STUDENTS’ READING COMPREHENSION ABILITY (A Quasi-Experimental Research at One Vocational High School in Bandung)
Universitas Pendidikan Indonesia | repository.upi.edu | perpustakaan.upi.edu 3.2 Hypothesis
According to Hatch and Farhady (1982, p. 86) hypothesis means a
tentative statement about the outcomes of the research. It indicates that question
must answered by doing experimental. In line with the concept of hypothesis
mentioned above, the writer would like to propose two hypotheses as follows:
H0: there is no significant difference in means between control and experimental group.
HA: there is a significant difference between control and experimental group. If the result of the test shows that teaching reading comprehension using
mind mapping technique does not improve students‟ reading ability, it means
hypothesis null (H0) accepted. However, if the result of the test shows that
teaching reading comprehension using mind mapping technique improve students‟
reading comprehension ability, it means hypothesis null (H0) rejected and hypothesis alternative (HA) accepted.
3.3 Population and Sample
3.3.1 Population
Population is a whole research subject. Population is generalization area
which consists of object/subject which has certain quantity and characteristic
which is determined by researcher to study and then take summary (Arikunto,
2010, p. 173). The population of this study was the tenth grades students at one of
Vocational High School in Bandung, enlisted in academic year 2013/2014.
3.3.2 Sample
Sample is a part of population (Arikunto, 2010, p. 173). In this research the
writer just involved 35 students from two classes as the sample of the research.
Class X AP 2 is taken as the experimental group and class X AP 3 is chosen as the
Trinne Anggita Ayu Putri, 2014
THE USE OF MIND MAPPING IN IMPROVING STUDENTS’ READING COMPREHENSION ABILITY (A Quasi-Experimental Research at One Vocational High School in Bandung)
Universitas Pendidikan Indonesia | repository.upi.edu | perpustakaan.upi.edu
The consideration is based on Hatch and Farhady (1982) statement who
stated that “the total 30 students were chosen since it was the smallest size
required to get sample normally distributed” (p. 98). Moreover, the consideration
of taking smallest size sample is to avoid some students who suddenly absent
when they get the treatment sessions or even in the pre-test and post-test. Hence,
the number of the sample was 70 students from both classes.
However, the sample was chosen nonrandomized because it is the policy of
the school that only allows two classes are used as research subjects. This is one
of the limitations in this study, thus the researcher expects other researcher to
consider the sample by using random sampling techniques in further research.
3.4 Data collection
In order to obtain the data, this research use two instruments, namely
reading test (Pre-test and Post-test) and questionnaire.
3.4.1 Reading test (pretest and posttest)
In order to measure students' reading ability in form of score, the writer
conduct reading test. It is conduct to expose the effectiveness of mind mapping
technique to improve students‟ reading ability. The reading test include pre-test
and post-test. Pre-test is employed to both groups as the first step of study to know
students‟ reading comprehension ability and to find out that both groups have the
same capability of English before they receive the treatment. Furthermore,
post-test is employed at the end of the study to measure the students‟ reading
comprehension after the treatment. This is intended to find the differences
between students‟ score of both groups.
The reading test was carried out to 70 students as experimental and control
groups. The students should finish the test in 45 minutes. This test used the
Trinne Anggita Ayu Putri, 2014
THE USE OF MIND MAPPING IN IMPROVING STUDENTS’ READING COMPREHENSION ABILITY (A Quasi-Experimental Research at One Vocational High School in Bandung)
Universitas Pendidikan Indonesia | repository.upi.edu | perpustakaan.upi.edu
multiple choices which were adapted from internet and constitutes the result of
pilot test.
In this research, Barrett‟s Taxonomy Reading Comprehension is used to check students‟ comprehension at various levels. Following are the result of reading questions test analysis in Barrett‟s Taxonomy Reading Comprehension.
Table 3.1
Barrett’s Taxonomy Reading Comprehension
There are only four levels which appear in pretest and three levels which
appear in posttest. Indeed, the three major levels of Barrett‟s Taxonomy Reading
Comprehension (literal comprehension, reorganization and inferential
comprehension) are the most common type of question on tests (Teacher Link,
www.mgu.ac.jp/~ic/helgesen/marc.article1.htm). The questions of pretest and
posttest can be seen in Appendix 3.
The Barrett’s Taxonomy Item Number
Pre-test Post-test
1) Literal Comprehension 2, 5, 6, 7, 9, 10, 11, 12, 13, 14, 15, 16, 20
2, 3, 4, 5, 6, 7, 8, 9, 10, 11, 12, 13, 17, 18
2) Reorganization 8 1,
3) Inferential Comprehension 1, 3, 17, 18 14, 15, 16, 19, 20
4) Evaluation 4, 19 -
Trinne Anggita Ayu Putri, 2014
THE USE OF MIND MAPPING IN IMPROVING STUDENTS’ READING COMPREHENSION ABILITY (A Quasi-Experimental Research at One Vocational High School in Bandung)
Universitas Pendidikan Indonesia | repository.upi.edu | perpustakaan.upi.edu 3.4.2 Questionnaire
Besides test, the writer use questionnaire to know the students‟ impression
and response about the use of mind mapping to improve their reading
comprehension ability in the classroom. Close-ended questionnaire is used in the
study in order to provide consistency of response across the students and generally
easier to use and analyze related to the objectives of the study (Nunan, 1992).
In constructing each question in the questionnaire, it is important to
determine the data that should be gathered related to the objective of the study
(Nunan, 1992). Thus the questionnaire items were divided into three general
aspects, based on general perception on their skill of reading before treatment is
conducted, based on general idea on the students‟ skill after the treatment is
conducted and based on general ideas on their perceptions towards the use of
mind mapping.
The question consists of ten items. Those questions were only given to
experimental group after the students finish their post-test. There were 35
respondents involved in the questionnaire session.
3.5 Research Procedure
3.5.1 Lesson planning
There were some lesson plans that are used in experimental and control
group during the treatments. Those lesson plans were designed for five meeting.
The first and the last meeting were allocated for pre-test and post-test, while the
rest of five meetings were allocated for the treatment season. Furthermore, the
researcher also managed the teaching procedure by measuring time allotment,
Trinne Anggita Ayu Putri, 2014
THE USE OF MIND MAPPING IN IMPROVING STUDENTS’ READING COMPREHENSION ABILITY (A Quasi-Experimental Research at One Vocational High School in Bandung)
Universitas Pendidikan Indonesia | repository.upi.edu | perpustakaan.upi.edu 3.5.2 Administering a pilot test
Pilot test was intended to measure the validity, reliability and testing the
difficulty level of the instrument. It was conducted before pre-test and post-test. It
was conducted as reflection in making some reflections or changes in the test
instrument. The pilot test was given to the students in similar level which are not
included in control and experimental group. The test consist of 50 multiple choice
items that were administered to 40 students. The result of the try out is presented
in Appendix 2.
3.5.3 Conducting treatment
In this study, treatment was implemented only in the experimental class by
applying mind mapping technique in teaching and learning process. Whereas, in
control group, teaching and learning process was not applied mind mapping
technique as a treatment. However, both of group were in similar condition. The
treatments were conducted in five meetings.
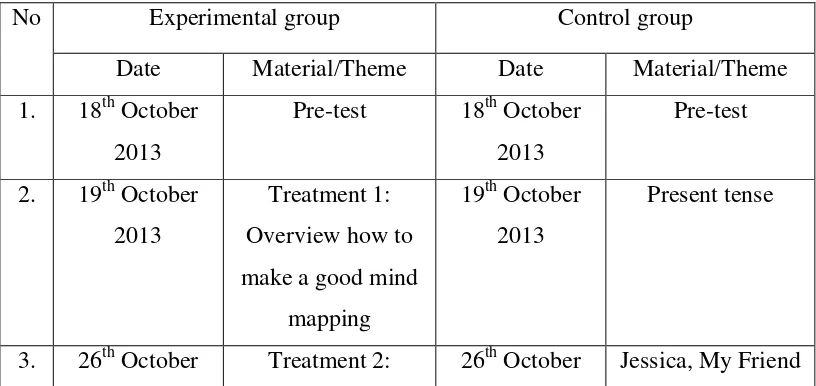
The treatment schedule was set to make the experiment run well. The
materials, themes and lesson plans were also set to follow the material schedule of
the school. The details of the treatment activity are shown in the following table:
Table 3.2
Schedule of the Study
No Experimental group Control group
Date Material/Theme Date Material/Theme
Trinne Anggita Ayu Putri, 2014
THE USE OF MIND MAPPING IN IMPROVING STUDENTS’ READING COMPREHENSION ABILITY (A Quasi-Experimental Research at One Vocational High School in Bandung)
Universitas Pendidikan Indonesia | repository.upi.edu | perpustakaan.upi.edu 2013 Jessica, My Friend 2013
4. 2nd November
material presented is about of someone‟s identity and biography.
Treatment 1
In the first meeting, the teacher introduced students with the mind mapping
technique. Since building knowledge or preparation is the first stage of teaching
(Cooper, 1990). In this stage, the teacher should build up students‟ background
knowledge about mind mapping, thus, the teacher tells students what mind
mapping is and how to implement mind mapping in reading comprehension. The
teacher gave students a simple text and shows how to make mind mapping from
the text. In the end of the meeting, the students were given some questions about
the text they have learned. In order to know more detail see lesson plan in
Trinne Anggita Ayu Putri, 2014
THE USE OF MIND MAPPING IN IMPROVING STUDENTS’ READING COMPREHENSION ABILITY (A Quasi-Experimental Research at One Vocational High School in Bandung)
Universitas Pendidikan Indonesia | repository.upi.edu | perpustakaan.upi.edu Treatment 2
In second meeting, students should be able to implement the previous lesson
on how to read a text using mind mapping. They were required to apply the steps
of making mind mapping based on the text they have read. Hence, first, the
teacher gave students a text about someone‟s identity entitle “Jessica, My Friend”.
Students should read text carefully and make mind mapping based on the text. In
this meeting, the students were guided by the teacher in making mind mapping.
Teacher gave some keywords to be applied in their mind mapping. After that, the
students continued to write important information from the text into their mind
mapping. At the end of the meeting, students answer some questions related to the
text. In order to know more detail see lesson plan in Appendix 1.
Treatment 3
In third meeting, the level of the text was increased as scaffolding strategy
(Alber, 2014). The students are given a longer text about biography of Barack
Obama. Before they read a text, they should answer some questions that contain
of vocabulary in order to help them in reading a text. After that, they read text
carefully and make mind mapping based on the text. In this meeting the students
are not guided by teacher in making mind mapping. They are free to be creative to
make mind mapping with colors and pictures (Buzan, 2006). In the end of
meeting, students have to complete a cross puzzle which contain of some
questions related to the text. In order to know more detail see lesson plan in
Appendix 1.
Treatment 4
In fourth meeting, the students are given biography text of Zayn Malik, a
member of boy band One Directions. Before they read the text, they pay attention
to vocabularies in the box. Those help them in understanding the text and also
Trinne Anggita Ayu Putri, 2014
THE USE OF MIND MAPPING IN IMPROVING STUDENTS’ READING COMPREHENSION ABILITY (A Quasi-Experimental Research at One Vocational High School in Bandung)
Universitas Pendidikan Indonesia | repository.upi.edu | perpustakaan.upi.edu
understanding all vocabularies in the box, they start to read the text carefully. As
usual, they should make mind mapping based on the text they have read. They are
free to be creative to make mind mapping with colors and pictures. After that,
students have to answer the questions related to the text. In the end of the meeting
the students get assignment as a home work that is finding biography text about
their idol in the internet or magazine. The text will be used for the material at the
last meeting. In order to know more detail see lesson plan in Appendix 1.
Treatment 5
The fifth meeting is the last meeting in which the students should apply the
mind mapping technique in reading comprehension based on what they have
learned individually. In this meeting the students bring a biography text about
their idol. Teacher asks them one by one about their idol. After that, teacher
reminds them about how to make a good mind mapping. Teacher also gives some
keywords of what should students write in their mind mapping. They ask to make
mind mapping based on their text. In the end of the meeting they should present
and explain their mind mapping of their idol in front of class, while other students
pay attention and may give a question or comment. In order to know more detail
see lesson plan in Appendix 1.
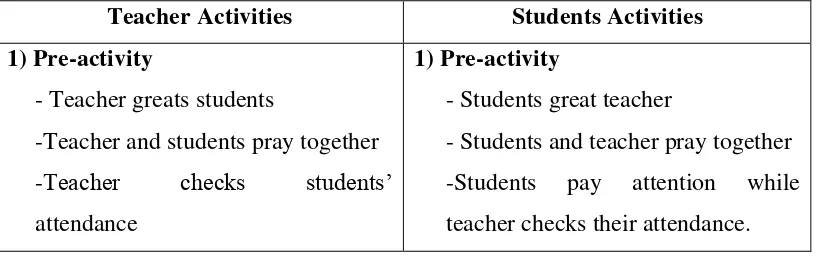
To clarify the teaching and learning process in experimental group,
following is the steps of teaching and learning process by using mind mapping:
Table 3.3
Steps of Teaching and Learning Process
Teacher Activities Students Activities
1) Pre-activity
- Teacher greats students
-Teacher and students pray together
-Teacher checks students‟
attendance
1) Pre-activity
- Students great teacher
- Students and teacher pray together
-Students pay attention while
Trinne Anggita Ayu Putri, 2014
THE USE OF MIND MAPPING IN IMPROVING STUDENTS’ READING COMPREHENSION ABILITY (A Quasi-Experimental Research at One Vocational High School in Bandung)
Universitas Pendidikan Indonesia | repository.upi.edu | perpustakaan.upi.edu -Brainstorming: Teacher shows
picture of someone. (Do you know
Where is he/she come from? What is
her/his profession? Etc.)
- Students receive biography text of
a public figure
~Elaboration
- Students identify text before
reading the text.
- Students read the text carefully
- Students prepare to make mind
mapping based on the text they have
read
-Students make mind mapping of
Trinne Anggita Ayu Putri, 2014
THE USE OF MIND MAPPING IN IMPROVING STUDENTS’ READING COMPREHENSION ABILITY (A Quasi-Experimental Research at One Vocational High School in Bandung)
Universitas Pendidikan Indonesia | repository.upi.edu | perpustakaan.upi.edu ~Confirmation
mapping in front of class.
- Some students are allowed to give
comments and appreciation of
students‟ presentation.
- Students answer the question
related to the text individually.
3) Last activity
3.5.4 Administering pretest and posttest
Pre-test and post-test was conducted in experimental and control group to
know the score of students, whether or not mind mapping can improve students‟
reading comprehension ability. The pre-test was intended to measure the students‟
comprehension in reading before they get treatment. After series of treatments
were conducted, test was also administered to the both of group. The
post-test was intended to know students‟ comprehension in reading after they got
Trinne Anggita Ayu Putri, 2014
THE USE OF MIND MAPPING IN IMPROVING STUDENTS’ READING COMPREHENSION ABILITY (A Quasi-Experimental Research at One Vocational High School in Bandung)
Universitas Pendidikan Indonesia | repository.upi.edu | perpustakaan.upi.edu 3.5.5 Administering questionnaires
The questionnaires were conducted only to the experimental group students
after post-test performed. The researcher used close-ended questionnaire to know
students‟ responses toward the use of mind mapping in reading comprehension
during treatment.
3.6 Data Analysis
3.6.1 Scoring procedure
The instrument used in the research was in the form of multiple-choice
questions. The data were collected by using research instrument. After the data
were collected, and then the data analysed by using scoring technique. According
to Arikunto (2002) there are two kinds of formula can be used to process the
multiple choice item data, the formula with punishment and without punishment.
This study used the formula without punishment. The formula is stated as follows:
S : Score
R : Right answer
3.6.2 Analysis of data from the pilot test
This pilot test was administered to check validity, reliability, and testing the
difficulty level of the instrument. It was conducted before doing pre-test and post
test. Forty multiple choices questions were tested to the students out of sample.
The valid and reliable items are used as pre-test and post-test.
3.6.2.1 Analysis of the validity
Validity is measurements which show the validity level of quality level of
instrument (Arikunto, 2002). The data are calculated using Anates V4.
Trinne Anggita Ayu Putri, 2014
THE USE OF MIND MAPPING IN IMPROVING STUDENTS’ READING COMPREHENSION ABILITY (A Quasi-Experimental Research at One Vocational High School in Bandung)
Universitas Pendidikan Indonesia | repository.upi.edu | perpustakaan.upi.edu Table 3.4
Category of Coefficient Correlation of Validity
Raw Score Interpretation
0.80-1.00 Very high 0.60-0.80 High 0.40-0.60 Moderate
0.20-0.40 Low
0.00-0.20 Very low
(Arikunto, 2002)
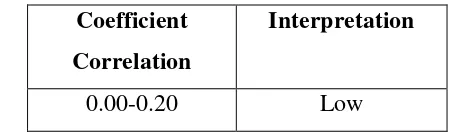
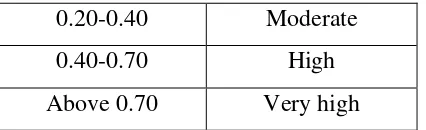
3.6.2.2 Analysis of the reliability
According to Hatch and Farhady (1982), reliability is the extent to which a
test procedure reveals a consistent result when administered under similar
condition. This study used Anates V4 to reveal the item‟s reliability. It is used to
assure whether or not the test is reliable to be used in pre-test and post-test. The
test item is reliable if the raw score are 0.40-0.70. The following is shown the
criteria of reliability:
Table 3.5
Category of Coefficient Correlation of Reliability
Coefficient
Correlation
Interpretation
Trinne Anggita Ayu Putri, 2014
THE USE OF MIND MAPPING IN IMPROVING STUDENTS’ READING COMPREHENSION ABILITY (A Quasi-Experimental Research at One Vocational High School in Bandung)
Universitas Pendidikan Indonesia | repository.upi.edu | perpustakaan.upi.edu 0.20-0.40 Moderate
0.40-0.70 High
Above 0.70 Very high
(Arikunto, 2002)
3.6.2.3 Analysis of the difficulty level
According to Arikunto (2006) difficulty level is used to measure how far
the test items are relevant with the participants‟ ability. Arikunto (2010) also
states that the difficulty test analysis which a good item should not to be too
difficult or too easy. It can be analyzed by using difficulty index, as follows:
Where:
P = Index of difficulty
B = the number of students who can answer the item correctly
JS = the number of students
Furthermore, difficulty level gained from the test results were interpreted
using the classification of difficulty level as follows:
Table 3.6
Difficulty Test Item Interpretation
Index of Difficulty Difficulty Degree
0.00-0.30 Difficult
0.30-0.70 Moderate
0.70-1.00 Easy
(Arikunto, 2006)
3.6.2.3 Analysis of the discrimination index
Discrimination index is used to indicate how far a single test item can
distinguish the upper group from the lower group of class (Arikunto, 2006)
P = B
Trinne Anggita Ayu Putri, 2014
THE USE OF MIND MAPPING IN IMPROVING STUDENTS’ READING COMPREHENSION ABILITY (A Quasi-Experimental Research at One Vocational High School in Bandung)
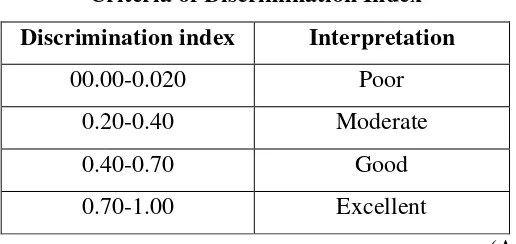
Universitas Pendidikan Indonesia | repository.upi.edu | perpustakaan.upi.edu Table 3.7
Criteria of Discrimination Index
Discrimination index Interpretation
00.00-0.020 Poor
0.20-0.40 Moderate
0.40-0.70 Good
0.70-1.00 Excellent
(Arikunto, 2006)
The table shows the criteria of discrimination index which differ the upper
and lower group.
3.6.3 Analysis of the data from pretest and posteset
The data gather from both of pretest and posttest was analyzed by using
SPSS 20.0 for window. There are four steps in analyzing the data, normality test,
homogeneity test, independent t-test, and effect size.
3.6.3.1 Analysis of thenormality distribution test
Normality distribution aims to investigate whether or not the distribution
of pretest and posttest score in two groups are normally distributed. It is calculated
before t-test. The statistical calculation of normally test use
Kolomogrove-Simirnov. The following are the steps:
1. Setting the level of significance at 0.05 and establishing the hypothesis as
follows:
H0 : the distribution of scores in experimental and control groups are normally distributed.
H1 : the distribution of scores in experimental and control groups are not normally distributed.
2. Analyzing the normality distribution with One-Sample
Trinne Anggita Ayu Putri, 2014
THE USE OF MIND MAPPING IN IMPROVING STUDENTS’ READING COMPREHENSION ABILITY (A Quasi-Experimental Research at One Vocational High School in Bandung)
Universitas Pendidikan Indonesia | repository.upi.edu | perpustakaan.upi.edu
3. Comparing the Asymp.sig with the level of significance for testing the
hypothesis. If the Asymp.sig is more than the level of significance
(Asymp.sig > 0.05), the null hypothesis is not rejected and the distribution of
data is normal. Hence, if the Asymp.sig is less than the level of significance
(Asymp.sig < 0.05), the null hypothesis is rejected and the data is not
normally distributed.
3.6.3.2 Analysis of the homogeneity of variance test
According to Arikunto (2010) homogeneity of the variance is one of
requirements that should be fulfilled by experimental group and control group. It
is used to check whether the experimental and the control group postest score
were homogenous or not. The following are the steps of analyzing of variance by
using Levene test in SPSS 20 for window:
1. Setting the level of significance at 0.05 and establishing the hypothesis as
follows:
H0 : the variance in experimental and control groups are homogenous.
2. Analyzing the homogeneity of variance by using Levene test in SPSS 20 for
windows.
3. Comparing the Asymp.sig with the level of significance for testing the
hypothesis. If the Asymp.sig is more than the level of significance
(Asymp.sig > 0.05), the null hypothesis is not rejected and the variance of
data are homogeneous. However, if the Asymp.sig is less than the level of
significance (Asymp.sig < 0.05), the null hypothesis is rejected and the
variance are not homogeneous.
3.6.3.3 Analysis of theindependent t-test
As Kranzler and Moursund (1999, p. 90) state that t-test for independent is
“to reflect a significant difference between the two groups under comparison”.
Trinne Anggita Ayu Putri, 2014
THE USE OF MIND MAPPING IN IMPROVING STUDENTS’ READING COMPREHENSION ABILITY (A Quasi-Experimental Research at One Vocational High School in Bandung)
Universitas Pendidikan Indonesia | repository.upi.edu | perpustakaan.upi.edu
difference between the mean of both classes, experimental and control groups. the
independent t-test is conducted to see whether there is a significance difference
between the experimental and control group‟s score on pretest and posttest. There
are three steps in analyzing the independent t-test.
1. Seting the level of significance at 0.05 (two-tailed test) and setting
hypothesis.
H0 : there is no significant difference in means between control and experimental group.
2. Analyzing the independent t-test by using SPSS 20 for windows.
3. If the t obtain value is less than to t critical value at the level significance 0.05
(two-tailed), the null hypothesis (H0) is not rejected, and it can be concluded that there is no significant difference in means between control and
experimental group. If t obtain value is more than or equal to t critical value
at the level significance 0.05 (two-tailed), the null hypothesis is rejected, and
it means that there is significance difference in means between control and
experimental group.
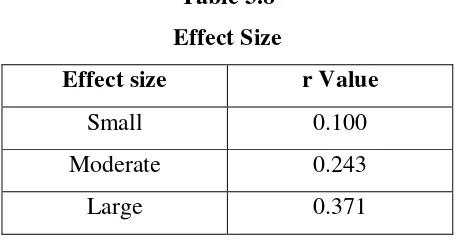
3.6.3.4 Analysis of the effect size
Effect Size is calculated to investigate how important the effect of the
independent variable in practical terms. It means that effect size is a way to
consider how well the treatment works if there is a large different between the two
group‟s means. If the treatment worked well then there will be a large effect size.
The formula of effect size as follows:
Where:
r = effect size
Trinne Anggita Ayu Putri, 2014
THE USE OF MIND MAPPING IN IMPROVING STUDENTS’ READING COMPREHENSION ABILITY (A Quasi-Experimental Research at One Vocational High School in Bandung)
Universitas Pendidikan Indonesia | repository.upi.edu | perpustakaan.upi.edu
After the value of r has been obtained, the scores are matched with the
following scale to interpret the effect size.
Table 3.8
Effect Size
Effect size r Value
Small 0.100
Moderate 0.243
Large 0.371
(Arikunto, 2010)
3.6.4 Analysis of the data from questionnaire
The researcher uses questionnaire to clarify the information and explain the
data focusing the research question about what are the students‟ response toward
the use of mind mapping in learning process to improve their reading
comprehension ability.
In analyzing the data of the questionnaires, the answers of students on the
questionnaires are categorized into three major findings, that are the students‟
responses based on general perception on their skill of reading before treatment
was conducted, based on general idea on the students‟ skill after the treatment was
conducted, and based on general ideas on their perceptions towards the use of
mind mapping. Then three major points are also elaborated based on students
answers of the questionnaires.
In the end, the researcher is interpreting the data to reveal the points which
have been categorized. The finding of students‟ answers on the questionnaires are
calculated and depicted in the chart.
Trinne Anggita Ayu Putri, 2014
THE USE OF MIND MAPPING IN IMPROVING STUDENTS’ READING COMPREHENSION ABILITY (A Quasi-Experimental Research at One Vocational High School in Bandung)
Universitas Pendidikan Indonesia | repository.upi.edu | perpustakaan.upi.edu Table 3.9
Criteria Percentage of Respondent
Percentage of respondent
Criteria
1-25% Small number of students
26%-49% Nearly half of students
50% Half of students
51%-75% More than half of students
76%-99% Almost of students
100% All of students
The formula of percentage is used to analyze the questionnaires. The data
are interpreted based on the frequency of the students‟ answers. The formula
describes as follows:
Where:
P = percentage
F = amount of each response for certain question